- check your trading ideas on gigabytes of the tick history of stocks, futures and cryptocurrencies;
- create your own indicators;
- create your own completely automatic strategies with a direct connection to main exchanges.
Naturally, you have to be able to program using the C# programming language, since ATAS is written in this popular language from Microsoft. However, it is mostly for those who have programming experience and are acquainted with respective terminology.
The present tutorial article was written by a non-professional programmer and everything is described in simple words. This practical article is for those who are novices in the C# programming language but who have at least some experience in trading with the use of the ATAS platform.
Goals of the article:
- To show how the trading and analytical ATAS platform interacts with the Visual Studio development environment, in which programs on C# are developed.
- To give some introductory knowledge of C#. There are some understatements in the text. It is natural, since you can get more reference information about C# from open sources. Otherwise, the article will become a thousand page folio.
If you decide to develop your skills in creating your own algorithms for hooking up to ATAS by API, it goes without saying that you will have to study C# using textbooks, training courses and videos, which you can find a lot on the Internet. They clearly explain methods, classes, variable types, operations with them, arrays, cycles and so on – everything you need to be able to write a code. However, you will hardly find examples of indicators, which work with real stock exchange data, in them. Instead, you will find them in the present article.
Plan of the article:
- Visual Studio installation.
- Transfer of algorithms from Visual Studio to ATAS.
- Writing simplest algorithms.
- Checking efficiency of trading by a simplest strategy.
- Bonus.
You will get a file for Visual Studio with the source code, which is used in the text, at the end of the article. If you have questions, ask them in the comments.
Let’s go!
What to start with
You should start with installation of Microsoft Visual Studio – environment, in which various products, including dll libraries, are developed on C#. You can hook up your algorithms to ATAS namely in the format of dll libraries.You can download the Visual Studio Community distribution package (the free version is sufficient) from visualstudio.microsoft.com//downloads/.
Install Visual Studio on your computer as any other application. We use the English language in the screenshots.
Launch it and select Create Class Library (.NET Standard).
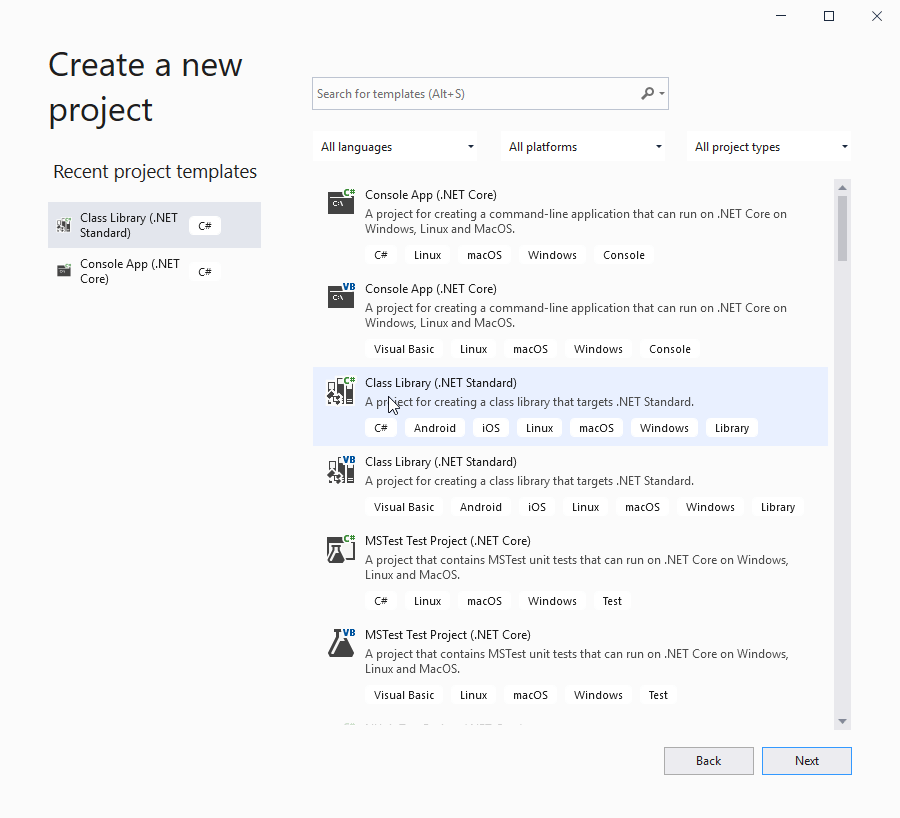
What is the idea of the Class Library? It is a separate component in a big application. In our case, we will create a dll file with our own classes in order to hook it up as a component to the ATAS platform.
You will see soon how it works.
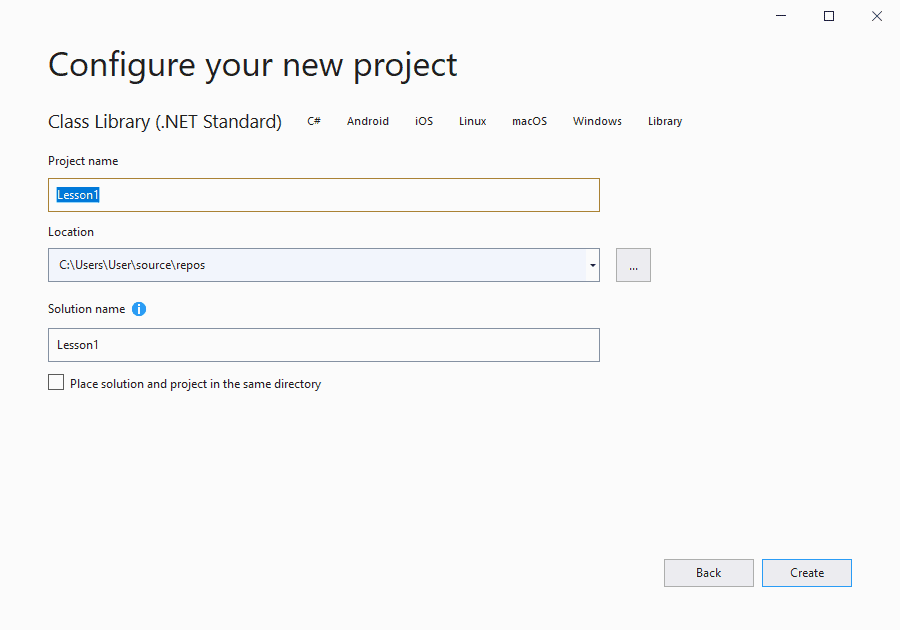
Visual Studio will launch and create an empty Class Library template (see the screenshot below).

A big area to the left is the place, where the program code is edited. In our case, it is the Class1.cs editor.
The following is available in our code after creating a template:
- using – the key word, which means that we hook up additional sources (namespaces). Using System (2) is offered by default, because it contains basics, which we would definitely use;
- namespace Lesson1 – is our name space. It, kind of, draws a boundary line between different sections of the code so that they do not come into conflict because of similar names;
- public class Class1 – is a template of our class. C# is an object-oriented programming language (OOPL) and Class is its compulsory element.
First steps
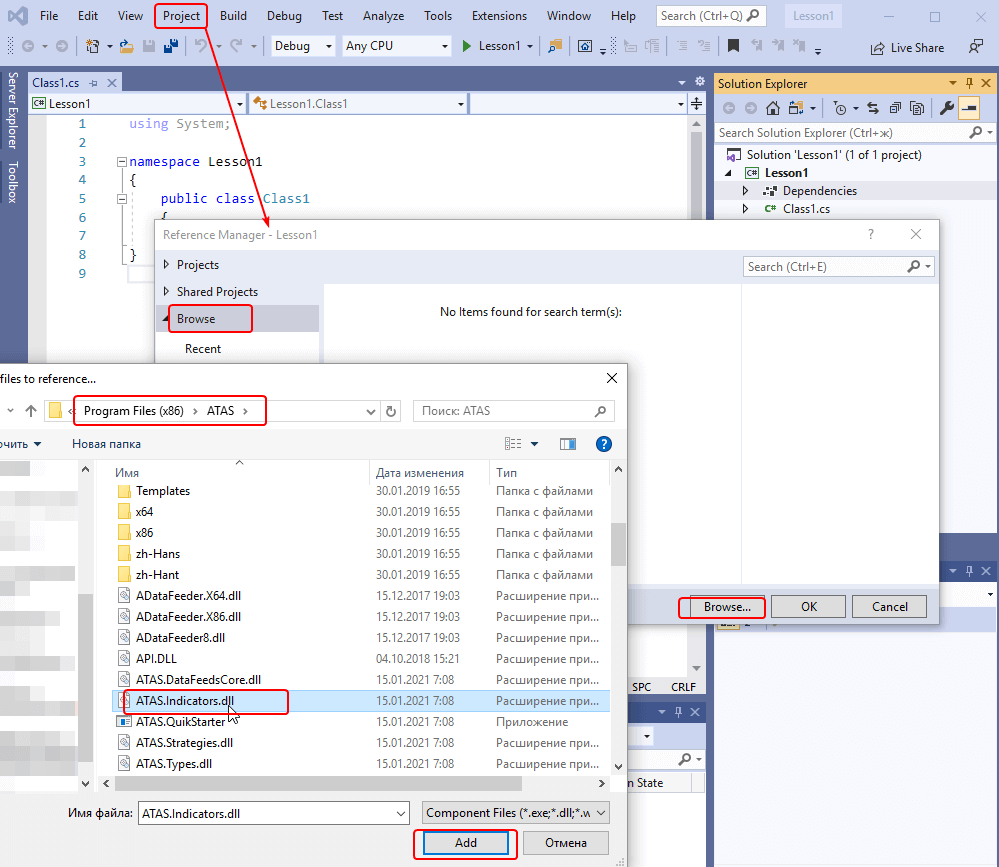
Let’s hook up to ATAS.To do it, we need to add a link to ATAS.Indicators.dll library, which is in the directory of the installed ATAS platform.
We select Add Reference in the Project menu item or by clicking the right mouse button on the Dependencies tab in the Explorer window.
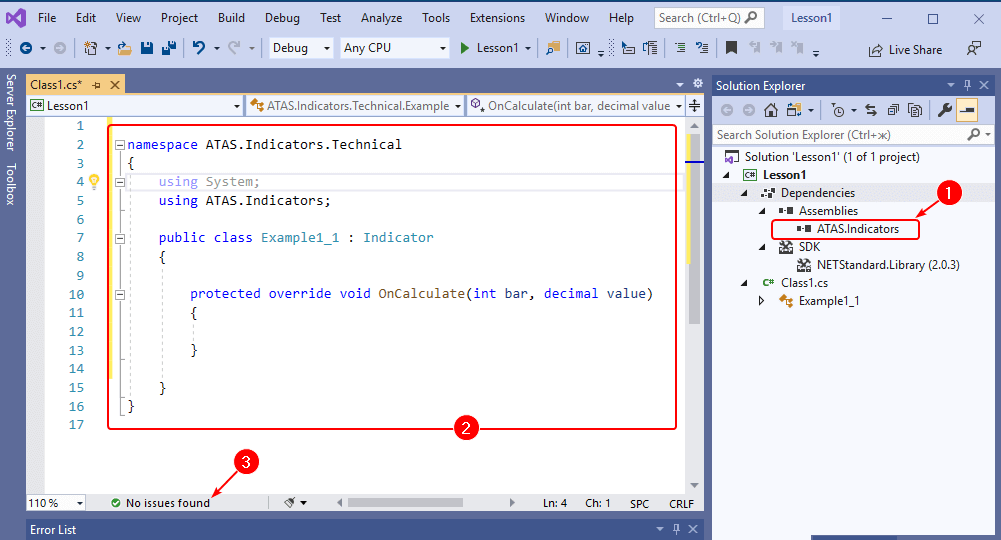
We write namespace ATAS.Indicators.Technical because we will create our own algorithm in the space of other technical ATAS indicators.
Then we add using ATAS.Indicators. You will always use this reference when creating algorithms for ATAS (in the next but one paragraph).
Then we edit public class Example1_1 : Indicator. Example1_1 in this line means that we make the first example from the first lesson (you can write any other name, which will be then displayed in the ATAS indicator list).
As regards the colon and the word Indicator, they are quite important. This is how we state that the Indicator class (it is in the ATAS.Indicators.dll) is a parent class and our Example 1_1 class inherits everything, which is available in the parent class. It means that we get access to all functions, which are allowed to be inherited by the Indicator class inheritors – which include operations with prices, clusters, other indicator values, etc.
Then we write protected override void OnCalculate(int bar, decimal value) and two curly braces. This code section is called the OnCalculate method.
In simple words, a method is a set of commands to the computer for execution. The OnCalculate method is declared as compulsory inside the parent. When you add your indicator to the chart, the platform will execute commands, which you write inside curly braces. If you do not have the OnCalculate method, Visual Studio will not allow you to build the code into a dll file, since it is compulsory to have it. Otherwise, ATAS will not understand what it has to execute.
If you did everything right, there will be No issues found (3) at the bottom. If errors are shown, try to understand what went wrong. What can go wrong:
- C# is case sensitive. It means that uppercase and lowercase letters in the code are interpreted differently.
- Curly braces, semicolons, quotation marks and other symbols – all of them are significant. In case you missed or lost something, Visual Studio will help you by giving suggestions.
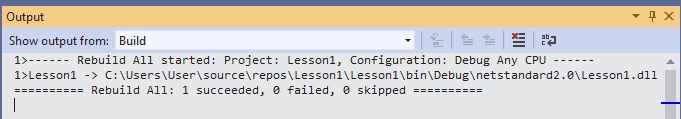
Now, when you have the error-free code, let’s build it. To do it, select Build Lesson1 in the Build menu item (or press CTRL+B) and a message that the code was successfully built into a file should appear in the Output window.
We launch ATAS, open the chart, load the instrument data and call the indicator manager window. What do we see there?
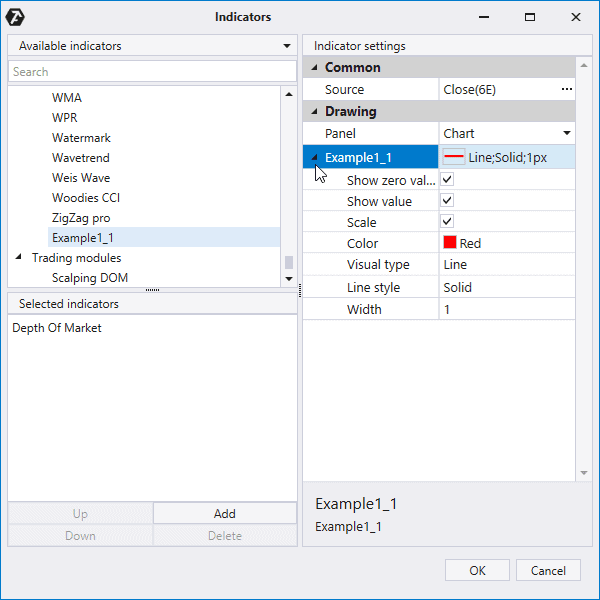
Note that despite the fact that we didn’t write, practically, any code, our indicator contains:
- a possibility to select the Source;
- panel selection for display;
- display settings (color, line style, etc.).
Our indicator inherited all these settings from the parent Indicator class. We can change them but we will leave them in place for a while.
If we add Example1_1 to the chart, the indicator will appear in the list of added indicators but, in fact, nothing will change, since there is no code in the OnCalculate method. There are no commands for execution.
However, if you change the indicator display panel and specify New Panel instead of Chart, you will see the following:
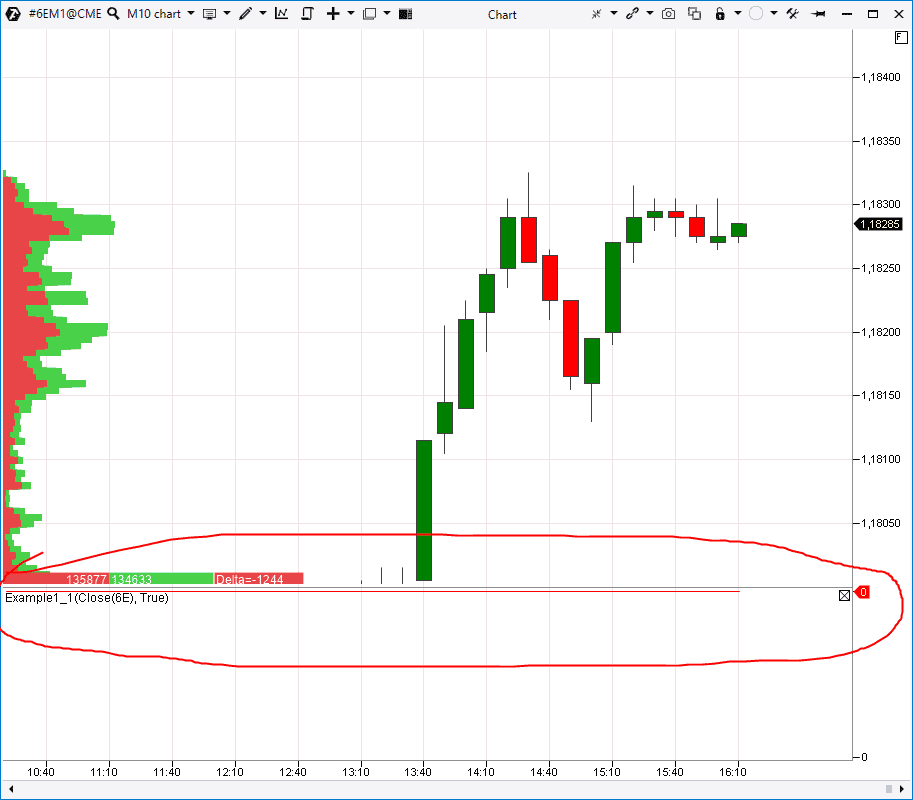
This is because when you create your own Example1_1 class and inherit it from the parent Indicator class, one data array is added automatically to your class. It is called DataSeries, which is an array, which contains your indicator values for every bar.
Let’s imagine that we add the Example1_1 indicator to the chart, which contains 458 bars.

The Example1_1 line will store our indicator values. However, the line stores default values, which are zeros, since we wrote no code for their calculation.
You might have noticed that the OnCalculate method has parameters in the code (int bar, decimal value). Now then:
- bar is an integer variable. The bar sequence number is stored here;
- value is a decimal variable. The indicator value, which corresponds with this bar, is stored here.
Perhaps, this might sound not very clear for a novice. That is why we will return to indicator value calculations on another occasion and meanwhile we will do something very easy.
First program
Usually, the first program for those who start studying C# programming language is to display the ‘Hello, world!’ message on the screen.However, since we write a library for ATAS, we will display this message in the Logs window. It is practically the same.
In order to perform our task, we add the Utils.Common.dll reference to the project from the directory, where ATAS was installed. We do it the same way as we added ATAS.Indicators.dll.

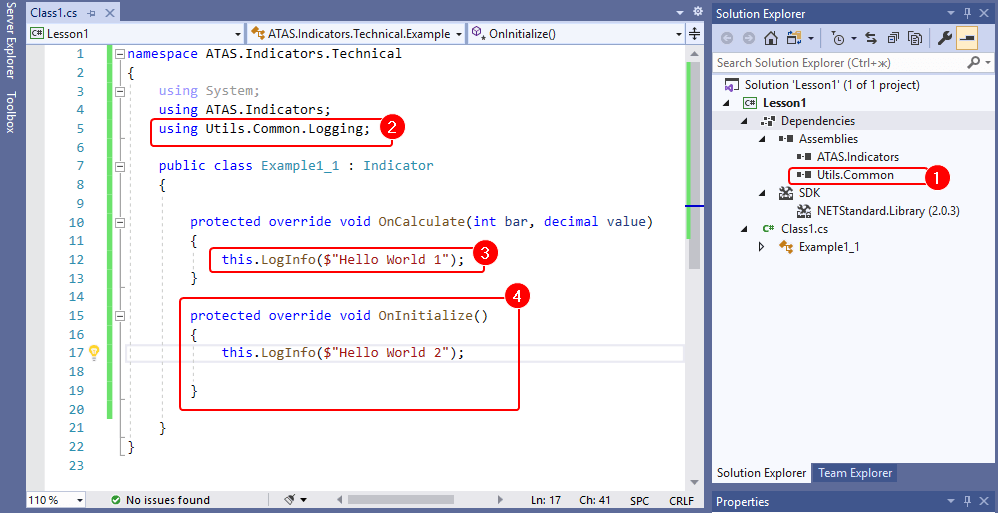
We add using Utils.Common.Logging; – this is required for the indicator to display messages in the Logs window of the ATAS platform.
We add this.LogInfo($”Hello World 1″); into the OnCalculate method body. This command is for displaying the ‘Hello World 1’ text phrase in the Logs window.
Then we create one more method – protected override void OnInitialize(). You will soon see what for. We write this.LogInfo($”Hello World 2″); in the method body.
Then we start a build.

In the event ATAS is launched on your computer, you will see the following message:
Some libraries were changed. You can reload the strategies in the main window status bar.
Don’t get frightened – this is excellent news! You do not have to reload the platform (it may take some time) when you update your dll in the Indicators directory.
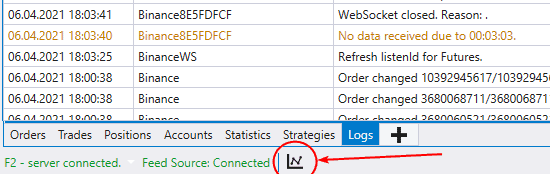
Then we open the daily chart (for example, ED) and specify Days Count = 5 in the time-frame settings window so that the chart would show 5 candles only. We add the Example1_1 indicator to the chart and check the Logs window:
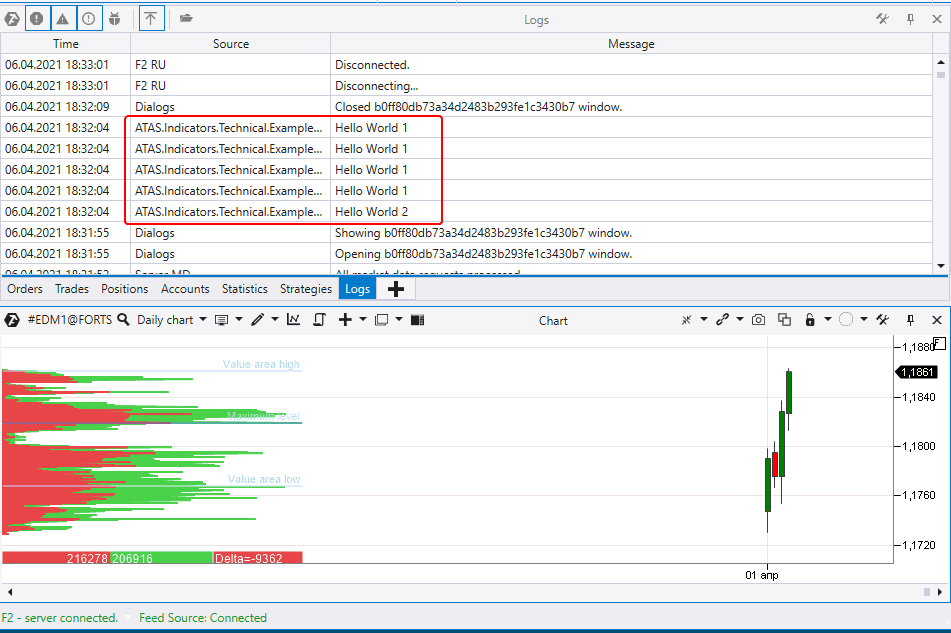
It means that:
- Commands in the OnCalculate method are executed for every bar and then the method continues its execution with every new tick in order to calculate the indicator values in real time.
- As regards the OnInitialize method, it is executed only once when the indicator is initialized. It takes place before execution of the OnCalculate method commands.
Bingo! Our first ‘Hello World’ program works! Let’s make our task harder now.
Second program
Let’s write an indicator, which would display (in the Logs window) information about the most recent bar – whether it is bullish (Close>Open) or bearish (Close<Open)?We select Add Class in the Project menu item. Let its name stay Class2.cs. The new class (1) will appear in the Explorer window. Doubleclick it and its code editor will open.

var candle = GetCandle(CurrentBar-1);
What does this line mean? Let’s read it from right to left.
- ‘CurrentBar’ is a variable, which equals the number of candles in the chart. However, since the enumeration starts from zero, the most recent candle in the table has the number CurrentBar-1.
- ‘GetCandle’ is a method (command) from the parent Indicator class. The computer executes this command through reading all available information about the candle in the chart with the number, which is specified in braces.
- ‘var candle’ is how we declare a new object in order to use it in our program. In the event we declare a new object, it is better to assign a value to it immediately. It can be done with the ‘equal’ sign.
All together – we declare the ‘candle’ variable and put information in it about the most recent candle in the chart. Now we can deal with this information. In our case – to apply the conditional ‘if-else’ construction (conduct a comparison operation).
If the Close price in our candle is bigger (higher) than the Open price, we write ‘Last bar is Bullish’ in the log. Otherwise, if it is less or equal, we write ‘Last bar is Bearish’ in the log.
We build the dll file though the Build menu item and paste the Lesson1.dll into the directory with indicators. Then we press the respective icon in ATAS to update libraries in the platform. Then we open the chart:
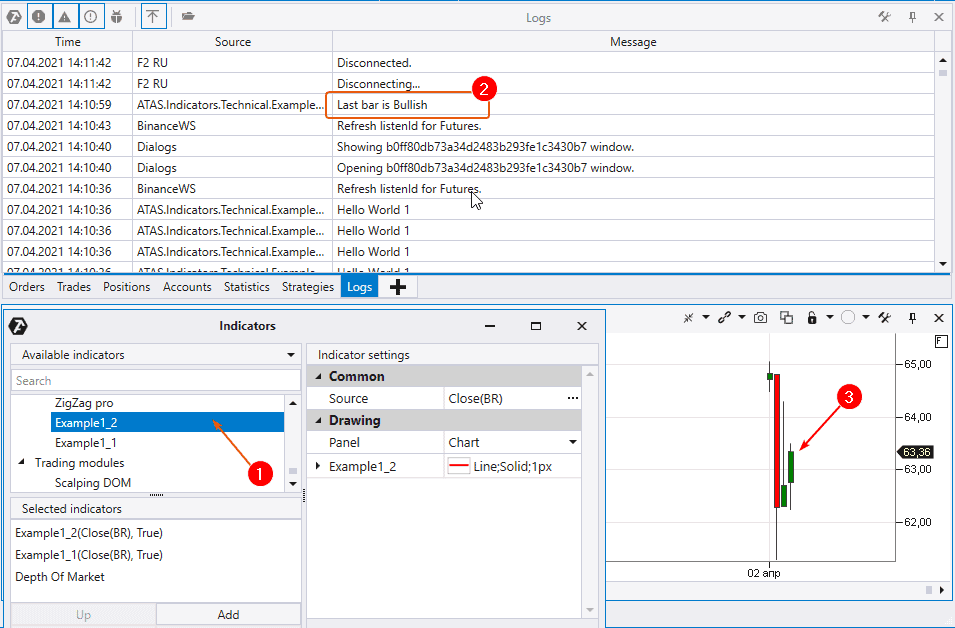
- Now we can see Example1_2 in the indicator manager. ATAS reads every class from the Lesson1 library as a separate indicator. We add Example1_2 to the chart.
- There is a message in the Logs window – ‘Last Bar is Bullish’.
- We check the chart and voilà – it works!
Let’s make it even more complicated.
Third program
Let’s develop a program, which would read the number of bullish and bearish bars in the chart.We add a new Class3 in the Project menu item. It appears (see the screenshot below) in the Explorer window (1). We change the class name to Example1_3 and write the following code (3) in the OnInitialize method:
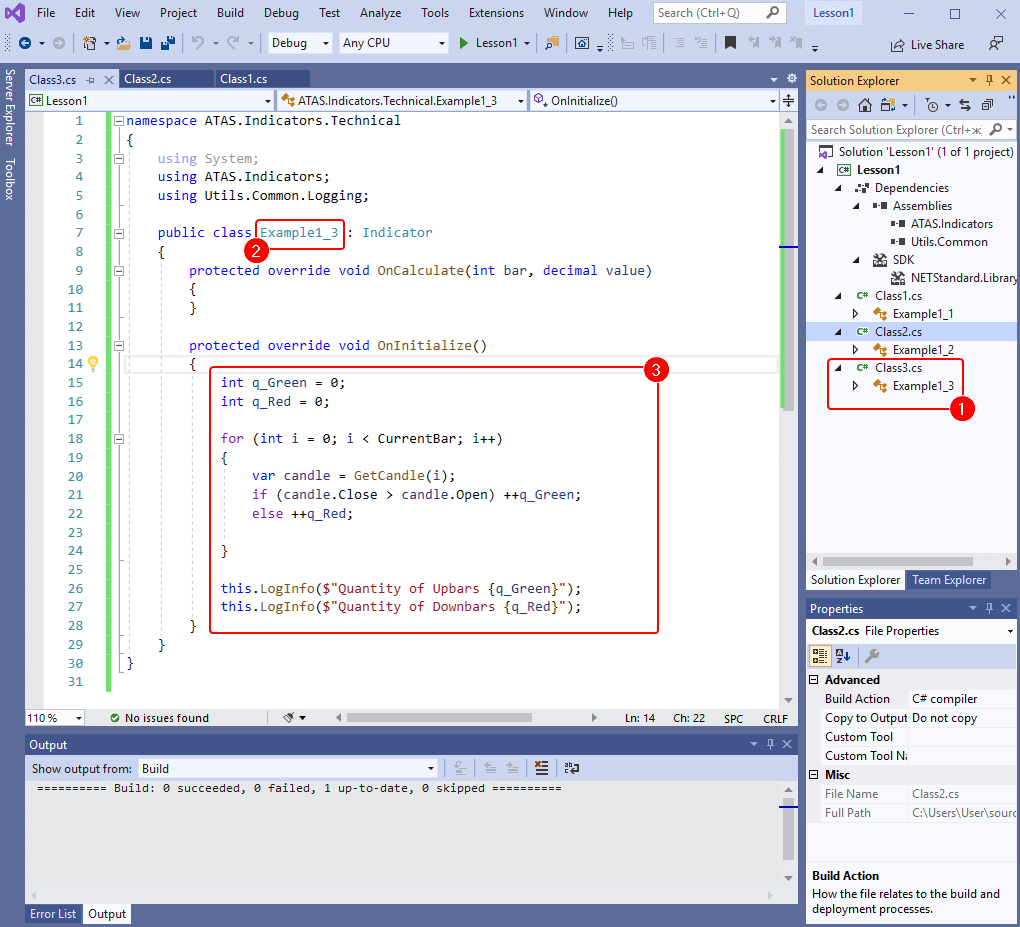
We added two variables: q_Green and q_Red. Both have the ‘int’ type (int – integer) and both equal zero. We will use them for calculation.
Then goes the ‘for’ cycle. This cycle is good when some operation should be executed several times. In our case, the number of iterations is equal to the number of bars in the chart, which is stored in the CurrentBar. The ‘i’ variable is a counter, which equals zero at the beginning. However, it is increased by 1 with every cycle operation (iteration). The cycle will be executed until ‘i < CurrentBar’ is true.
When the first cycle is executed, our indicator sends the GetCandle(0) command, receives data about the first (left) candle in the chart and puts them into the ‘candle’ object. Then it compares candle.Close and candle.High and, depending on this comparison, increases q_Green or q_Red.
And so on for every bar. When the cycle is over, the LogInfo command prints some text and values of q_Green or q_Red variables in the Logs window.
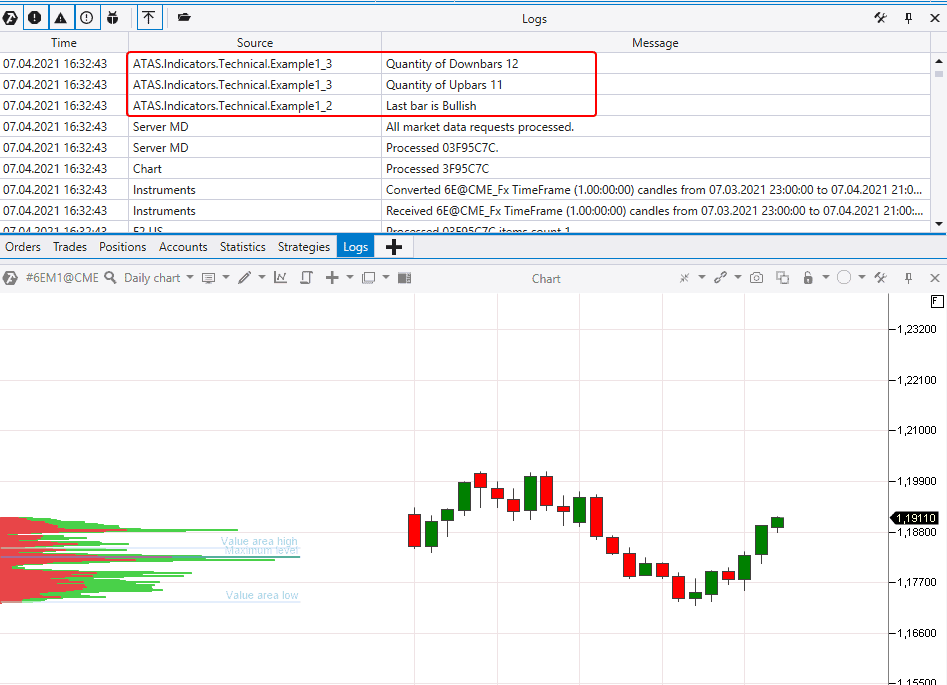
Now we build our indicator library, copy it to the same directory, overwriting the old file, click the ATAS library refresh icon and add the indicator to the chart:
Now we make it even more complicated but for the last time in this article.
Fourth program
Let’s write some code, which would assess succession of bullish and bearish bars by their length and frequency of occurrence. In other words, we want to know, for example, the probability of occurrence of one more bullish bar after the first bullish bar.However, before writing the indicator, we will conduct an experiment. Let’s take the code, which randomly generates an array of 20 thousand elements, filled with zeros and ones. This way, we will get a succession of chains, the minimum length of which is 1 link. Some chains will have 2, 3, 5 and more links.
The question is: what would an average length of a chain be?
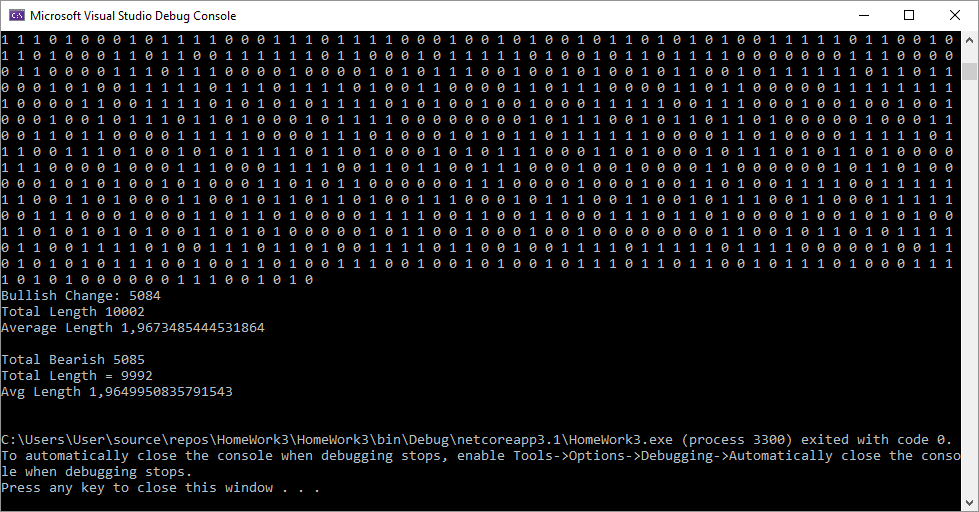
In other words, if we assume that ‘0’ is a bearish candle and ‘1’ is a bullish candle, then the average length of the bullish/bearish bar chain in the chaotic market would be 1.96.
We need this figure as the ‘random standard’.
We go to Lesson1 and write some code for the new Example1_4 class. First of all, we calculate statistics for bullish candles.
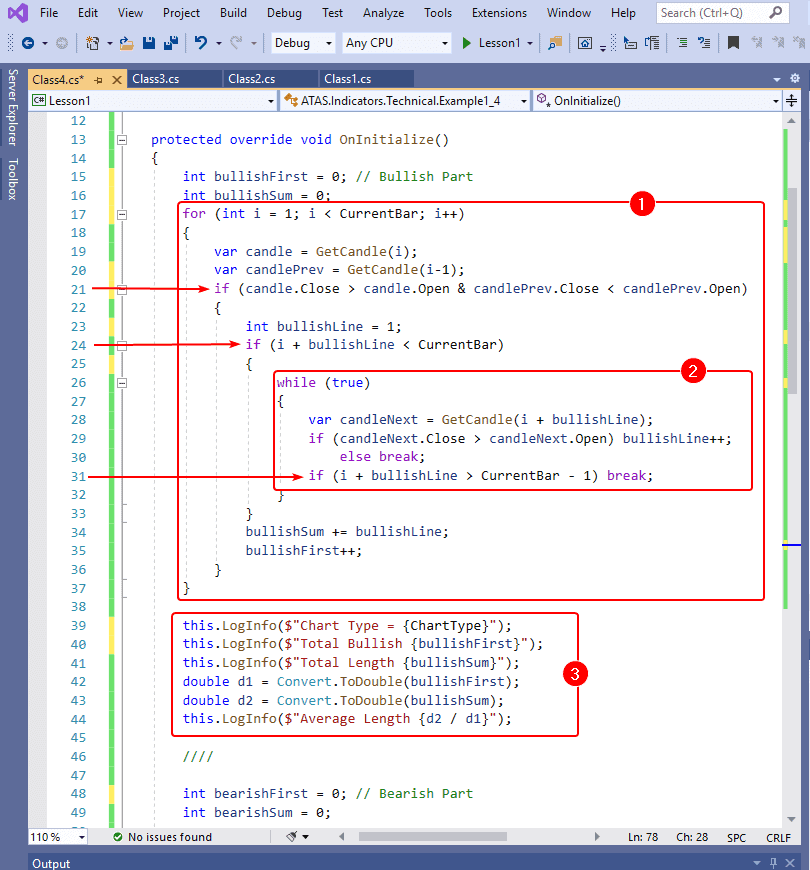
Lines 24 and 31 are required for avoiding situations when the algorithm goes beyond the candle array boundaries.
When the cycles are over, we print (3) information in the Logs window about the number of the found successions of bullish candles, their total length and calculate the average value by division.
We write a similar algorithm for calculating statistics by bearish bars. Perhaps, we will not get the most elegant and professional code, but this article was written by a non-professional for beginners, that is why the most important thing is to make it work.
We build the code, copy to the directory and add to the chart, say, Gazprom (GAZP) stock of the daily period for several weeks. We see in the Logs window that our indicator found:
- 6 bearish successions with the total number of 10 candles;
- 6 bullish successions with the total number of 11 candles.
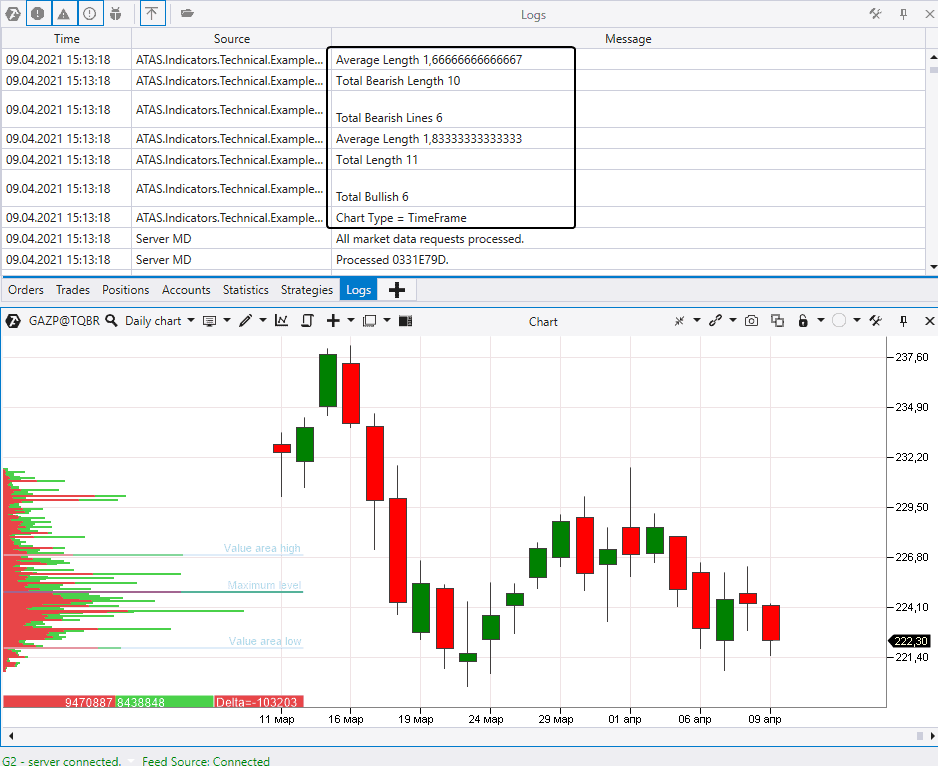
The average succession length:
- 1.66 for bearish candles,
- 1.83 for bullish candles.
If we load the data for a significantly bigger number of calendar days to the chart, we will find that:

- 1.86 for bearish candles,
- 1.93 for bullish candles.
It is very close to the ‘chaos standard’. In other words, if the GAZP stock trades were closed with a growth, the probability of a bullish tendency for tomorrow is about 50/50. And if you had thoughts about the simplest strategy like ‘I will buy tomorrow on opening if there is growth today’, ATAS and Visual Studio will help you to find a quick answer about how good this strategy is.
What if you:
- select another market/period?
- change the chart type to Delta, Range, Range XV or Reversal?
- add ‘trailing stop’?
- create an automatic strategy?
Ideas emerge one after another. It is a pure creative activity, which you can practice in the financial markets with the help of the ATAS platform and Visual Studio environment for developing your own algorithms.
You can start right now. Here’s an archive with the Lesson1 source code.
In order to open it in Visual Studio, doubleclick the Lesson1.sln file. There is a new Lesson1.dll in the Lesson1binDebugnetstandard2.0 directory. You can copy it to your C:UsersUserDocumentsATASIndicators directory right away.
Bonus
Here’s one more excellent link. Use it for downloading an archive with a set of algorithms for calculating popular technical indicators, which you can open in Visual Studio.
Doubleclick the Custom Indicator Set.sln file to open the set in Visual Studio.
Conclusions:
Ability to write programs gives you a significant advantage. If you can program on C# even on a non-professional level, you can:
- make your trading automatic;
- optimise strategy settings;
- assess the potential of your ideas.
In the event you find development of algorithms on C# for ATAS too complicated and time consuming, contact professional developers. Please, leave your comments if you liked this article. We will be grateful if you would also write what you want to read about in the next article on this subject.
Information in this article cannot be perceived as a call for investing or buying/selling of any asset on the exchange. All situations, discussed in the article, are provided with the purpose of getting acquainted with the functionality and advantages of the ATAS platform.