Read in this article:
- How financial markets work.
- The Cumulative Trades chart and Cumulative Delta indicator.
- Traps for sellers and buyers.
- Conclusions. What to do in practice?
How financial markets work
Financial market is a complex mechanism, consisting of millions of participants. There are major and minor players and there are speculators and hedgers, but all of them have the same goal – profit.One of the sources of profit, especially for market makers and major players, are losses of other market participants. That is why, the following situations occur in the market:
- False level breakouts. It is important for traders to use something as reference in the market and the levels serve as a well-known reference for trading. Stop losses of those, who have positions, and pending orders of those, who wish to enter the market, are accumulated beyond the levels. False level breakouts, after which the price moves beyond the level, take place especially for activating these orders.
- Short trends. Sometimes, the price may steadily move in a certain direction for one or two days. The trend stops when a majority of small and medium market participants believe that a new big trend started and try to join it. After that, the price might move back again to the range where it had been. In such a situation, traders, who entered in the direction of a new trend, are forced to close their positions with losses.
- Expanding triangles. The price could move one way or the other with an increasing amplitude. Thus, more new and new participants are involved in the market, while the expanding amplitude of the market movement results in activating stop losses of both sellers and buyers.
So, there are always traps in the market both for sellers and buyers.
How to avoid such traps? How to use such situations for making profit? Let’s discuss it.
The Cumulative Trades chart and Cumulative Delta indicator
In order to avoid traps, private traders need to track activity of major market participants. The trading and analytical ATAS platform functionality provides an excellent opportunity to do it.Let’s consider the Cumulative Trades chart. This chart displays in the form of clusters only those trades, which match the set filters. For example, only those clusters may be displayed, in which more than 20 contracts were traded.
This chart type displays information from the Time & Sales in a convenient form. The information, which is difficult to see in the Time & Sales, is clearly displayed in the Cumulative Trades chart.
The second instrument, which helps to understand the market better, is the Cumulative Delta indicator. It sums up the Delta for a certain period of time in order to show the dynamics of predominance of aggressive buys or sells.
If you combine this indicator with the Cumulative Trades chart, you may successfully analyse actions of major participants in the market and avoid their traps.
Let’s consider some examples to see how we could use these two instruments.
Traps for buyers
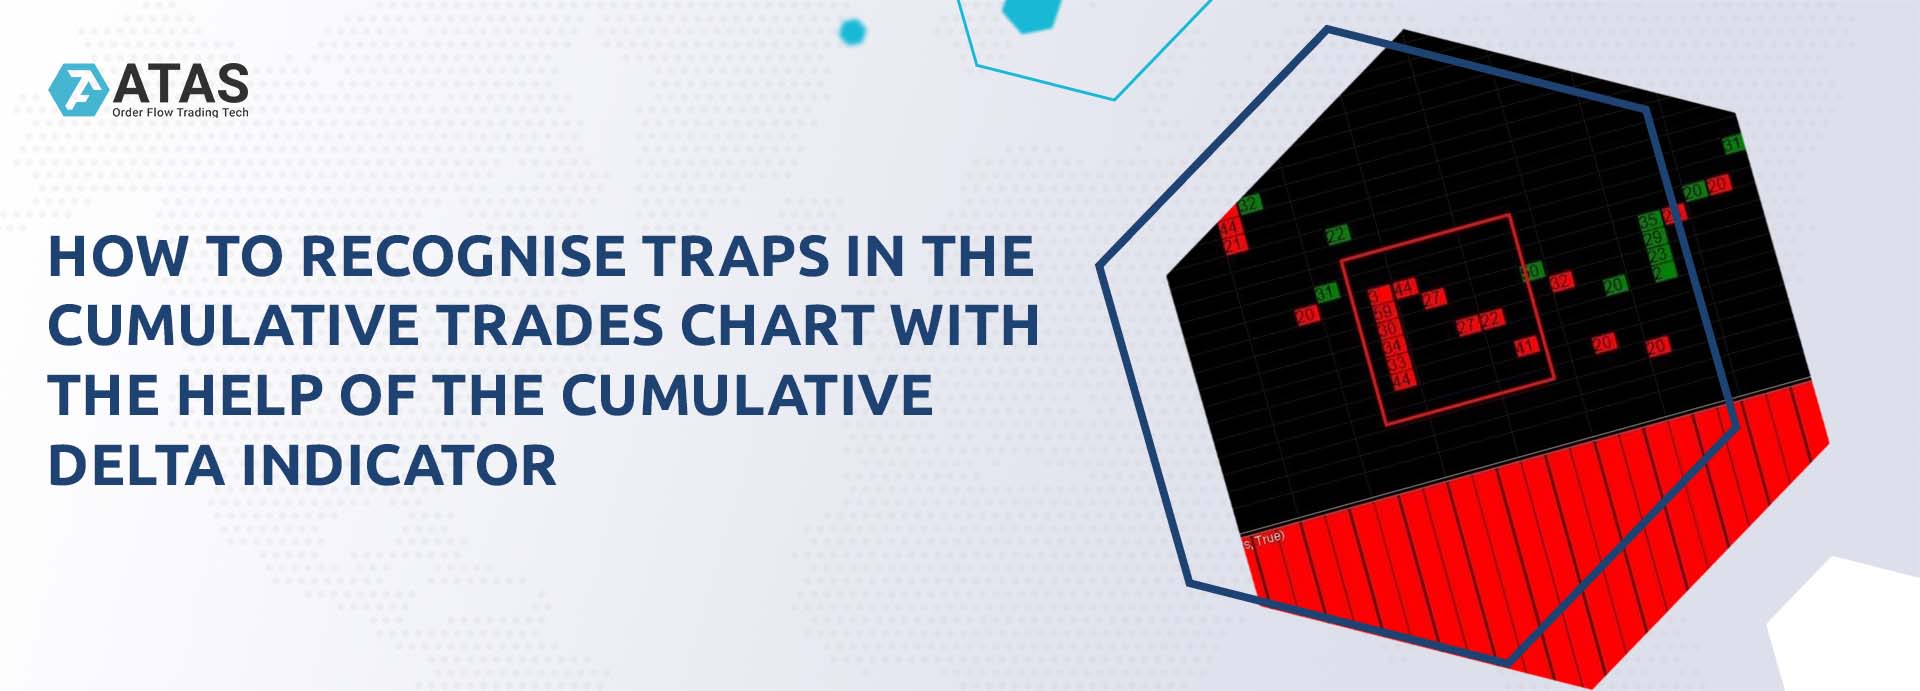
How are they set up?First, the buyers enter the market with accumulation of big prints. The limit seller should absorb all these buys and reverse the market down. The buyers make losses but hold their positions for some time.
The buyers exit from the market when the price is taken to the levels, which are unacceptable for the buyers:
- The buyers may exit by stop losses, which are often posted beyond the levels.
- The buyers may also exit from their positions with the help of market sells.
The price often reverses and starts to increase after a major buyer exits from the market.
Let’s consider such a situation using the following example:
Let’s see how the situation developed further:
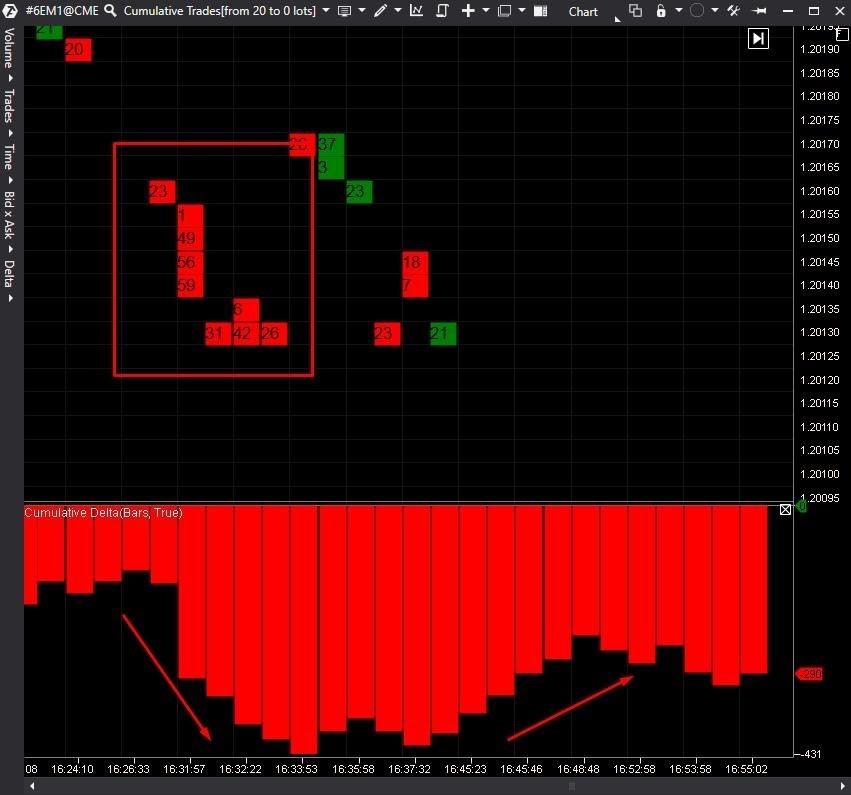
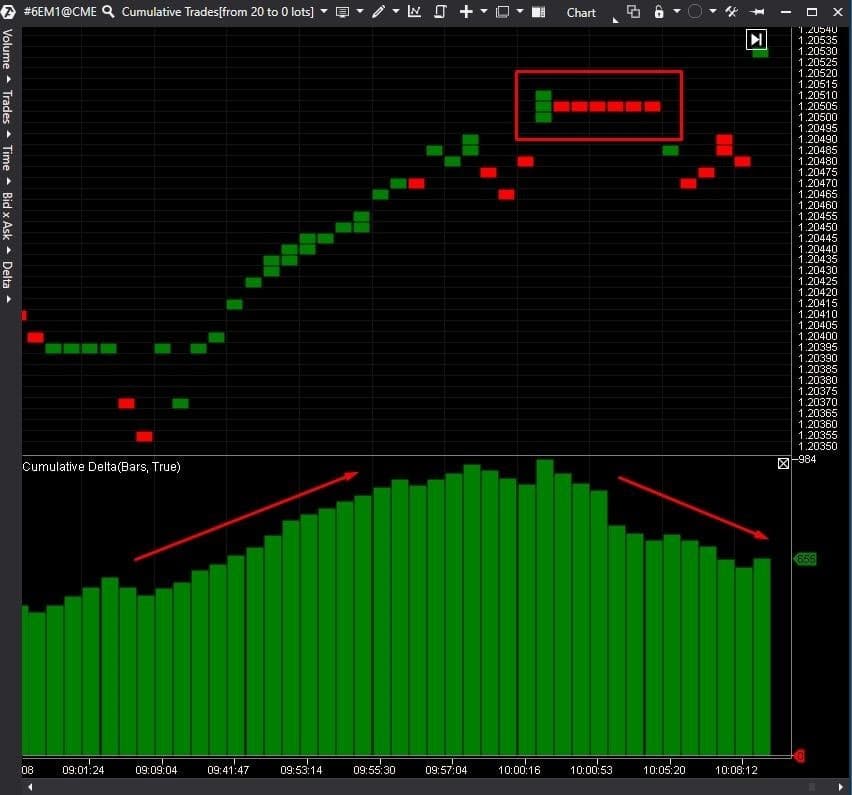
The price reversed up after that and the Cumulative Delta indicator also changed its direction.
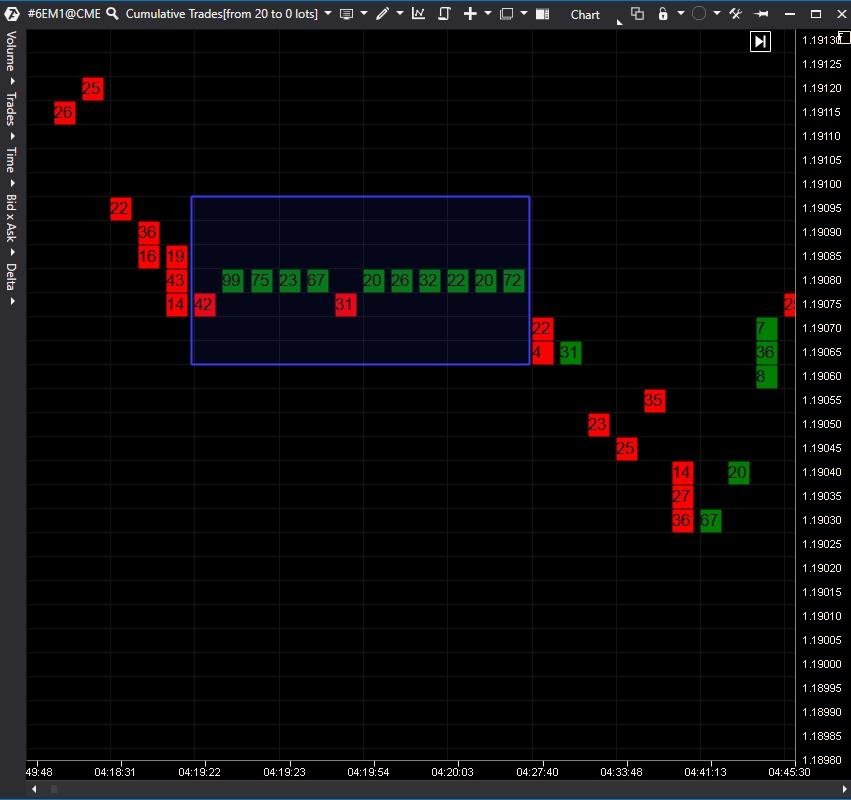
Traps for sellers
Let’s consider such a trap. Everything is mirror-like in such a trap:- emergence of big sells → the price reverses up;
- emergence of big buys → the price reverses down.
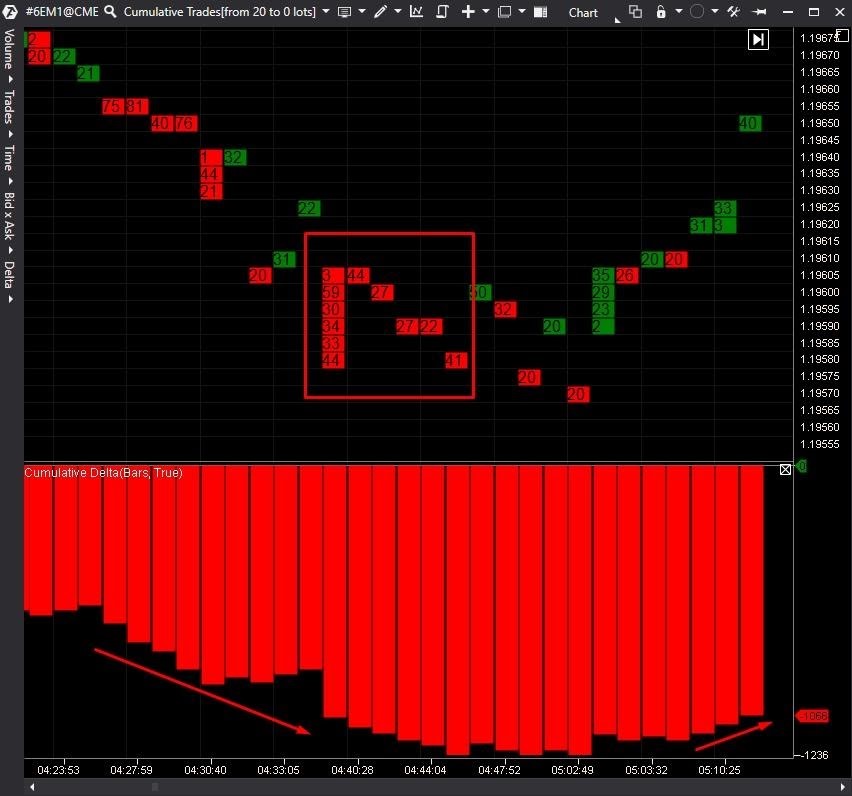
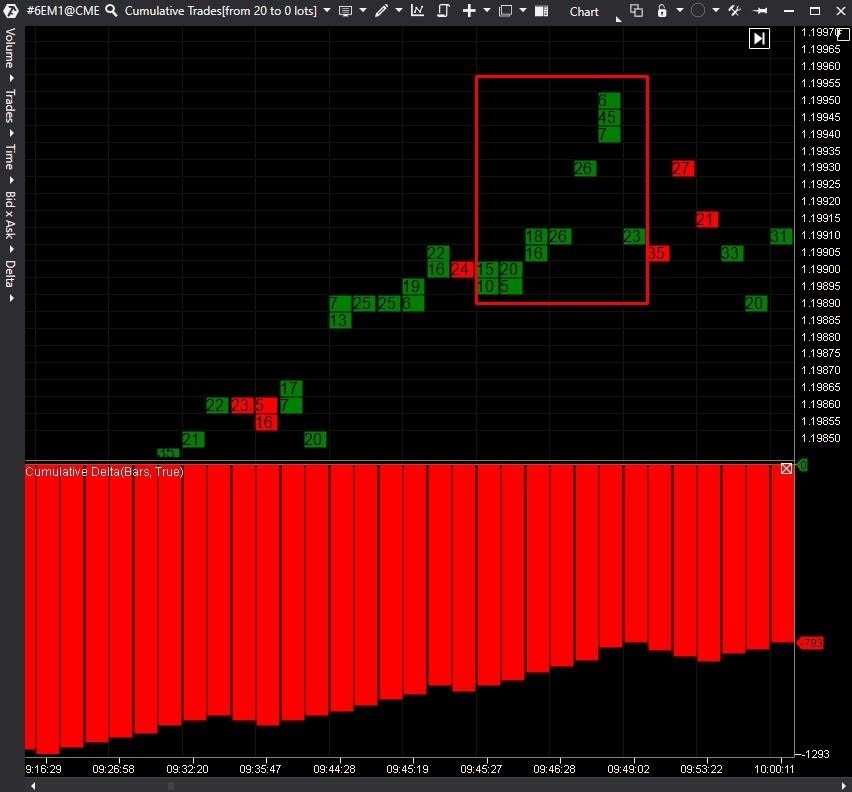
How to use this information in trading?
You can track big accumulations of prints in the Cumulative Trades chart. Then look at the price reaction. The Cumulative Delta indicator may confirm the trend reversal points. If the price moved against big prints, then, perhaps, the seller or buyer got into a trap. Most probably, they will continue to move the market in the direction of loss-making by those traders who got into a trap. That is why, this direction could have good prospects for opening trades.You can register profit and exit from the market when there are big prints in the Cumulative Trades chart again. It means that those traders, who got into a trap, exit from the market and the price may reverse.
Information in this article cannot be perceived as a call for investing or buying/selling of any asset on the exchange. All situations, discussed in the article, are provided with the purpose of getting acquainted with the functionality and advantages of the ATAS platform.