Why to use range bars?
It is useful even for experienced traders to check efficiency of different methods of trading in the Forex, futures or stock market from time to time. It would help them not only to develop professionally, learning something new about the market every time, but also to find such methods of trading, which produce the biggest outcome.
You shouldn’t be afraid of new advanced instruments of the market analysis, which are often overlooked or reluctantly used by many retail traders. Today we will speak about one of such instruments – range bars. Trading with the use of range bars exactly fits the above definition.
Trading is simple but not easy. The ability to exclude the market noise, which significantly complicates identification of profitable trading signals in the flow of the market information, is the cornerstone of success in trading in the financial markets. Experienced traders understand it very well. For example, an unexpected news broadcast and geopolitical events may create a doubt and mess in the financial markets, which results in uncertainty of the market participants. And, if you are uncertain, you are subject to financial losses.
Range bars will help you to see the true picture of what really happens with the price of the traded financial instrument. Independent of what indicators of the technical and volume analysis of the ATAS platform you use, range bars will become a perfect supplement to the trading methods you use, since they react to the market changes much faster.
In this article:
- What is a range bar?
- Range bars of the ATAS platform.Trading with the use of range bars.
- Have you considered it in this light?
What is a range bar?
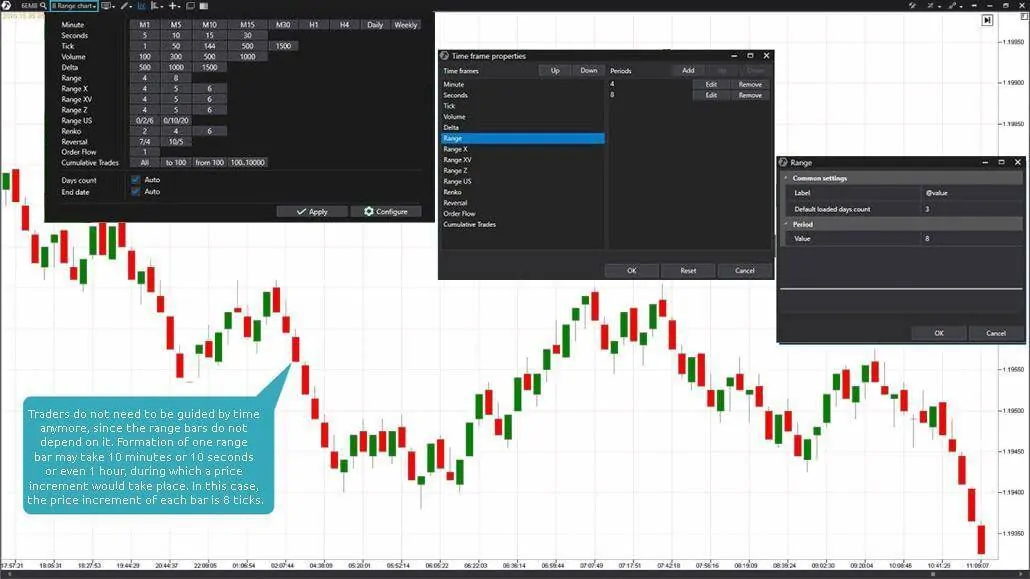
In fact, each range bar is characterized with the same price increment and its closure takes place at the range’s high or low, independent of where it was opened. Consequently, if you want to see the futures price movement by 8 ticks up or down in the chart, set the value of 8 in the period of a range chart, as it is shown in the picture below.
Setting the range chart of a EUR futures contract (ticker: 6E) with the range of 8. A new bar is formed in the chart as the price moves by 8 ticks in one or the other direction.
Formation of the current range bar would close and formation of a new bar would start every time when the futures price would pass 8 ticks in one or the other direction. Moreover, the time has no influence whatsoever on opening or closing the range bars.
Range bars of the atas platform.
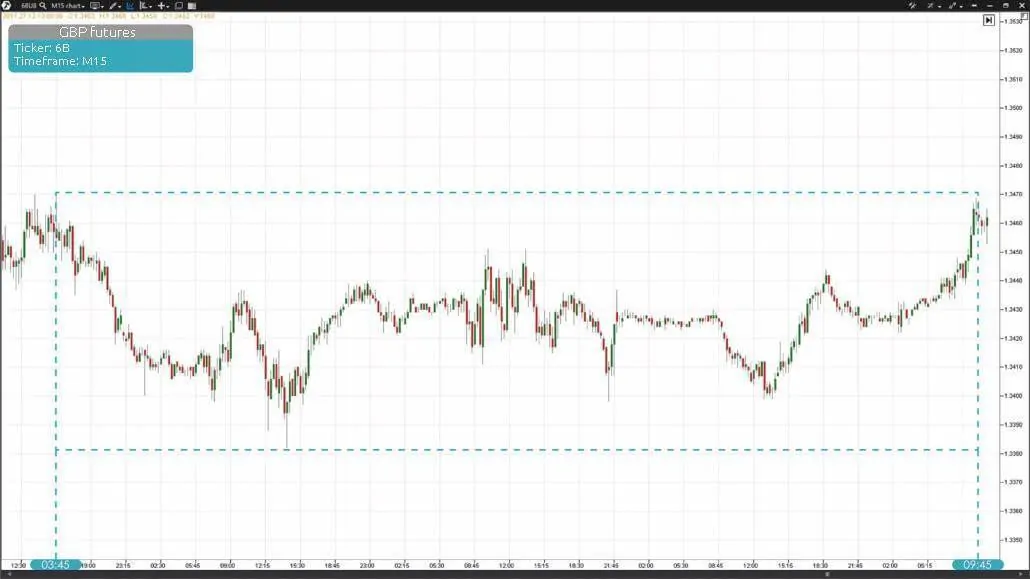
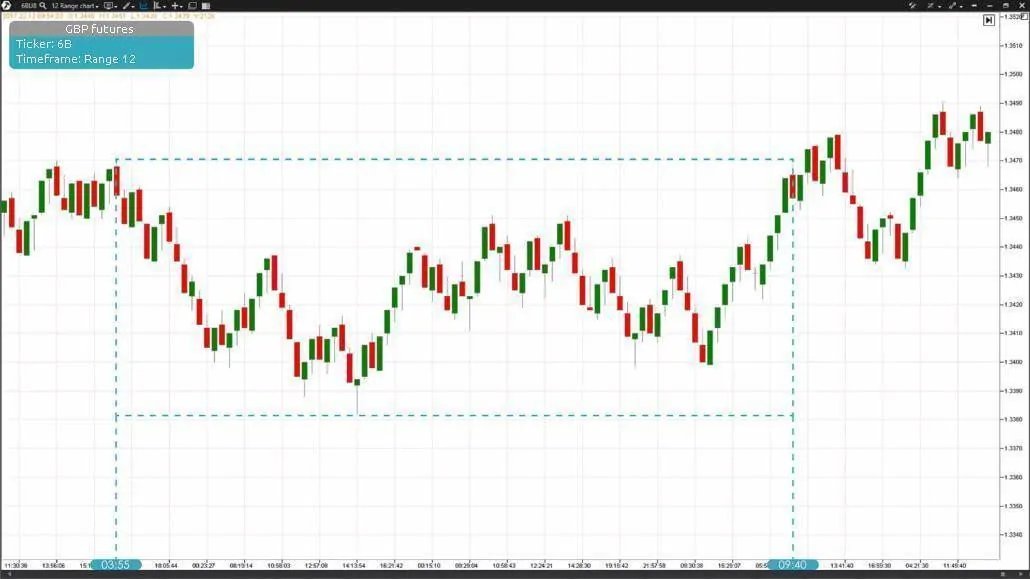
The trading and analytical ATAS platform allows users to build not only time charts! Now, making just a couple of mouse clicks, you can also build range charts, consequently, excluding, with their help, such a market noise as saw-tooth movements with long shadows of the bars and market consolidation, which prevents us from seeing the real state of the market:
Chart No. 1. 15-minute GBP futures (ticker: 6B) timeframe for the period from December 20 until December 27, 2017.
Chart No. 2. A GBP futures (ticker: 6B) range chart with the range of 12 ticks for the period from December 20 until December 27, 2017.
You might think: “Wait a second! All traders use time charts.” You are right, but this is where the problem lies. Those traders that use time charts only will not have that advantage, which you have. Sometimes, replacement of the technical indicators with range bars can significantly increase efficiency of your trading.
Trading with the use of range bars.
The biggest advantage you can get when using the range bars lies in the fact that the market information, which they reflect, is relevant to the price change and, consequently, to efficiency of your trading. You lag behind in decision making by definition when you use signals of technical indicators in time charts.
Since, if a trading setup is formed with the use of a technical indicator, you learn about it only after some time. This setup could have already reached its goal or worked out its potential by that time. Professional traders place a high value on range bars because they reflect actual price parameters and do not depend on time intervals as the time bars do.
For example, an 8-tick range bar shows a trader an exact trading range. The further price movement of the price up or down behind the limits of this bar would not be accidental, but would be a real growth or fall of the price. How does it help a trader? Accuracy of trading signals for long and short trades with the use of range bars is astonishing and the trading becomes controllable and unemotional.
Have you considered it in this light?
For example, if you trade currency futures and wish to make 8 ticks in each trade, wouldn’t it be reasonable to build a chart of range bars of 8 ticks each? Sounds logical. Such an 8-tick range bar would not take the time factor into account, instead, it would reflect the price movement completely, which is exactly what we need.
As soon as the price of a currency futures passes a distance of more than 8 ticks, a new range bar starts to form. Besides, a number of minutes or seconds, which were taken for its formation, will not be taken into account. Those traders who got used to time charts shouldn’t worry. The range charts look exactly like time charts. Nevertheless, it could well be that the range charts would provide you with such a visual representation of the price action, which you were looking for since long ago.
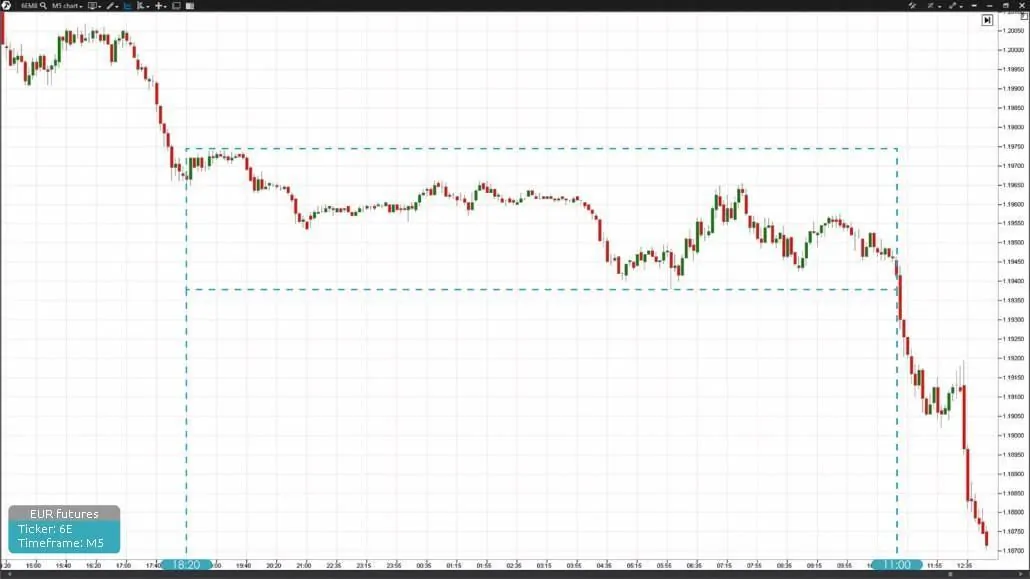
Chart No. 3. 5-minute EUR futures (ticker: 6E) timeframe for the period from May 14 until May 15, 2018.
Chart No. 3 is a 5-minute EUR futures chart of the ATAS platform. Looks familiar, but we think that you will like the range chart of the same trading instrument better. Now we propose you to compare Chart No. 3 with Chart No. 4.
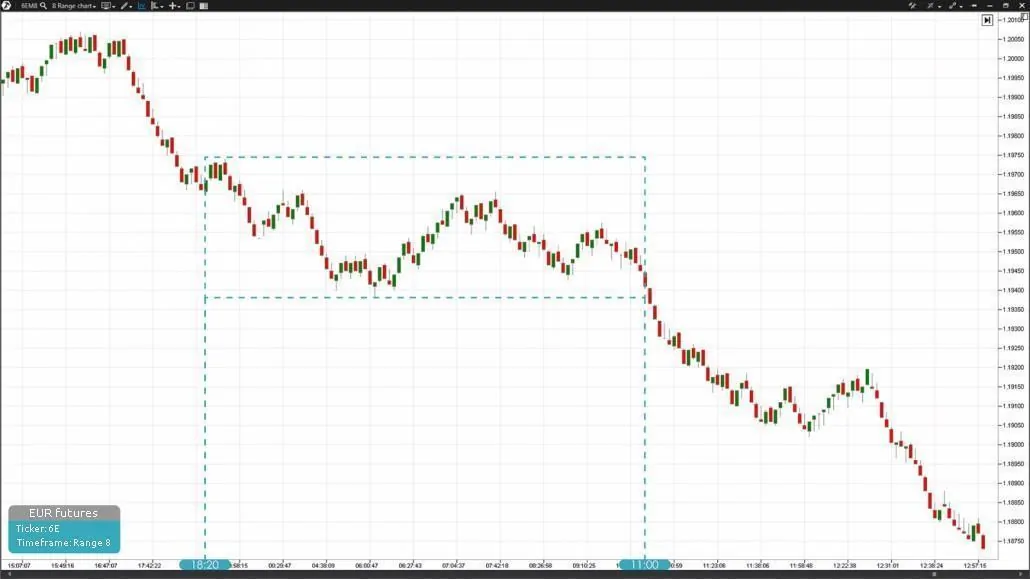
Chart No. 4. A EUR futures (ticker: 6E) range chart with the range of 8 ticks for the period from May 14 until May 15, 2018.
Note how extended the flat in the 5-minute Chart No. 3 is and how unpredictable the price action looks in it. And now look at the smooth price movement in the range Chart No. 4. Due to the elimination of the market noise under the flat conditions, the actual EUR futures price movement is clearly seen.
Thus, a range chart can provide a trader with an advantage in those periods, when the market passes the stage of consolidation or is in the state of a very narrow flat. As you might have noticed, it is much easier to track trends and, consequently, to trade on range charts of the ATAS platform.

