Read in this article:
- What Speed of Tape shows and what its calculation formula is.
- How to set up the indicator.
- Indicator signals.
- Chart examples.
What Speed of Tape shows
This indicator shows (which is clear from its name) the speed of the Smart Tape and highlights those bars in the chart, which had changes in the Tape by the specified criteria. The following formula is used for the calculation:Speed = number / time.
The indicator calculates the speed by:
- number of trades;
- volume of trades;
- delta;
- number of buys;
- number of sells.
Time is always calculated in seconds. It means that a trader may use the Speed of Tape to see the highlighted bars, in which the number of trades / delta / volume exceeded the specified value for a certain number of seconds.
Smart Tape (Time & Sales) is a powerful instrument but it is difficult to work with it since the data change very fast. The main advantage of the Speed of Tape indicator is that it ‘tracks’ the tape in real time so that a trader doesn’t miss important periods of high activity even if he goes away from the terminal.
How to add the Speed of Tape indicator
You can add the indicator from the upper menu or using the right mouse button. The autofilter mode is on by default. A trader doesn’t have to think about settings in this mode, the system automatically highlights the bars by a number of trades. The autofilter values are different for each instrument.Experienced traders may switch this mode off and look for specific bars in the chart by the specified settings.
Also, several Speed of Tape indicators could be added to the chart.
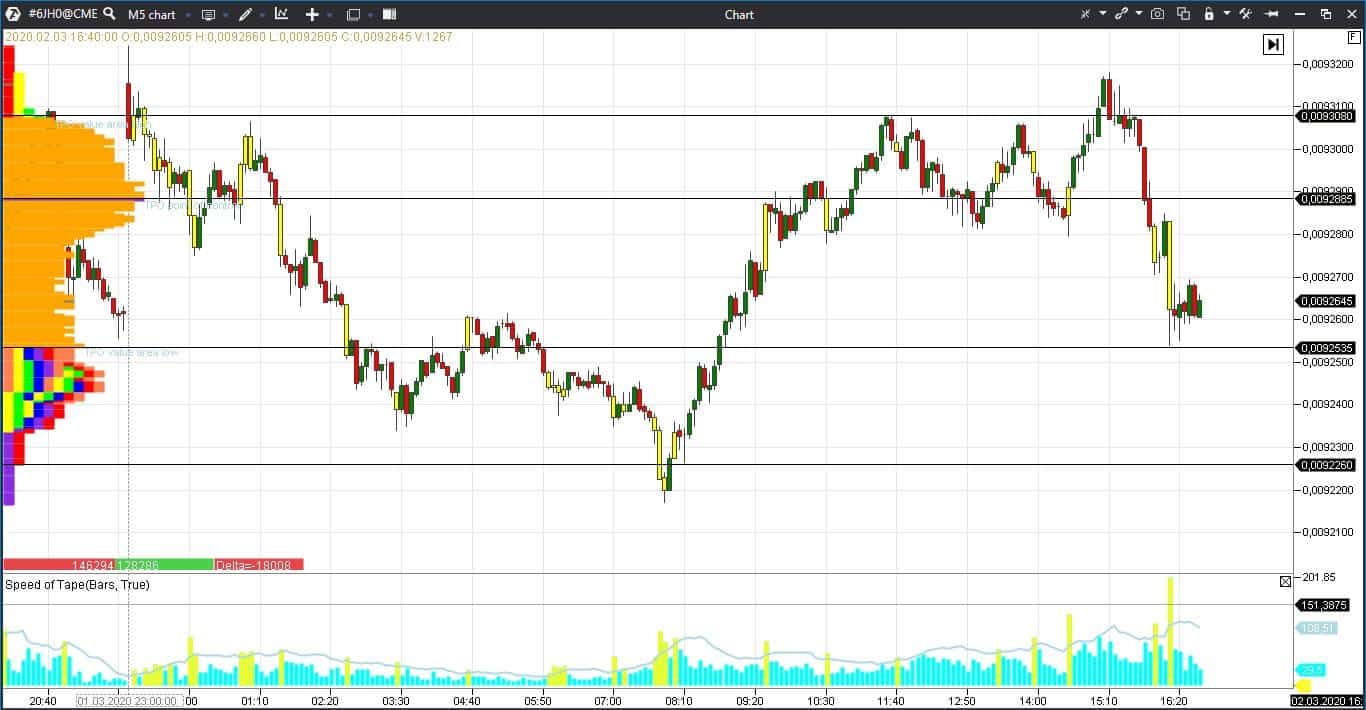
It is more efficient to use the indicator in the tick charts or in small time-frames, because the indicator highlights the whole bar. By default, the bars in the chart and bar chart are highlighted yellow. However, a trader may select another colour. The higher the bar chart, the higher the speed of the tape. A moving average is added to the bar chart for convenience. See Picture 1.
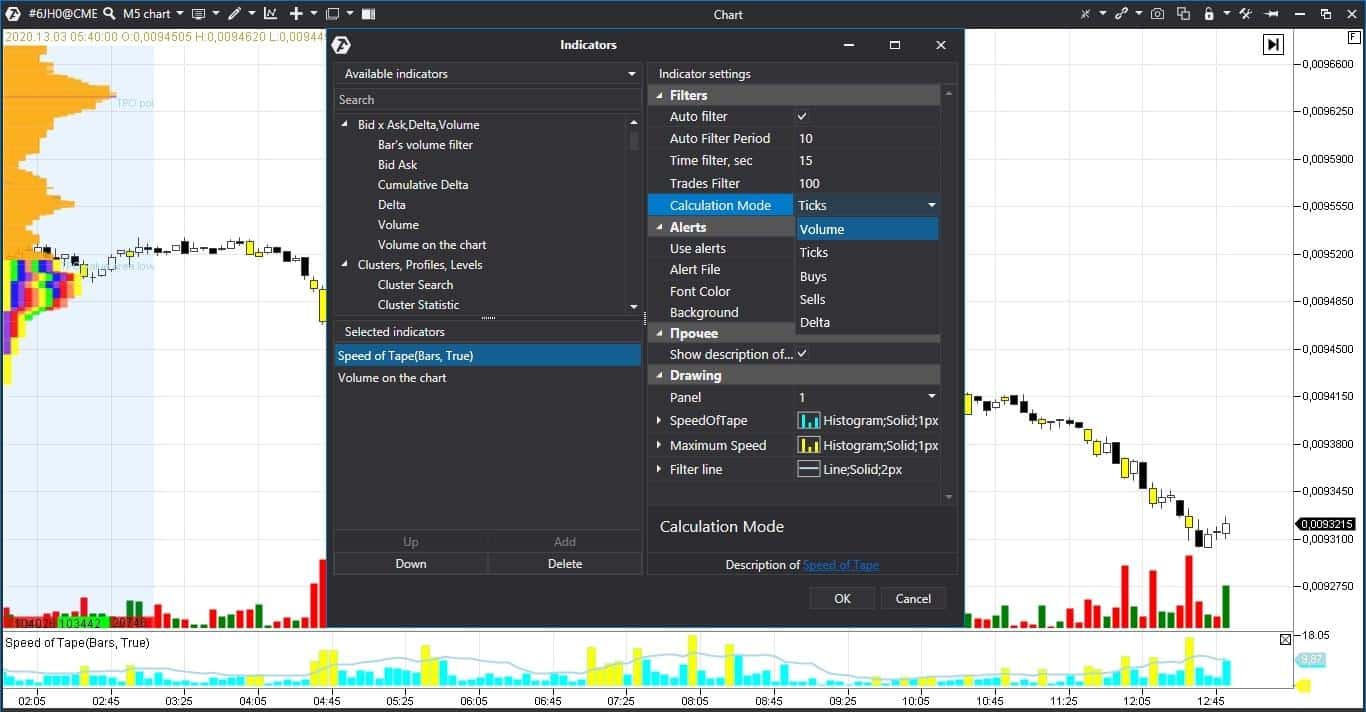
A trader could set up the period of data averaging in the autofilter mode (in the picture below). See Picture 2.
Interpretation of the Speed of Tape
The speed of tape itself doesn’t give a trader a lot of useful information. Advantage emerges when a trader pays attention to the tape speed near significant levels and takes into account changes of the volume. In other words, Speed of Tape is not an automatic indicator, it requires understanding of and application in the market context.For example:
- if the price approaches the resistance level, the volume increases and the speed of tape by Asks also increases and a breakout of this level becomes very probable;
- if the tape speed goes down, the price cannot get over the level, because the activity fell down.
The speed of trades in the tape reduces to an average level during consolidation. Trading possibilities emerge when the tape accelerates along with the volume increase. That is why it is important to know the average speed and average volume in the instrument.
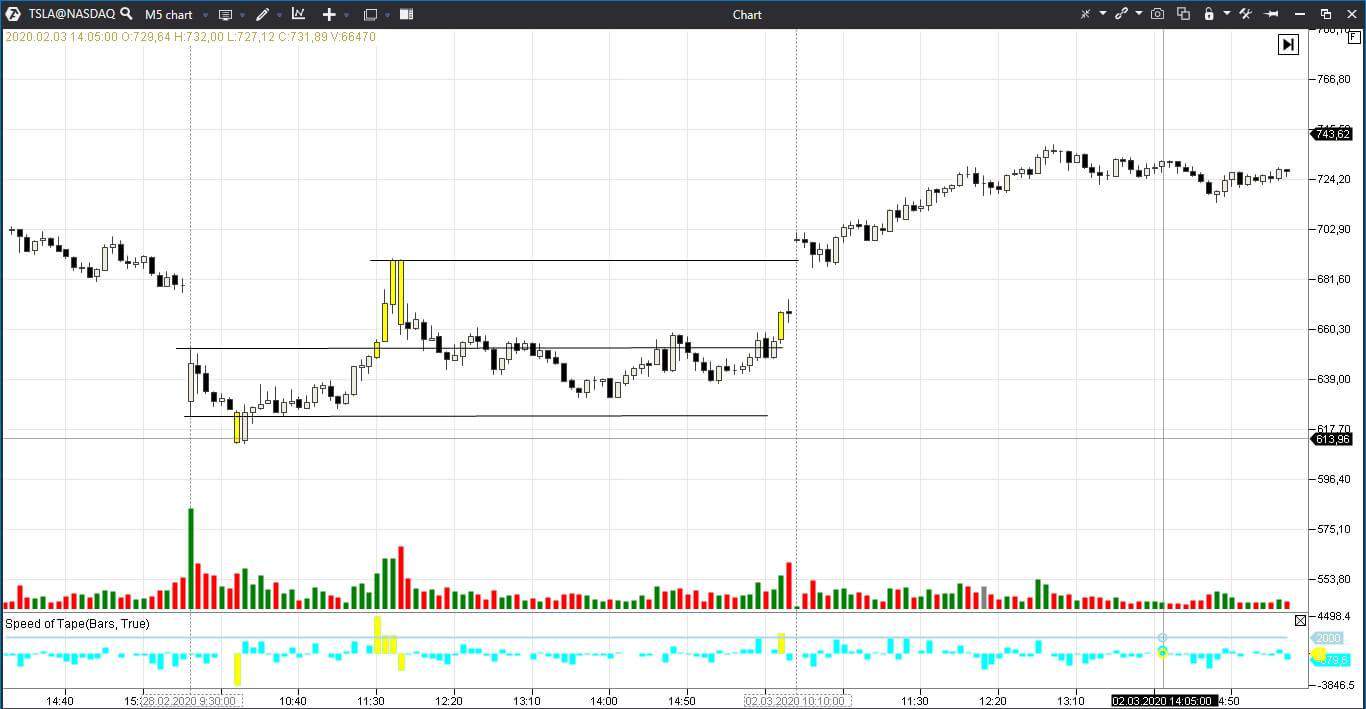
Let’s consider an example in the 5-minute Tesla stock chart (in the picture below). We added two Speed of Tape indicators to the chart:
- The first one highlights those bars red, which speed of sells exceeded 3,000 shares per 15 seconds.
- The second one highlights those bars green, which speed of buys exceeded 3,000 shares per 15 seconds.
Moreover, we also added the Volume indicator. See Picture 3.
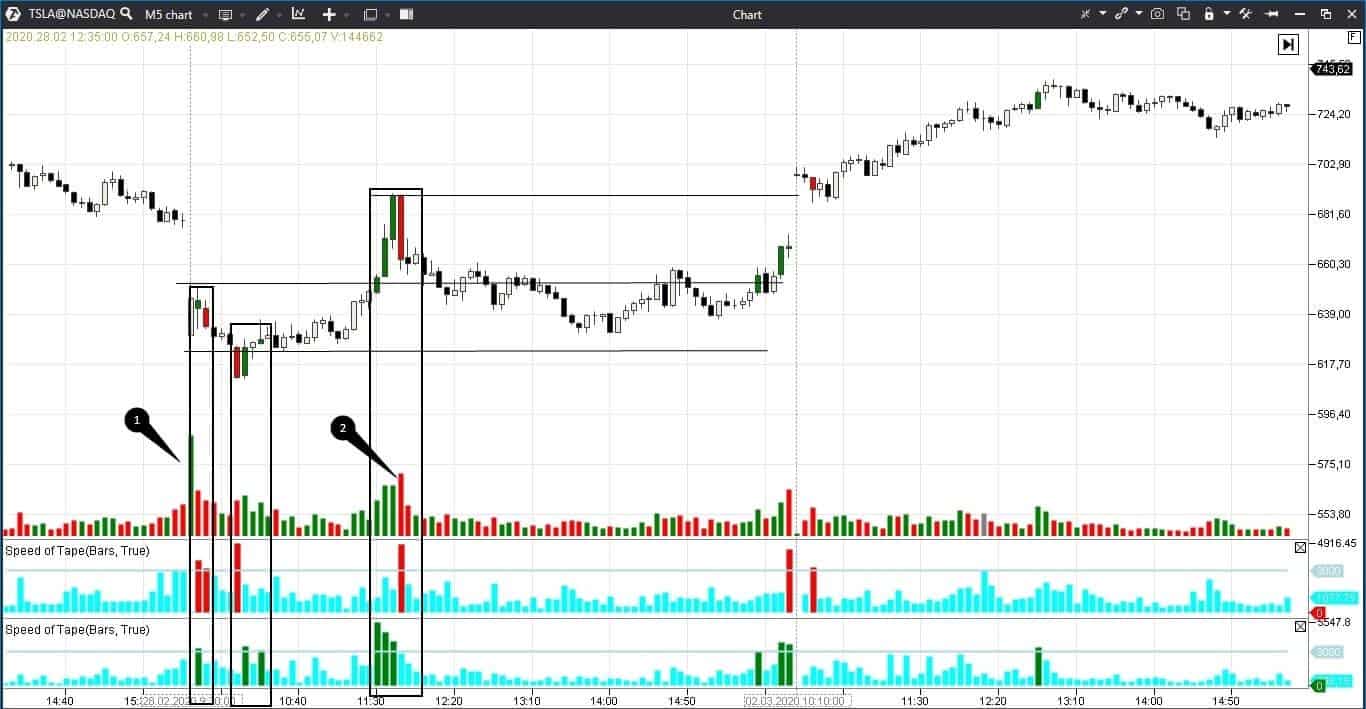
Initially, both buys and sells accelerate in the black rectangle near the first bar and then only sells accelerate, after which the price falls down.
Buyers and sellers fight, the tape accelerates but the volume doesn’t grow in the next black square immediately under the level. The price returns to the range and consolidates.
The speed of buys grows and volumes also grow in rectangle 3 before the breakout of the resistance level. The upward breakout at a high volume with the speed increase is an excellent sign for opening long positions. However, the speed of buys should not sharply fall after the breakout. In our example, the speed of buys falls, while the speed of sells sharply grows. It could be a registration of profit or new short positions. In any case, it is a warning for traders that the price could return to the range.
This is exactly what happens, but the price doesn’t reach the lower boundary of the range even once. And, at the end of the day, it consolidates again above the level on the growing volume and with a high speed of buys. The tape slowing down together with different-type Bid and Ask orders sends a warning signal about indecisiveness of traders.
Specific features of the Smart Tape analysis
Apart from acceleration of buys or sells, the speed of tape could be also analyzed by delta or volume.Let’s check the 5-minute Tesla stock chart again. This time we would analyze acceleration of the delta changing by more than 2,000 shares in 15 seconds.
Note that the indicator layout changed, because the delta values could be both positive and negative.
- If the bar chart is positive, it means that there are, at least, 2,000 market buy orders more than market sell orders.
If the bar chart is negative, it means that there are, at least, 2,000 market sell orders more than market buy orders. See Picture 4.
The second yellow bar falls exactly on the level and the bar chart is positive. It means that buyers were active there. They managed to break the level on high volumes but the speed slowed down. As regards the fourth yellow bar, sellers enter or buyers register profit in this section. The rally is over.
A positive yellow bar appears again over the significant level at the end of the trading session. Buyers managed to consolidate – it is a good sign for those who bought stocks.
Summary
We showed just some examples of how the Speed of Tape indicator helps a trader to understand the market situation. There could be even more applications – as a variant, the Speed of Tape indicator could be used in those chart types, which are not based on time.When analyzing the Speed of Tape, it is important to take into account that each instrument has a different speed of tape. Moreover, activity falls during lunch hours and before the week-ends. However, there are other nuances. Watch this video about the indicator settings on our YouTube channel.
We hope you will be able to justly appraise this useful instrument after downloading the ATAS platform. We wish you only an acceleration of your successes in the exchange trading.
Information in this article cannot be perceived as a call for investing or buying/selling of any asset on the exchange. All situations, discussed in the article, are provided with the purpose of getting acquainted with the functionality and advantages of the ATAS platform.