The subject of our today’s article is the CCI indicator. This article is another one in the series of publications about technical indicators. What is interesting about the CCI indicator?
Read in this article:
- what CCI is, definition and calculation formula;
- how to trade using the CCI indicator – examples and testing using historical data;
- Woodies CCI strategy;
- CCI indicator and cluster analysis.
What the CCI indicator is. Description
The Commodity Channel Index (CCI) indicator was developed by Donald Lambert in the 1980s. The CCI indicator shows deviation of the typical price from its average value.

Despite the fact that there is the word ‘commodity’ in the indicator’s name, CCI could be used not only for the oil, gold or agricultural markets. The CCI indicator calculation formula is based on the data about the typical price, which means that CCI could be similarly set in the charts of currencies, stocks and other financial platforms.
What is the typical price?
TP (Typical Price) = (HIGH + LOW + CLOSE) / 3.
Donald Lambert offers to use namely the typical price in the calculations, since it excludes the data about the OPEN price. The aim is to reduce delays in the indicator behaviour.
You can find the CCI calculation formula in the knowledge base.
Technically, CCI is an oscillator, based on the price impulse. It is used for:
- identifying when the investment instrument reaches the overbought or oversold state;
- assessing the direction and strength of the price trend.
Interpretation of signals by the CCI indicator
- If CCI has a positive value, it means that the current typical price is above the historical average. If CCI has a negative value – the price is below the average.
- High CCI values (for example, 100 and above) point to the fact that the typical price is much higher than the historical average value and a strong tendency towards increase is probable. And vice versa. The value below 100 points to the fact that the price is significantly lower than the historical average value and, most probably, there is a strong bearish tendency in the market.
- Transition from negative or close to the zero values to +100 could be applied as a sign of the beginning of a bullish trend.
- Transition from positive or close to the zero values to -100 could signalize about the beginning of a bearish trend.
- Theoretically, the CCI indicator may increase (and decrease) to infinity. However, in practice, the values above 200 or 300 (below -200 and -300) are considered to be extreme and testify to the current market overbought (oversold) state.
In other words, the Commodity Channel Index analysis envisages that the majority of CCI values get into the range from +100% to -100%. Values outside the +100% to -100% range should testify to the impulse strength.
Let’s speak about how to trade by the CCI indicator.
Application of the CCI indicator
In his book The Encyclopedia of the Technical Market Indicators (what else a beginner trader must read), Robert Colby studied efficiency of trading by the CCI indicator on the Dow Jones Index (what stock indices are).
We will cite the results of these studies.
Trading with the Commodity Channel Index. Strategy No. 1
The rules of trading by strategy No. 1 are very simple:
- We buy when CCI moves above 100%.
- We close the long when CCI moves below 100%.
- We sell when CCI moves below -100%.
- We close the short position when CCI moves above -100%.
The study used the historical data for 72 years – from 1928 until 2000.
The study used:
- the prices of closing the Dow Jones industrial index on the day period;
- the CCI indicator period – 14.
The strategy gives a stable growth of the capital, especially during the first half of the studied range. The results of the CCI application deteriorated at the end of the study when algorithmic trading became a trend.
If you had a start-up capital in the amount of USD 100 and traded by this strategy, you could have received USD 10,816.84 of net profit. However, this result could be achieved only if:
- the profit is not withdrawn but is reinvested;
- maximally possible positions are opened;
- brokerage and exchange commissions are not taken into account;
- taxes are not taken into account.
On the average, trades were executed once in 12.49 days.
Trading with the Commodity Channel Index. Strategy No. 2
Original Lambert’s CCI indicator envisages availability of a wide area from +100% to -100%. Trading is not carried out in strategy No. 1 if the index is within this area. Such a tactics:
- restricts application of the CCI index during a significant period of time;
- doesn’t allow ‘catching the market’ at early stages of the trend emergence.
The said shortcomings could be neutralized if we do away with the area from +100% to -100% and use the facts of intersection of the CCI indicator with the Zero Line as a position entry. Robert Colby believes that this approach is more efficient.
In other words, we:
- close sells and open buys when CCI (2) moves above the Zero Line (0);
- close buys and open sells when CCI (2) moves below the Zero Line (0).
Naturally, trading is more active in strategy No. 1. Sure thing. It envisages the permanent position availability. And note that the period for CCI is only 2. In other words, you will have to ‘reverse’ quite often.
What are the results?
And again, the study was carried out on the basis of day values of the industrial Dow Jones Index for the period from 1928 until 2000. Despite the simple rules and purely mechanical signals of following the trend, which exclude any subjectivity, the obtained result is excellent.
On the average, trades were executed once in 3.61 days.
If you started with USD 100, you may achieve the profit of USD 1,238,397.90 without taking into consideration commissions and taxes. Of course, this is in case you reinvest the capital and open by maximum.
Woodies CCI trading strategy
One of the most famous trading strategies, which apply CCI, is Woodies CCI. Its developer is Ken Woodie.

His strategy of trading by the CCI indicator became so popular that the analysis and trading programs specify an individual indicator – Woodies CCI.
Let’s consider Woodies CCI from the ATAS platform though the example of the Brent oil futures market. The data is taken from the Moscow Exchange with the 5-minute period.
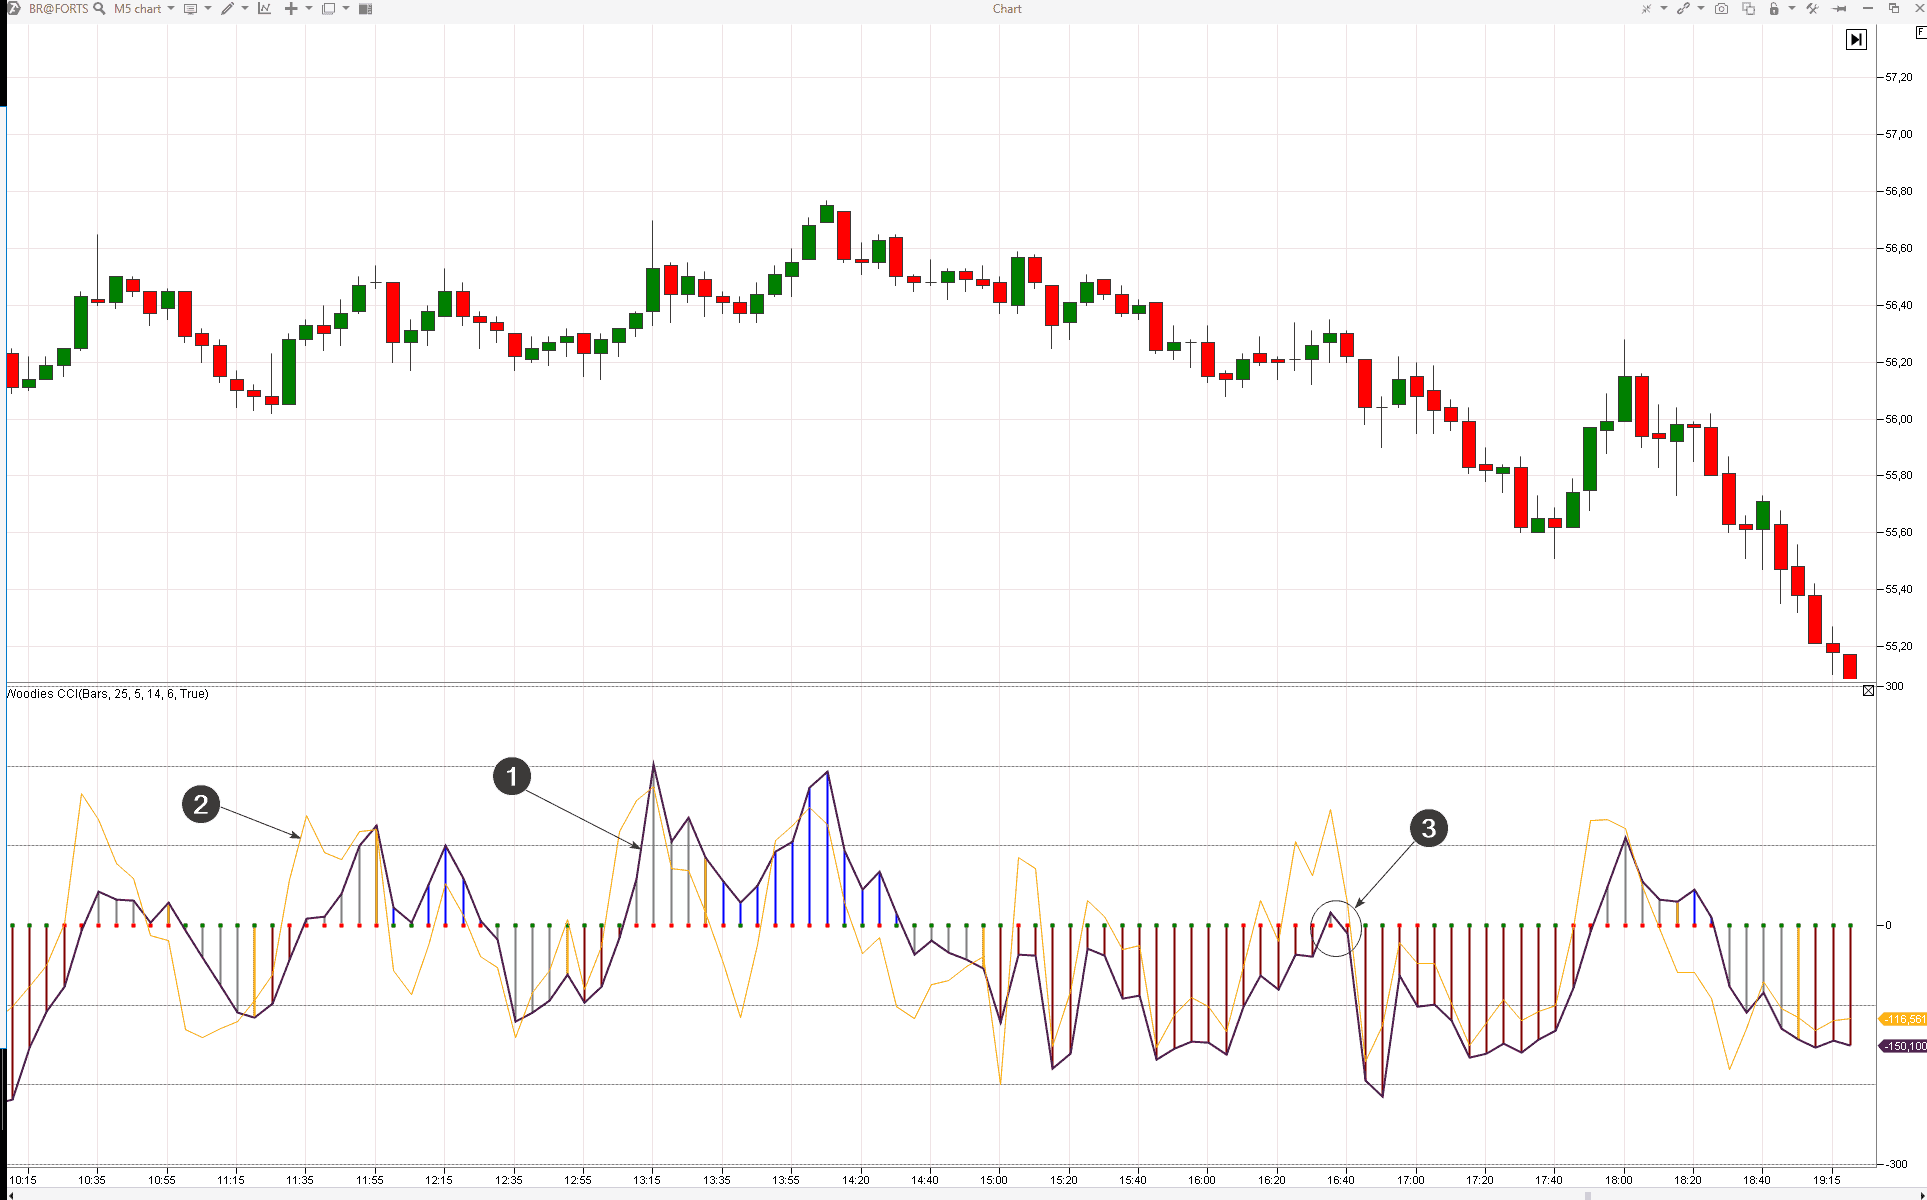
Woodies CCI indicator is a combination of two indicators:
- slow CCI index with the period of 14. It is shown in the chart as a bold black line (1). When it is above the zero line for longer than 5 bars, blue bars appear. They signalize that a bullish trend has been established in the market. When the bars are red (CCI is below zero after 5 bars), the trend is bearish. Grey bars mean that the trend is not identified. Golden bars warn that a trend is about to be established;
- fast CCI index or Turbo CCI with the period of 6 (the yellow line, which is marked with arrow 2). The main aim of Turbo CCI is to help finding patterns and also submission of signals to an entry/exit.
Ken Woodie, the strategy developer, recommends to remove the price data from the chart and use the indicator patterns only. There is logic in it, since candles may distract your attention and candlestick patterns may go in conflict with the CCI signals. Trading by Woodies CCI becomes systematic if you are not distracted by price patterns.
The main idea of trading with Woodies CCI is to follow the intraday trend on the time-frames from 3 m to 15 m. If the bars are blue, we look for buy patterns. If the bars are red, we focus our attention at the search for sells.
One of the basic patterns is the Zero-Line Reject (ZLR). It is marked with arrow 3 in the chart. Following this pattern, a trader should sell when:
- the bearish trend has been established (red bars);
- the CCI indicator reverses down near the zero line.
The opposite is true for entering buys.
Followers of the Woodie CCI strategy specify a multitude of patterns for entry/exit into/out of the positions: Hook, Vegas, Famir and Ghost patterns, breakout of the CCI trend line and others.
We will not go deeper into the Woodies CCI subject since it would require several articles for description. But we couldn’t have missed an opportunity to mention it.
The CCI indicator and cluster analysis
Let’s test the CCI indicator application ‘in a combination’ with the cluster chart.
Example. Let’s take the bitcoin 3-minute chart. Let’s assume that a trader conducted analysis on a longer time-frame (we will not describe his considerations). In the result of analysis of a wide picture, the trader arrived at ‘bearish’ conclusions and expediency to open short positions.
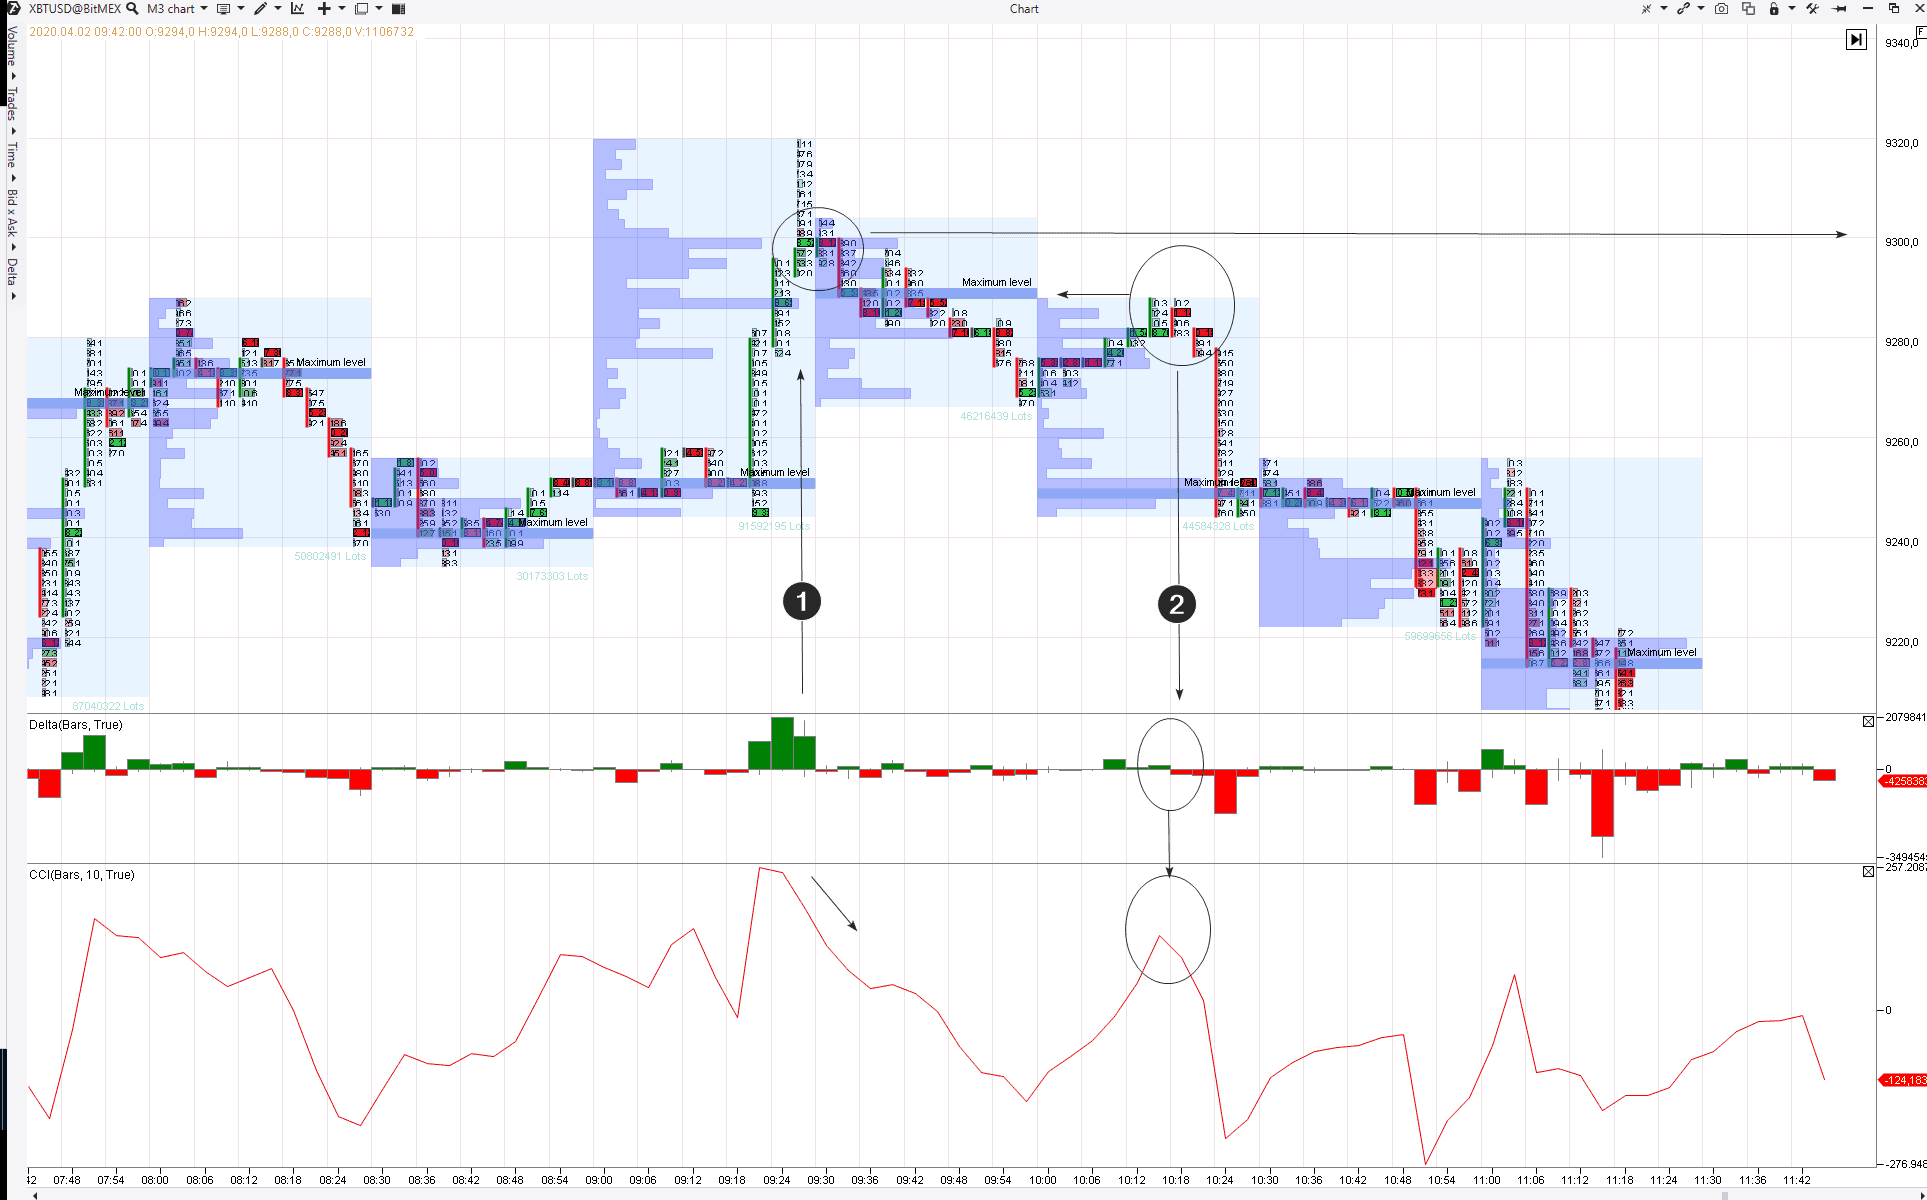
The Profiles indicator and Delta have been added to the clusters.
Point 1 shows the sign of a false breakout of the ‘round level’ of 9,300. The price ‘has jumped’ over it but failed to consolidate there and quickly came back. The goal of this behaviour is to activate stop losses of the sellers and lure the buyers into a trap. A red cluster appears on the next bar. It is a change by delta and a signal for selling, if we judge the market by the character of movement near the round level and by delta. And what about CCI?
It already showed a down reversal on the previous bar. On the one hand, we may decide that CCI gave an earlier signal. However, we believe that this is a premature signal, which is not in line with a trustworthy story about a false breakout. On the other hand, if a trader needs to have more confidence for opening a short position, confirmation from the CCI indicator could be used for it.
Point 2 shows testing of the previous profile maximum volume level. The delta changed from green to red and the CCI indicator formed the sell signal during the test. Everything coincided here and this set of the seller’s strength signs provided a trader with good chances for selling with a short stop.
Summary
Use the instruments, which:
- fit you best of all;
- have credibility.
The CCI indicator is not a magic wand, which guarantees 100% accuracy of signals (no indicator is capable of it).
However, if you feel that CCI is capable of improving your efficiency in some way, download ATAS and test CCI and Woodies CCI both separately and in a combination with:
- various chart types (tick, range and others);
- footprint;
- such indicators as Delta, Big Trades, Cluster Search and others.
Try different valiants of CCI application on demo and analyze the obtained results. Put real money at risk only if you are completely sure that your strategy would work (Top 5 volume trading strategies).
We wish you successful setups!