Unfortunately, many trading platforms do not contain volume indicators at all. Some of them transfer volumes but only tick ones or without dividing them into buys and sells, which limits traders in receiving important information.
The ATAS platform allows analysing both buyer and seller behaviour separately not only in the horizontal projection (in other words, by levels and profiles), but also in the vertical one providing a possibility to apply filters.
Read in the article, how filtration is done in the Delta indicator, which shows difference between buys and sells, and what it is required for:
What the Delta is and how the indicator works.
How to add it to the chart and set up.
How to use filters – 3 chart examples.
FAQ.
What the Delta is and how it is calculated
Every trade on the exchange has:
1 buyer and 1 seller;
1 limit order and 1 market order, which are matched.
Besides, if:
Buy limit + Market Sell are matched → the Delta is negative (red color);
Sell limit + Market Buy are matched → the Delta is positive (green color).
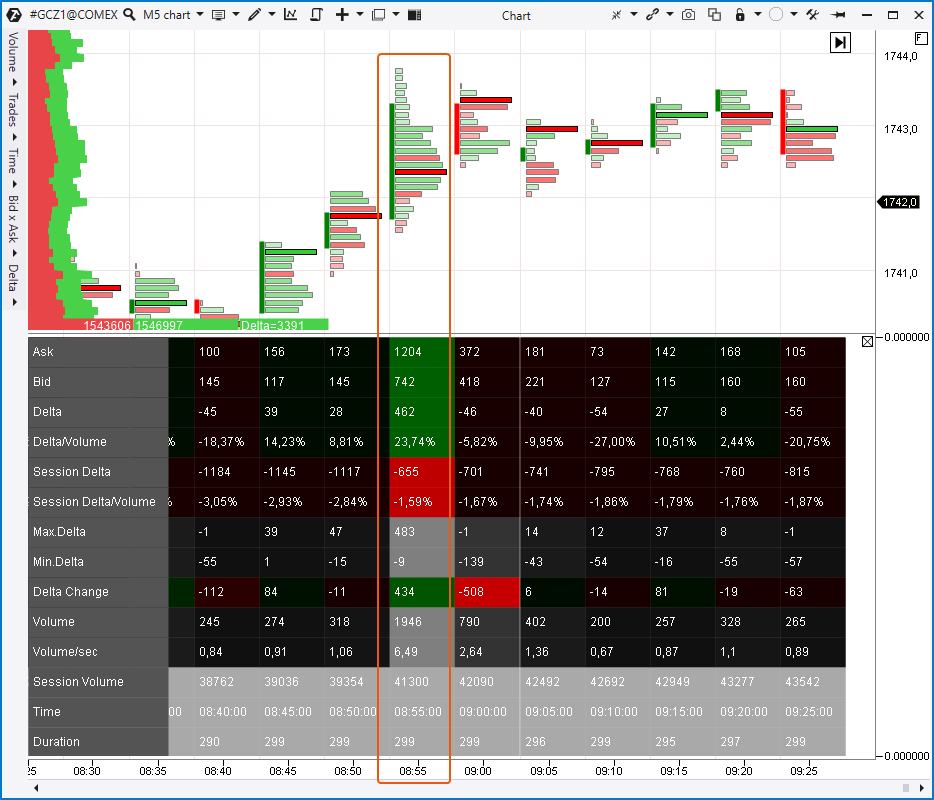
A chart with the Cluster Statistic indicator will help you to understand it better. It is a 5-minute gold futures chart from the COMEX exchange.
Look at the candle at 08:55.
The ‘Ask’ row shows 1204, which is the volume of trades where Market Buy and Limit Sell were matched.
The ‘Bid’ row shows 742, which is the volume of trades where Market Sell and Limit Buy were matched.
The ‘Delta’ row shows the difference between Ask and Bid: 1204 – 742 = 462.
And ‘Volume’ shows the total of Ask and Bid: 1204 + 742 = 1946.
If you still have questions with respect to the exchange order mechanics, we recommend that you read more detailed explanations in the following articles:
How to add the Delta indicator to the chart and set it up?
You can do it in 7 steps:
Usually, you do not need to set up the Delta indicator. It calculates its values using the Bid and Ask volume data which are contained in every candle.
However, note the ‘Filters’ section in the settings window. These are filters, and they can ‘cut down’ indicator values to zero under certain circumstances.
By default, all filters are off. You can set up 1 out of 3, 2 out of 3 or turn on all three filters simultaneously.
Let’s see how the filters operate:
Filter 1. Bar direction
Any – Filter is off.
Bullish – Delta values are shown only for bullish candles, and bearish candles have Delta = 0.
Bearish – Delta values are shown only for bearish candles, and bullish candles have Delta = 0.
Filter 2. Delta type
Any – Filter is off.
Positive – Delta values are shown only if they are >0.
Negative – Delta values are shown only if they are <0.
Filter 3. Filter by volume
‘0’ or less than ‘0’ – Filter is off.
Value is bigger than ‘0’ – For example, you specify 100. The indicator will show values above +100 and below -100. Everything, which is in the -100 to +100 range, will be equated as zero.
You can read about other Delta indicator settings on the indicator page in our Knowledge Base.
Let’s speak about practical application of filters.
How to use filters?
There are no magic filter settings in real life. The Delta indicator filters are not the Grail, which will show you entry / exit points with 100% accuracy.
That is why it is preferable to do the following, before you start experimenting with the Delta indicator filters:
conduct a general market review, cover a wide picture and understand where the price is and in what direction a trend moves;
formulate questions, answers to which you try to get with the help of filters. The below examples will help you to do it.
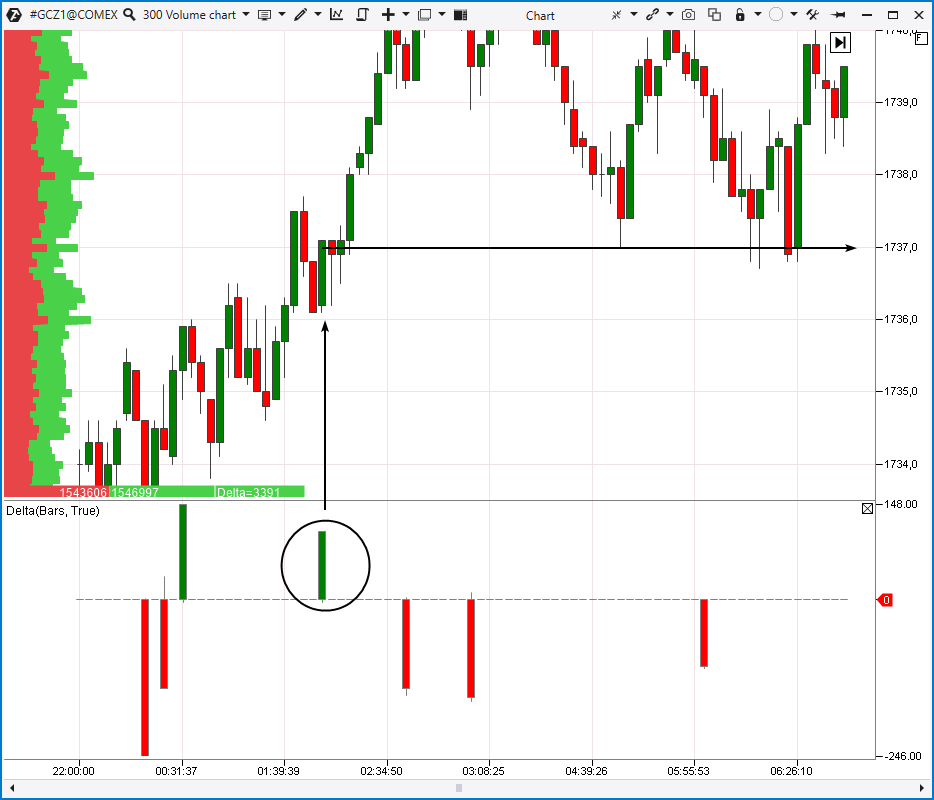
This example shows a situation when a filter shows only significant Delta splashes. We selected the Volume = 300 frame, since the gold futures market changes significantly depending on the time of day, and the Volume chart type allows to ‘narrow’ flats and ‘expand’ more active periods of the day.
A splash of buys is marked with a black circle on the indicator. In fact, it pointed to the buyers’ effort when breaking the 1737 level. It may be risky to enter into a long position ‘on a breakout’ by a signal, since it is fraught with buying peaks. However, the idea to ‘test a breakout’ seems more conservative, which doesn’t mean less profitable. Look at how 1737.0 clearly works as the support level. The Delta indicator filter helped us to identify it.
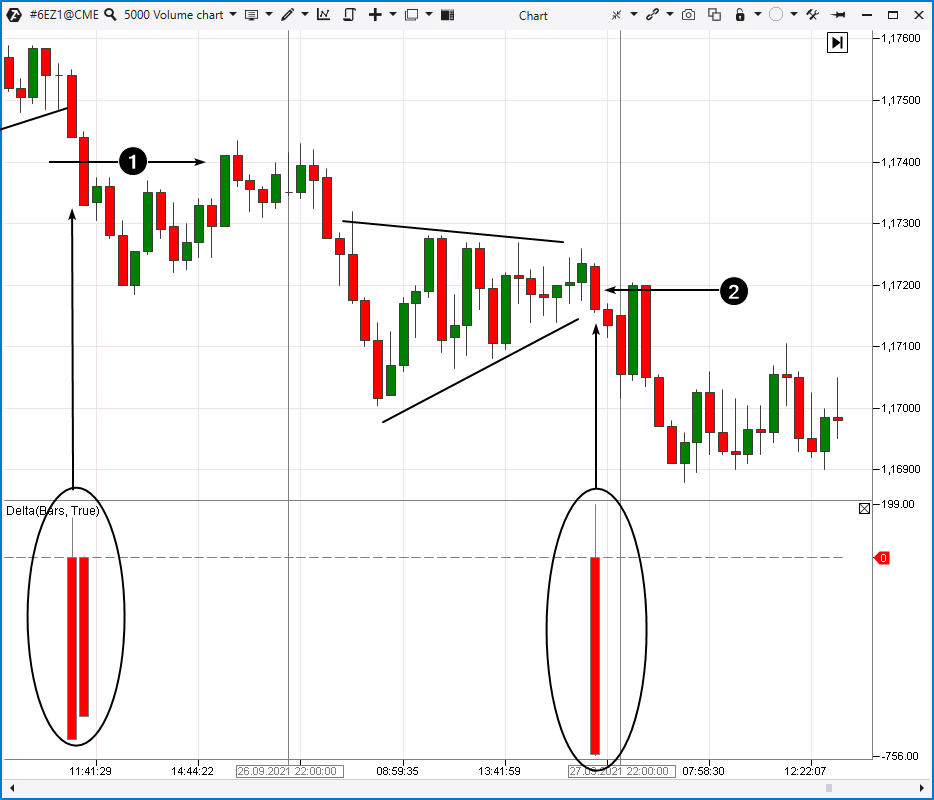
Example 2.
Instrument: EUR futures (6E).
Period: Volume = 5000.
The Delta filter settings:
Bars Direction = Bearish.
Delta Type = Negative.
Filter = 500.
This example shows the 6E market situation as of the end of September 2021. USD was strong at that time, since investors were concerned about the risk of the US Government shutdown due to reaching the state’s debt ceiling. Statements of the Federal Reserve System officials about cutting down the support of the economy under conditions of the pandemic were also topical.
Fundamentally justified dollar strengthening could be used for trading in a bearish trend with the use of the Delta indicator. We set it up in such a way so that to see activity of market sells. The first case shows an effort on a bearish breakout of the 1,17400 level. One could enter immediately at the breakout or wait for a rollback in order to test the level marked with number 1.
Consolidation and further effort of sellers, marked with a circle, were formed in the middle of the chart. It pointed to a bearish exit from the consolidation triangle. Once again, one could ‘jump into a train going south’ immediately or act more conservatively – wait for the level test marked with number 2.
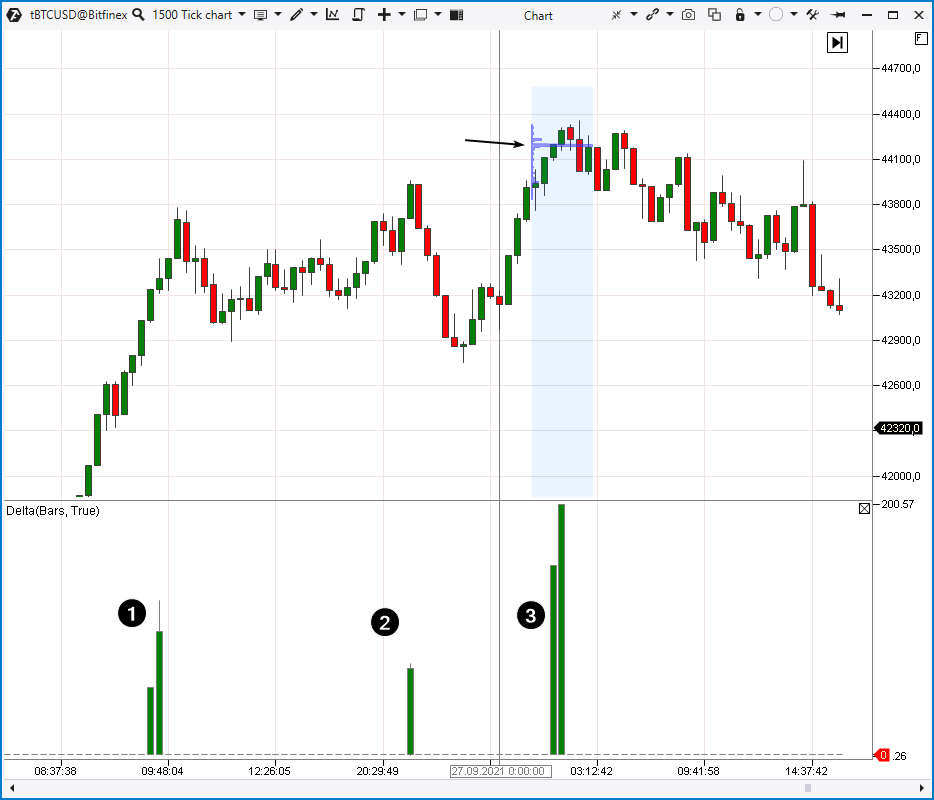
Example 3.
Instrument: BTC/USD (data from the Bitfinex).
Period: Tick = 1500.
The Delta filter settings:
Bars Direction = Bullish.
Delta Type = Positive.
Filter = 50.
The indicator shows three cases of buyers’ activity. In fact, they are all signals of weakness to a different extent.
But how can the buys be signals of weakness?
The matter is, as we have already said, that there is a buyer and seller in every trade, but they place different types of orders. If there is a boom of Market Buys, placed by novice traders (in other words, ‘a crowd’), on the exchange, some major player can use this liquidity in order to execute his Limit Sell orders of big sizes. Usually, this is what happens, and you will be able to see it, if you study significant reversals in any market using advanced ATAS platform indicators for volume analysis.
This is what happens with BTC/USD. Numbers 1, 2 and 3 show that:
the first Delta splash sharply suppressed the price growth rate;
the second one pointed to a false breakout near the market peak;
the third one pointed to the market peak. The profile helps to identify that the major player was active near the 44200 level (marked with an arrow) more accurately. It can be assumed that he actively met a rush of Market Orders, motivated by passing the 44k psychological level, with Limit Sells.
It was a justified idea to sell from 44200. Sellers attacked the 41k level the very next day. The Delta indicator filters helped us to focus on the major player activity.
FAQ
What markets can the Delta indicator and its filters be used in?
It can be used practically in all markets to which you can connect through the ATAS terminal. We want to note that the Delta data from the stock market has specific features, so you should take it into account.
What indicators can the Delta indicator and its filters be combined with?
You can combine it practically with all indicators including RSI. We recommend that you confirm Delta signals with the help of more advanced indicators, such as, for example, Volume Profile, Speed of Tape and Open Interest.
Why do MetaTrader and TradingView have no Delta indicator?
We do not know for sure and you’d better ask developers of these terminals. We will venture to assume that the reason is that volume transfer is connected with difficulties in receiving data from exchanges and processing them. Another reason is that users of these resources do not pay much attention to this indicator, preferring simple (but inefficient) solutions. We recommend that you download the ATAS terminal, so that you can use the maximum of valuable information, which you can receive from exchange charts, in a convenient form.
If you still have questions, contact the ATAS support service.
Conclusions
Delta is an important indicator for assessing trade volumes. Also, a possibility to apply filters allows you to focus on those splashes of activity, which have a bigger value for you.
Use volume analysis, since it helps you to work with the original reasons for price movements.
Information in this article cannot be perceived as a call for investing or buying/selling of any asset on the exchange. All situations, discussed in the article, are provided with the purpose of getting acquainted with the functionality and advantages of the ATAS platform.