Read in this article:
- about the indicator developer;
- what the MACD indicator shows;
- MACD signals;
- description and application of the MACD indicator.
About the indicator developer
Gerald Appel was born in a poor family. His father was a taxi driver and spent all the money on races. Gerald was the senior son out of 4 children in the family. He started to get interested in the markets in the middle of the 1960s. At the same time, Gerald started to trade and write articles on the exchange issues.
He founded an analytical newsletter in 1973, which is maintained nowadays by his son. At the same time Gerald established the Signalert Corporation investment fund and managed it until he retired in 2012. This fund is also managed by his son nowadays.
Appel wrote 17 books, 2 of which were called ‘investment books of the year’. However, he is best known as the developer of the MACD indicator, which today is included into practically all trading platforms.
MACD stands for Moving Average Convergence/Divergence.
How the MACD indicator works?
According to Appel, the main characteristics of the indicator are the following:
- it belongs to the group of indicators that follow the trend and it also shows reversals well;
- it consists of three exponential moving averages. When calculating exponential moving averages, the biggest weight is put on the latest data, that is why they are more sensible than standard moving averages;
- the standard settings are 9, 12 and 26 periods;
- the short moving average reacts to an asset price change faster than the long moving average. Together, they confirm each other’s signals.
Description and Application of the MACD indicator
The indicator consists of two lines: the MACD line and signal line.
The MACD line value, as a rule, is 12 to 26 periods. Ideally, it should be 2-3 times longer than the signal line. To build MACD, it is necessary to subtract the long moving average from the short one. The signal line is calculated not from the price but from the MACD line. Its value, as a rule, is 9 periods.
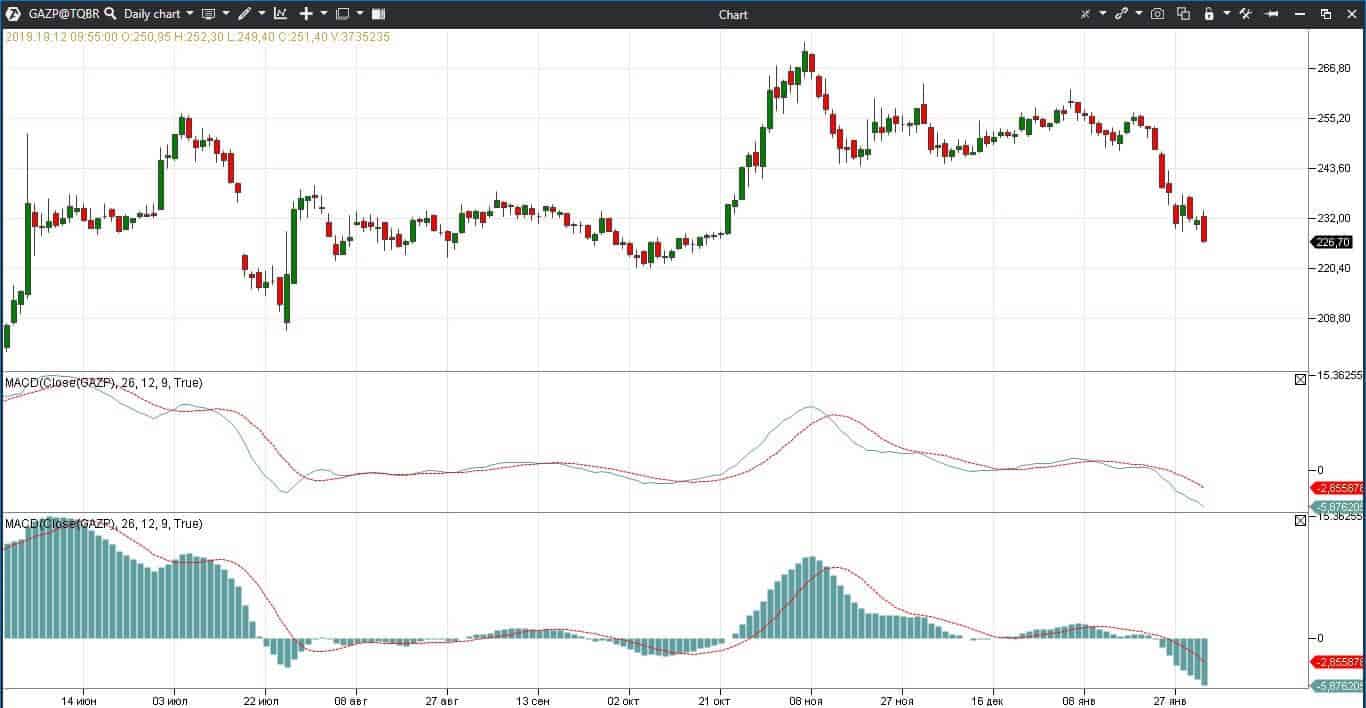
Layout of the indicator could be set in the form of a bar chart and dashed line or in the form of a solid and dashed line. The zero level shows a balance in the market.
Example of various variants of display of the indicator in the daily Gazprom stock futures (GAZP) chart.
MACD indicator setting
Several MACD indicators with different settings could be combined in the chart. Besides, Appel recommends to use a faster variant for buying and slower variant for selling.
Depending on a trading situation, Gerald Appel offers to change settings as follows:
| Fast market | 6 | 19 | 6 |
| Average market | 13 | 26 | 9 |
| Slow market | 19 | 39 | 9 |
How to use MACD signals?
There are several standard signals, which are used in trading:
- crossover of the bar chart and signal line;
- MACD divergence between the prices and indicator;
- MACD line slope;
- a discrepancy signal between the bar chart and signal line;
- a new high.
Let’s consider them in detail.
‘Crossover of the bar chart and signal line’ signal. The crossover warns traders about a change of waves in the market. The indicator lines cross faster than standard moving averages in the price chart.
Crossovers shouldn’t be used mechanically, since false crossovers also occur. Traders need to take into account longer time-frames and filter out signals with the help of other instruments.
Let’s check an example in the daily EUR futures (6E) chart. Our MACD indicator looks like a bar chart. We added two standard moving averages to the price chart – a red one with the period of 12 and blue one with the period of 26. The indicator signals emerge faster than the crossover of averages in the chart even if we reduce the period of standard moving averages.
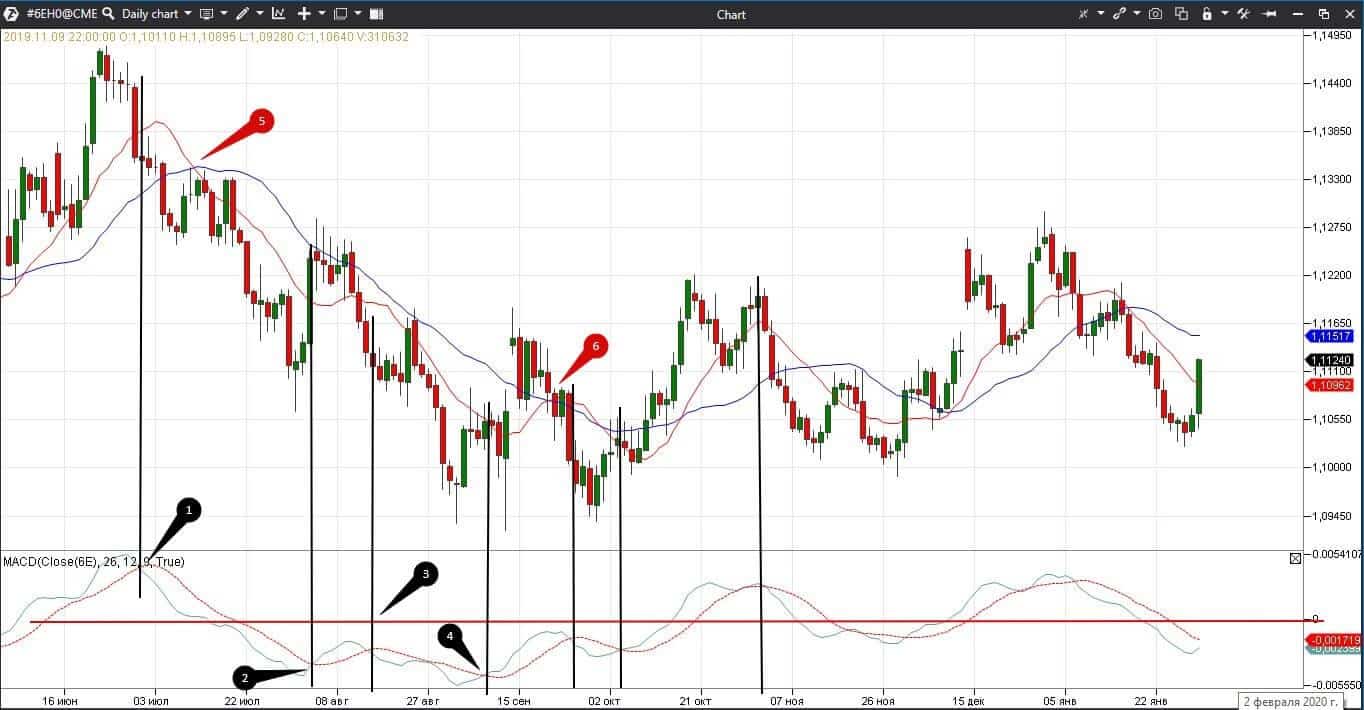
If a trader would simply follow the indicator crossovers during a local downtrend, then he should:
- sell in point 1;
- close the position in point 2;
- sell again in point 3;
- close the position in point 4.
Besides, a trader would have not be able to catch a big movement, while commissions would have been higher. If we use moving averages in the price chart as a simple filter, it would have been possible to reduce the number of trades and receive a bigger profit.
‘Divergence between the prices and indicator’ signal. In order for a classical divergence signal to emerge, the MACD line must cross the zero level. Reduction of the bar chart slope without crossing the zero is not a classical divergence from the point of view of Gerald Appel.
Let’s consider an example in the 15-minute EUR futures (6E) chart.
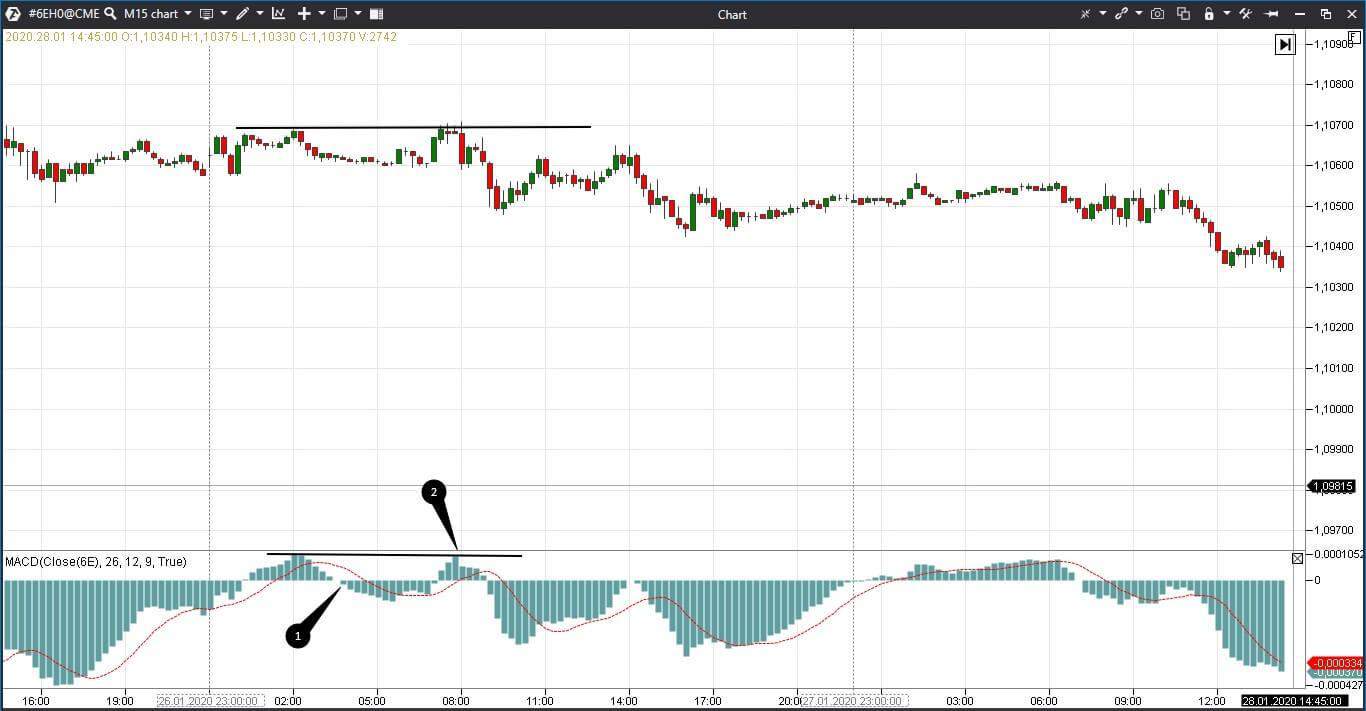
We marked two peaks in the price chart with a black horizontal line. The second peak is a bit higher than the first one. We also marked these two peaks with a black horizontal line in the lower part of the MACD indicator. However, peak 2 in the lower part of the screen doesn’t exceed the first one and the bar chart in pont 1 crosses the zero. This is a classical MACD divergence.
‘MACD line slope’ signal
| Indicator slope | Position relative to the zero line | Trader action |
| Slope increases, that is values become bigger | Lower | Open long positions |
| Slope increases, that is values become bigger | Higher | Register profit |
| Slope decreases, that is values become smaller | Higher | Open short positions |
| Slope decreases, that is values become smaller | Lower | Register profit |
‘Discrepancy between the bar chart and signal line’ signal shows a trader overbought/oversold areas.
‘A new high’ signal. A new high of the indicator in the daily chart for 2-3 months shows that the current bullish trend is very strong and, perhaps, the prices would grow even higher. Similarly, a new high of the indicator for 2-3 months shows the bearish trend strength.
Why MACD signals should be confirmed?
MACD shows many false signals in a flat and in a very pronounced trend. Moreover, it lags behind since moving averages are used in its basis.
That is why, the classical MACD strategy might be unacceptable for modern intraday traders, for whom it is important to receive reliable signals as fast as possible. That is why it makes sense to use cluster analysis.
Let’s consider an example in the 15-minute RTS index futures (RI) chart.
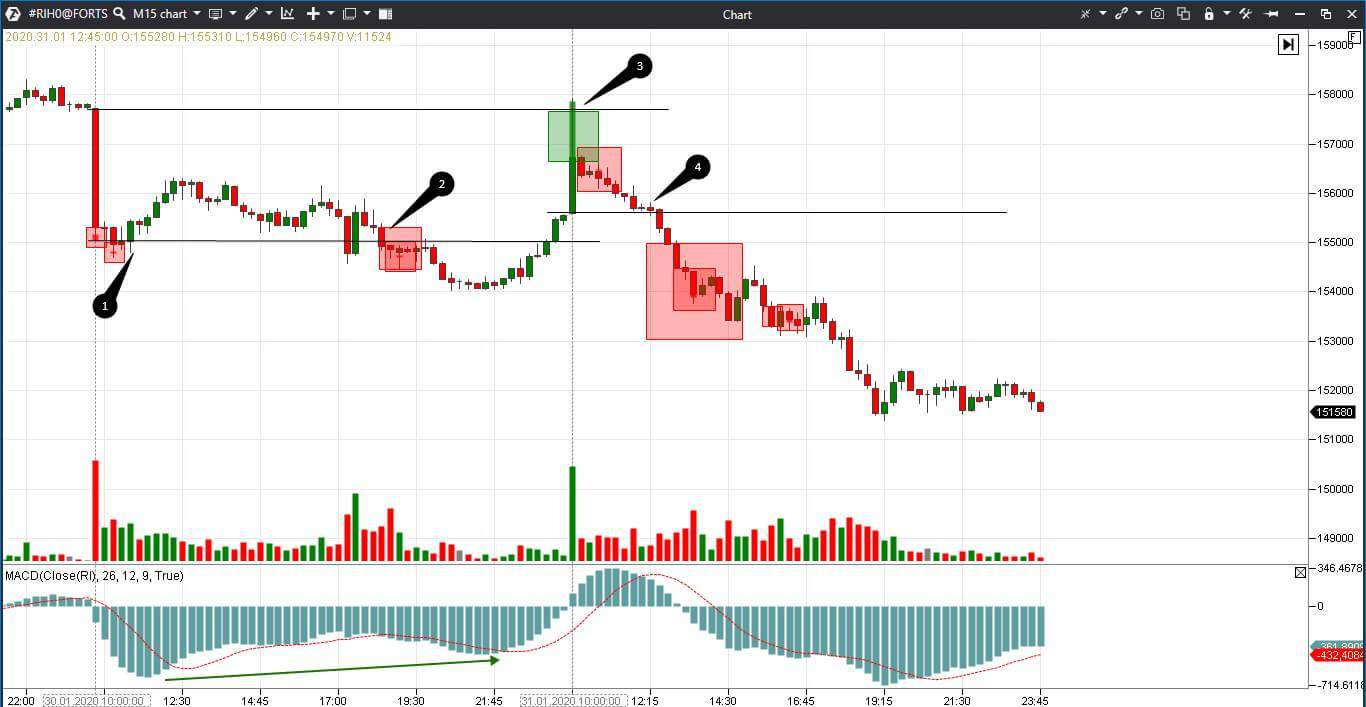
MACD goes down in point 1 and its slope increases since the indicator is below zero and it’s late to sell. We see in the chart that the market sells in the form of red squares failed to consolidate below the support level. If the sellers push and the price doesn’t fall, it means that the limit buyers are strong at this moment of time, that is why the price bounces upwards. The line crossover emerges on MACD too late for catching a small correction.
The price consolidates under the level and slightly decreases in point 2. The indicator is still below zero, that is why traders shouldn’t sell. However, we could make a bit of money using Big Trades, since the risk is low and we can post a stop just behind the level.
It consolidates again above the level at the end of the trading session. The second low is higher than the first low on MACD, but this is not a classical divergence since there is no zero crossing. One shouldn’t open long positions by this signal, but they could be opened by the line crossover signal.
A huge green candle tries to break the previous candle high with a huge volume during the first 5 minutes of the next day. MACD grows and crosses zero. However, Big Trades first shows big buys and then big sells in the next candle. Traders with long positions are blocked. Most likely, they would leave by stops if the price falls below the low of the first 5 minutes.
The price consolidates under the support level in point 4, MACD crosses zero and moves down. Big Trades shows active market sells below, that is why traders may hold short positions longer and make profit.
In general, MACD worked well and it properly showed the global picture and the market mood. However, it would have been difficult for an intraday trader to trade by MACD on the first day, while a trader could have opened trades by Big Trades. During the second day, the MACD signals lagged behind compared to the Big Trades signals.
Summary
The good old technical analysis will help to understand a trading situation, but it is more efficient to open trades with the help of more advanced and quicker instruments. If you are a beginner trader and want to use MACD and trade by its signals – try it on the demo-account first. Then try to trade using our ideas explained on our YouTube channel. Compare the results and draw conclusions.