Comparison of forex strategies and ATAS tools
We conducted an experiment in the recent article about improvement of Forex trading strategies. We looked for methods of increasing efficiency of standard strategies for trading currencies and made optimistic conclusions. Today we continue our study in order to confirm previous conclusions. We aim at helping Forex traders to be more advanced and possess modern instruments for achieving better results.
Read today:
- Improvement of the standard Forex strategy, based on ADX (Average Directional Movement Index), Parabolic SAR (Stop And Reverse) and Moving Averages (MA);
- Improvement of the standard Forex strategy, based on the Bollinger Bands indicator.
Introductions
Traders look for a magic trading strategy, which would make them rich in a couple of months. They dream to move to Maldives, lie in a hammock on the ocean’s beach and drink martini with vodka like James Bond.
However, the majority of books and forums consist of general recommendations and advice like ‘follow the trend and exit from loss-making positions’. There is not much specifics in such a teaching. We will tell you in this article step by step what indicators to apply and when to buy and when to sell.
But let’s be open. Nobody can give you guarantees that even very accurate recommendations would work on your trading account and with selected instruments, since trading is connected with a work under conditions of uncertainty. We just try to increase the chances for a positive outcome with the help of the advanced trading platform. We do not guarantee that you would make a fast profit when offering you to use ATAS in your work, we just show you how to take your trading to a higher level with the help of proper modern instruments.
Improvement of the strategy based on ADX, Parabolic SAR and Moving Averages
In our first experiment we put our crafty hands on a Forex strategy based on 4 classical indicators:
- ADX (14) (in the following chart we set the display of DL+ and DL- only. They are marked with the green and red lines respectively and we hide ADX for compactness);
- Parabolic SAR (0.1; 0.01);
- WMA (5) – green line;
- SMA (11) – red line.
We buy if:
- WMA (5) > SMA (11);
- Parabolic SAR is below the candles;
- DI+ > DI-.
We sell if:
- WMA (5) < SMA (11);
- Parabolic SAR is above the candles;
- DI+ < DI-.
We register profit when the Parabolic SAR changes direction. Stop loss is above/below the previous local high/low.
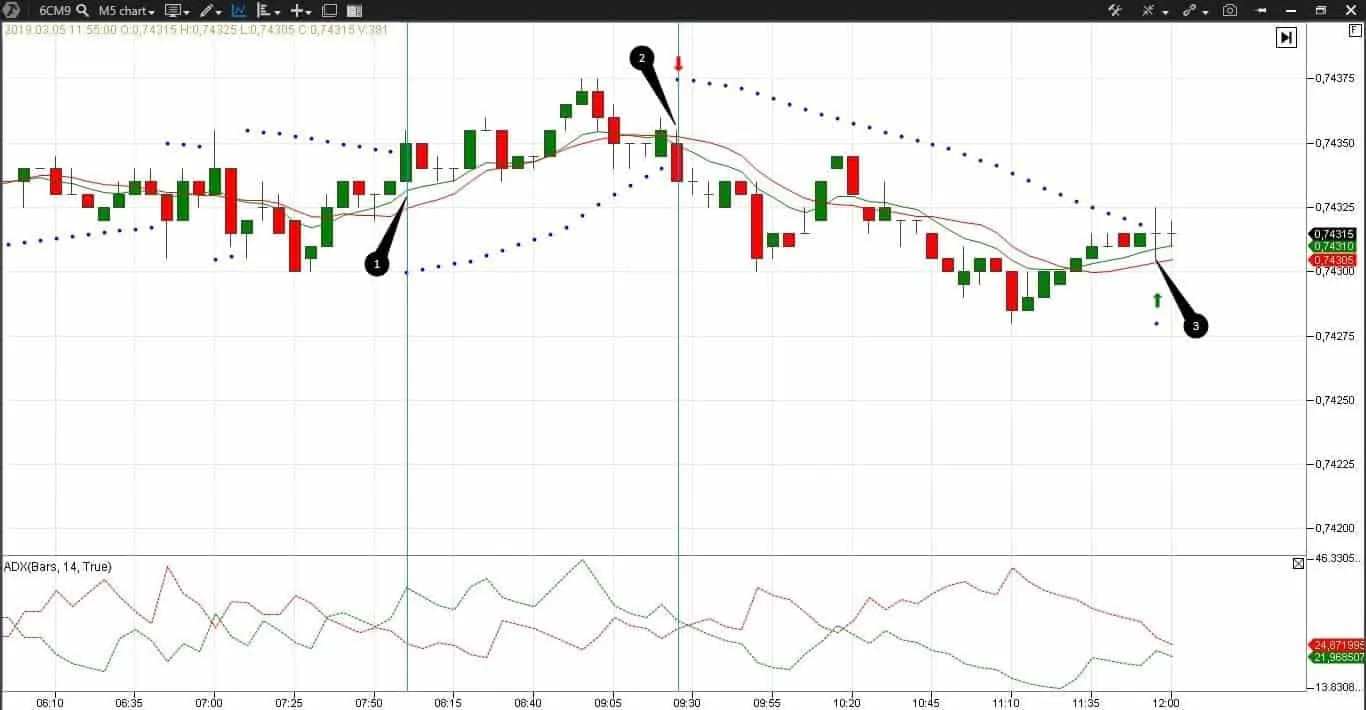
Let’s check this strategy in the 5-minute CAD futures (6CM9) chart.
We assess an already formed trading situation, that is why we easily find points of entry and exit. Remember, there are no ideal setups in real trading.
We open a long position in point 1, which is marked with a horizontal line. We should close it in point 2, marked with a red arrow, by the system signals. Unfortunately, the technical indicator signals are late in coming. The common sense would urge us to close the trade earlier, but disciplined traders cannot choose when to follow the trading system rules and when not to. If you choose what to follow and what to ignore, you do not have a trading system and discipline.
We open a short trade on the bar that follows point 1 in accordance with the rules of our trading system. We close it in point 3 and the closing signal is late again.
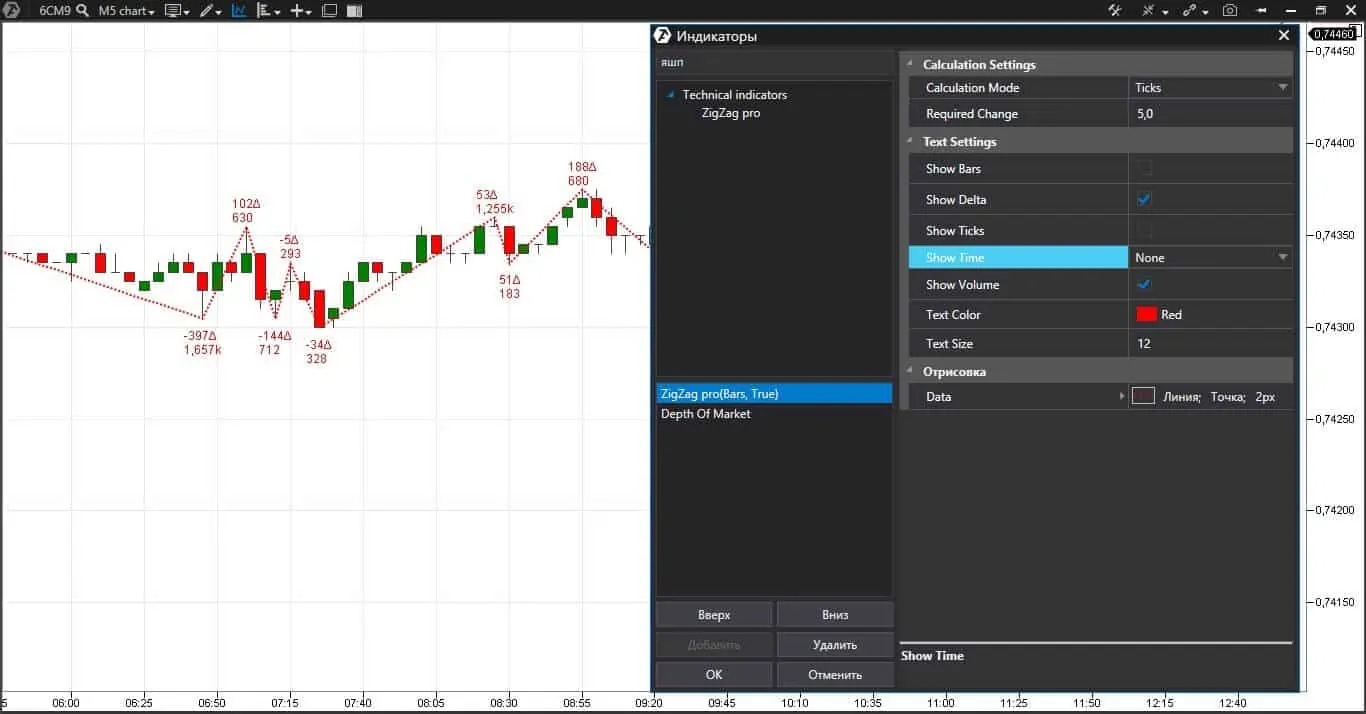
Let’s see how you can trade this situation in ATAS. We decided not to use cluster indicators since it would be an unequal fight in different weight classes. We also use a technical indicator in ATAS – ZigZag pro with the following settings.
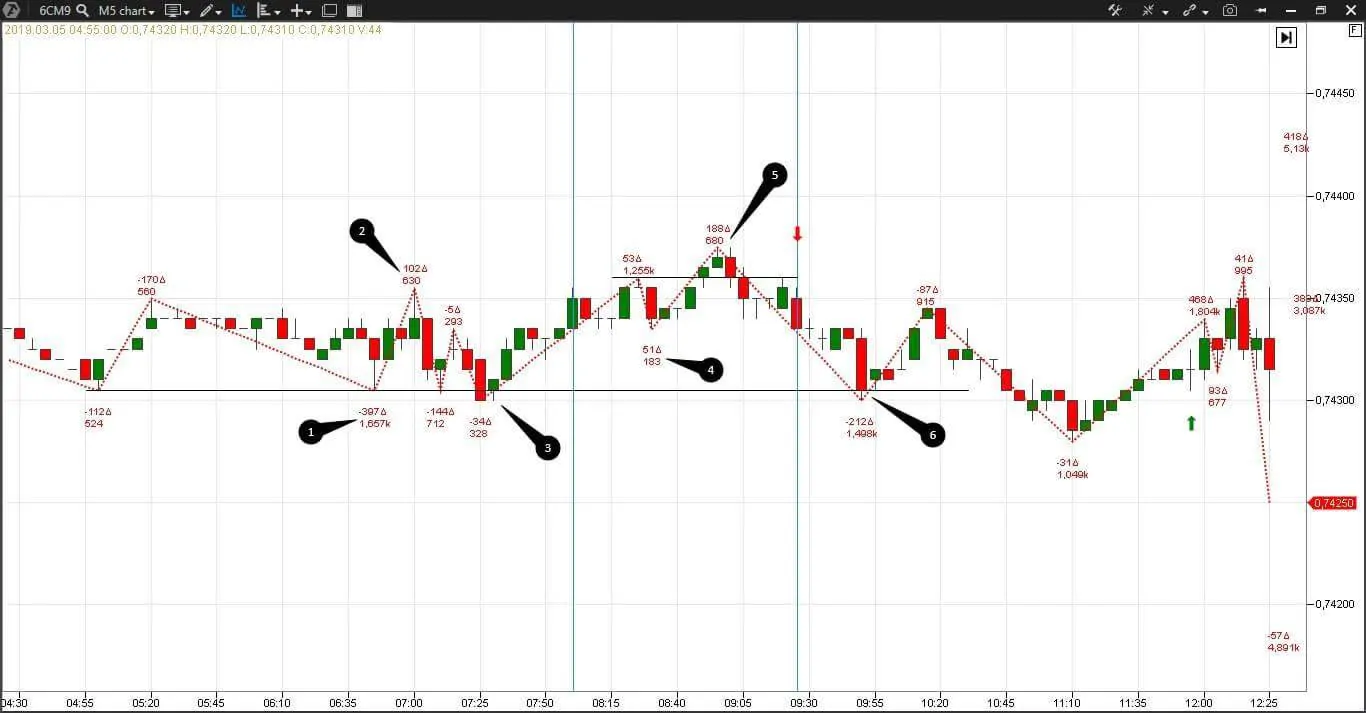
This is the chart we had as a result.
Black horizontal lines are local support and resistance levels, while the red polygonal line is the ZigZag pro indicator.
The ZigZag pro indicator shows trends. It draws a knee in a chart every time the price changes in accordance with settings – it is 5 ticks in our case. The indicator connects all points with straight lines (waves) and shows the total volume, delta and other parameters for each wave. We want to see the delta and volume only. We should note that the ZigZag pro indicator is not a magic wand and zigzags are formed gradually (as they say – are redrawn) during a real-life trading session.
We work creatively with the ZigZag pro indicator and consider the price movement in waves. Big and small waves alternate. Buying and selling waves also alternate. The price cannot move in one direction with similar efforts during a long time. We considered all these principles in detail in articles about Weis Waves. The wave analysis is an art, that is why it is difficult to call it a trading strategy.
Let’s emphasize two basic principles:
- price slowdown near the level for the second/third/fourth time. These could be support and resistance levels, the day’s highs and lows, the upper and lower boundaries of the Value Area (VA) of the previous day and any other levels, which are important for you;
- Shortening Of Thrust (SOT). Shortening Of Thrust could be expressed in direct volume reduction and price progress. And could be expressed in small reward for applied efforts, that is, the volume is high but the price moves insignificantly.
So, we will look for wave reduction at the support or resistance levels in the chart, analyzing the volume decrease or increase. Once again, the ZigZag pro indicator is not magic. It will, as any other technical indicator would do, be late and ‘cunning’. This strategy is really an art, since, apart from the wave analysis and excellent indicator, we would need luck.
The biggest, from the beginning of the trading session, volume passes in point 1. However, despite such a strong effort of the sellers (the negative delta tells us that the sellers predominate) the price does not fall. The price stops at the support level and bounces upward. The volume of buys in point 2 is minimal, especially if we compare it with the volume of sells in point 1. There are no buyers, which means there is no ‘fuel’ for the price growth. There is a big probability that the price would fall to the support level, which actually happens in point 3. This is the fourth touch of the support level. But look attentively at the volume in point 3 – it is practically the smallest one from the beginning of the trading session, which means that the selling waves are reduced at the support level. This is exactly what we want to see, that is why we buy from this level with a small stop.
The price grows while we buy. We transfer the stop to the breakeven level and watch how the market situation develops. There is a very big volume on the first peak after our entry. We know that waves rarely travel alone and, being at the breakeven, we decide not to close the trade here. You can do it differently.
A small price correction takes place in point 4, but the delta is positive and the volume is minimal, which means there are no sellers. Perhaps, the price reduction is connected with registration of profit by long positions. The buying wave sharply reduces in volume in point 5. The buyers lose strength despite the positive delta. We close the position and register profit. We cannot exit on the very top, because in a real-life trade we would get the signal after the price reversal, however, we can assess reduction of the second wave even visually. And since we see the wave reduction at the support level again, we immediately open a short sell. We may identify the take profit beforehand in this trade – it is a support level, which the sellers failed to break 4 times. We close the short position in point 6.
We calculate the potential profit in a table.
| Forex strategy | Combined with ATAS functionality | |
| Number of profitable trades | 2 | 2 |
| Potential profit for one contract in USD | 0,1+0,35=0,45 | 0,65+0,55=1,2 |
Improvement of the standard Forex strategy based on the Bollinger Bands indicator
We will need only the Bollinger Bands indicator (20,2) for the second experiment with the Forex strategy.
We buy if:
- the indicator is tilted upward;
- the price touched the middle of the indicator from bottom to top.
Stop loss is at the lower boundary and take profit is at the upper boundary of the indicator.
We sell if:
- the indicator is tilted downward;
- the price touched the middle of the indicator from top to bottom.
Stop loss is at the upper boundary and take profit is at the lower boundary of the indicator.
Опробуем на 5-минутном графике фьючерса на E-mini Euro E7M9.
Let’s check it in the 5-minute E-mini Euro futures (E7M9) chart.
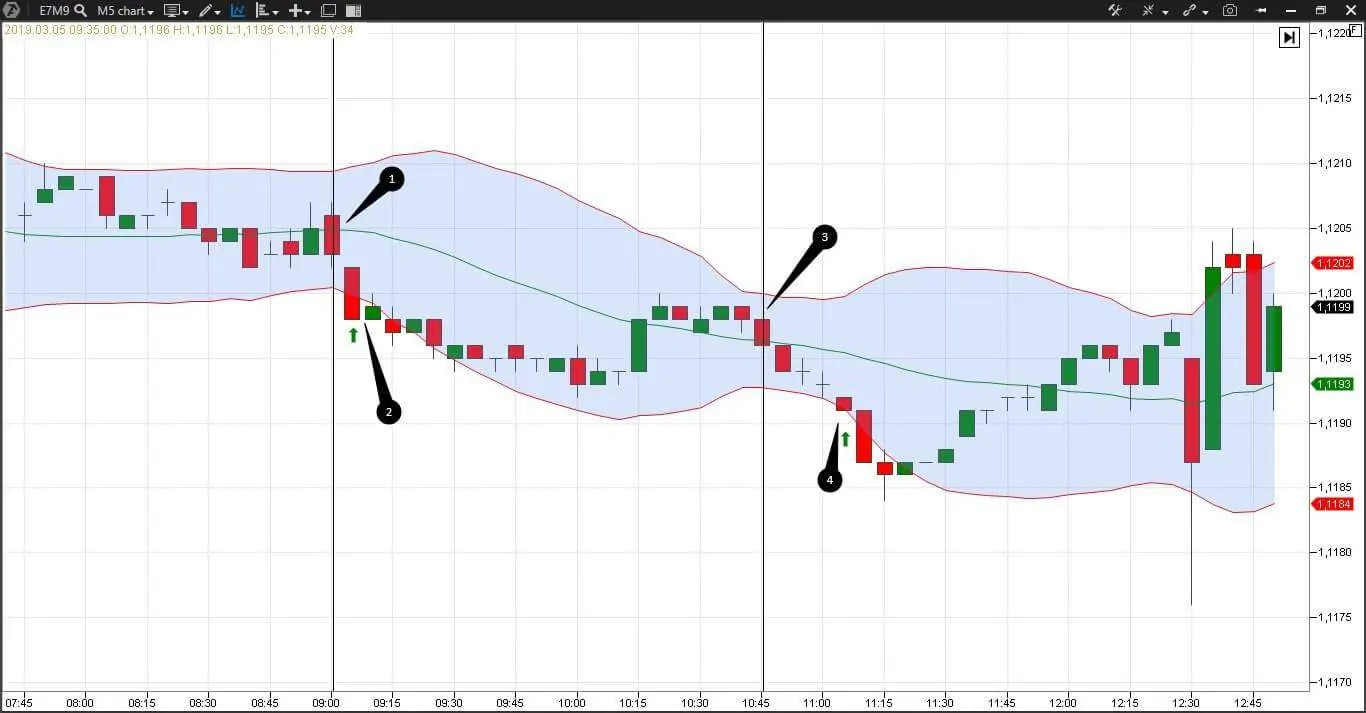
The Bollinger Band looks down, that is why we would sell in points 1 and 3. Points of entry are marked with vertical lines, while exit points are marked with green arrows. We close the first trade in point 2 – we are nearly scalpers here. We hold the second trade a bit longer and close it in point 3. We will calculate the potential profit in a table below.
Let’s see whether we can improve this result in ATAS.
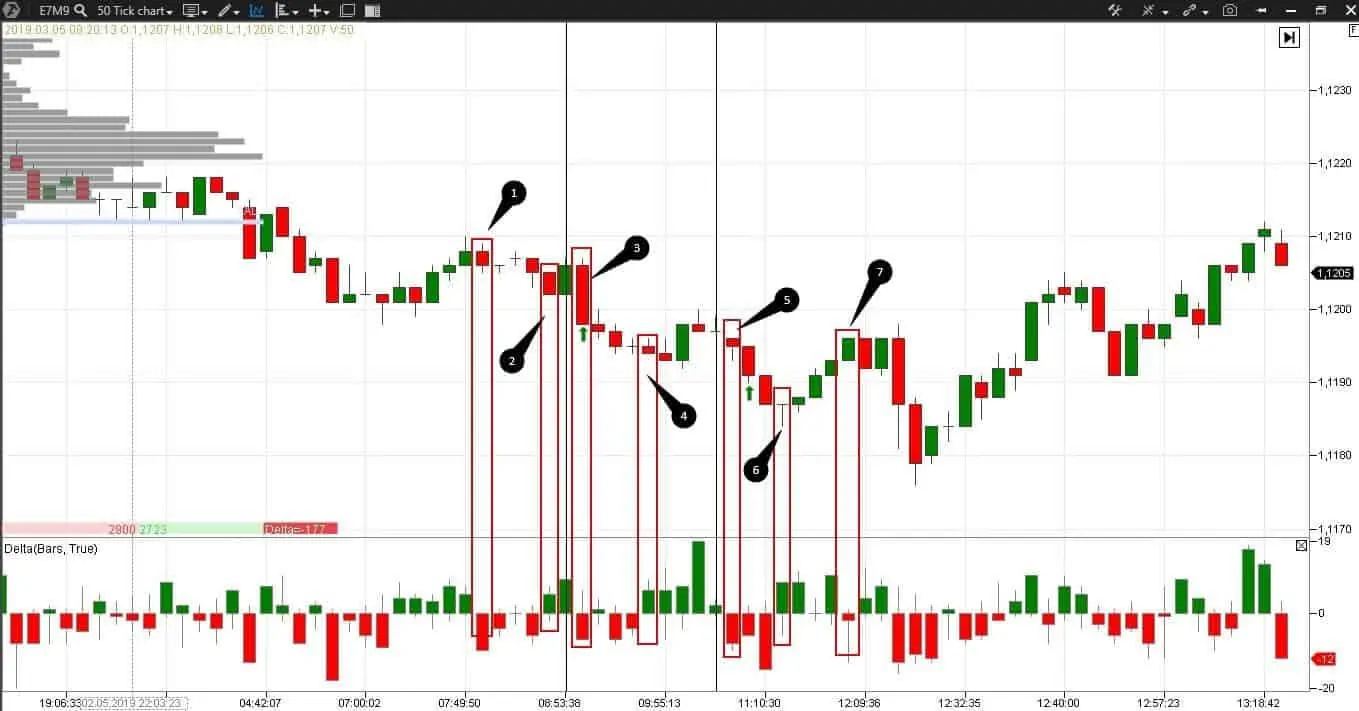
First, we will work with the 50-tick chart instead of the 5-minute one. The charts, which are not time-based, perfectly filter out the market noise and show focused movements clearer. Exactly 50 trades take place in each candle in the 50-tick chart. They might be big or small and cover 1 minute or 10 minutes – it doesn’t matter. What matters is that there are exactly 50 of them. Let’s add graphical display of the previous day’s Market Profile and Delta indicator, which shows overweight of buyers and sellers.
Our simplest trading strategy is ready.
We buy if the delta becomes positive at the local low.
We sell if the delta becomes negative at the local high.
We register profit when the delta changes. Stop loss is 1-2 ticks above the high/low.
We use the previous day’s Market Profile to assess the bearish or bullish direction of the current trading session beforehand. If today’s opening is below the VA of the previous day, then the VAL (Value Area Low) would be a local resistance level, while the price may go further down. If today’s opening is above the VA of the previous day, the VAH (Value Area High) would be a local support level, while the price may go further up. These are not strict rules – just a preliminary assessment.
The trading session opening approximately coincides with the previous day’s VAL. The price cannot move further up and starts going down slowly. We will look for a point of entry into a short position in such a situation. The price leant against the previous day’s VAL, which became the resistance level, in point 1 after a small bounce. The Delta at the local high became negative – it is high time we sold. The Delta became positive in point 2 and we close the trade.
The Delta is negative again in point 3 and the price sharply moved down and we sell again. We close the trade in point 4 when the Delta changes at the day’s local low. The Delta changes again in point 5 and we sell again, since we observe how buyers cannot push the price higher despite all their efforts. We close this sell in point 6 and immediately open a long position.
We will explain you now why we open a long position in this candle and not in point 4, where we also had a local low and the Delta changed. Candle 6 differs from candle 4 with green color and long tail of the candle itself and its delta. We got confirmation in candle 6 that buyers emerged, so, we also will buy.
We close the long trade in point 7 when the Delta changes at the local high of the day. Let’s compare the potential profit and number of trades by different strategies in a table.
| Forex strategy | Combined with ATAS functionality | |
| Number of profitable trades | 2 | 2 |
| Potential profit for one contract in USD | 0,7+0,5=1,2 | 0,3+1+0,7+0,5=2,5 |
Summary
Simple technical indicators and trading systems gradually become outdated. They are pushed away by trading robots and more advanced modern trading and analytical software. Ask any person whether he would prefer to wash things by hand if there is a washing machine available. The same is in trading – ask yourself whether you are ready to trade in QUIK or MT when there is ATAS available. Try ATAS for free and you will get the answer.

