How to analyze “Weis waves” with ruler and delta indicator
After publication of the article about trading with the Weis Wave Indicator, we noticed your interest in this definitely engaging subject. That is why we decided to analyze some more relevant charts, which can be of interest to you.
Read in this article:
- David Weis chart and his interpretation of the waves volume;
- how to analyze waves without the Weis Wave Indicator;
- application of the Volume charts;
- search for an entry with low risk for trading by Weis Waves.
First, we will remind you who David Weis is. He is a follower of theories developed by Richard Wyckoff as early as in the beginning of the 20th century. David Weis is one of the most recognized world experts of Wyckoff methods with practical experience of about 50 years. By the way, David holds in his hands the first book of Richard – Studies in Tape Reading – on the main page of his website (weisonwyckoff.com).
Wyckoff used to say that his students “think in waves” and several decades later David Weis developed application of the wave pattern for the market analysis. Due to his wide public activity, the Weis Wave Indicator, developed by him, became popular among traders.
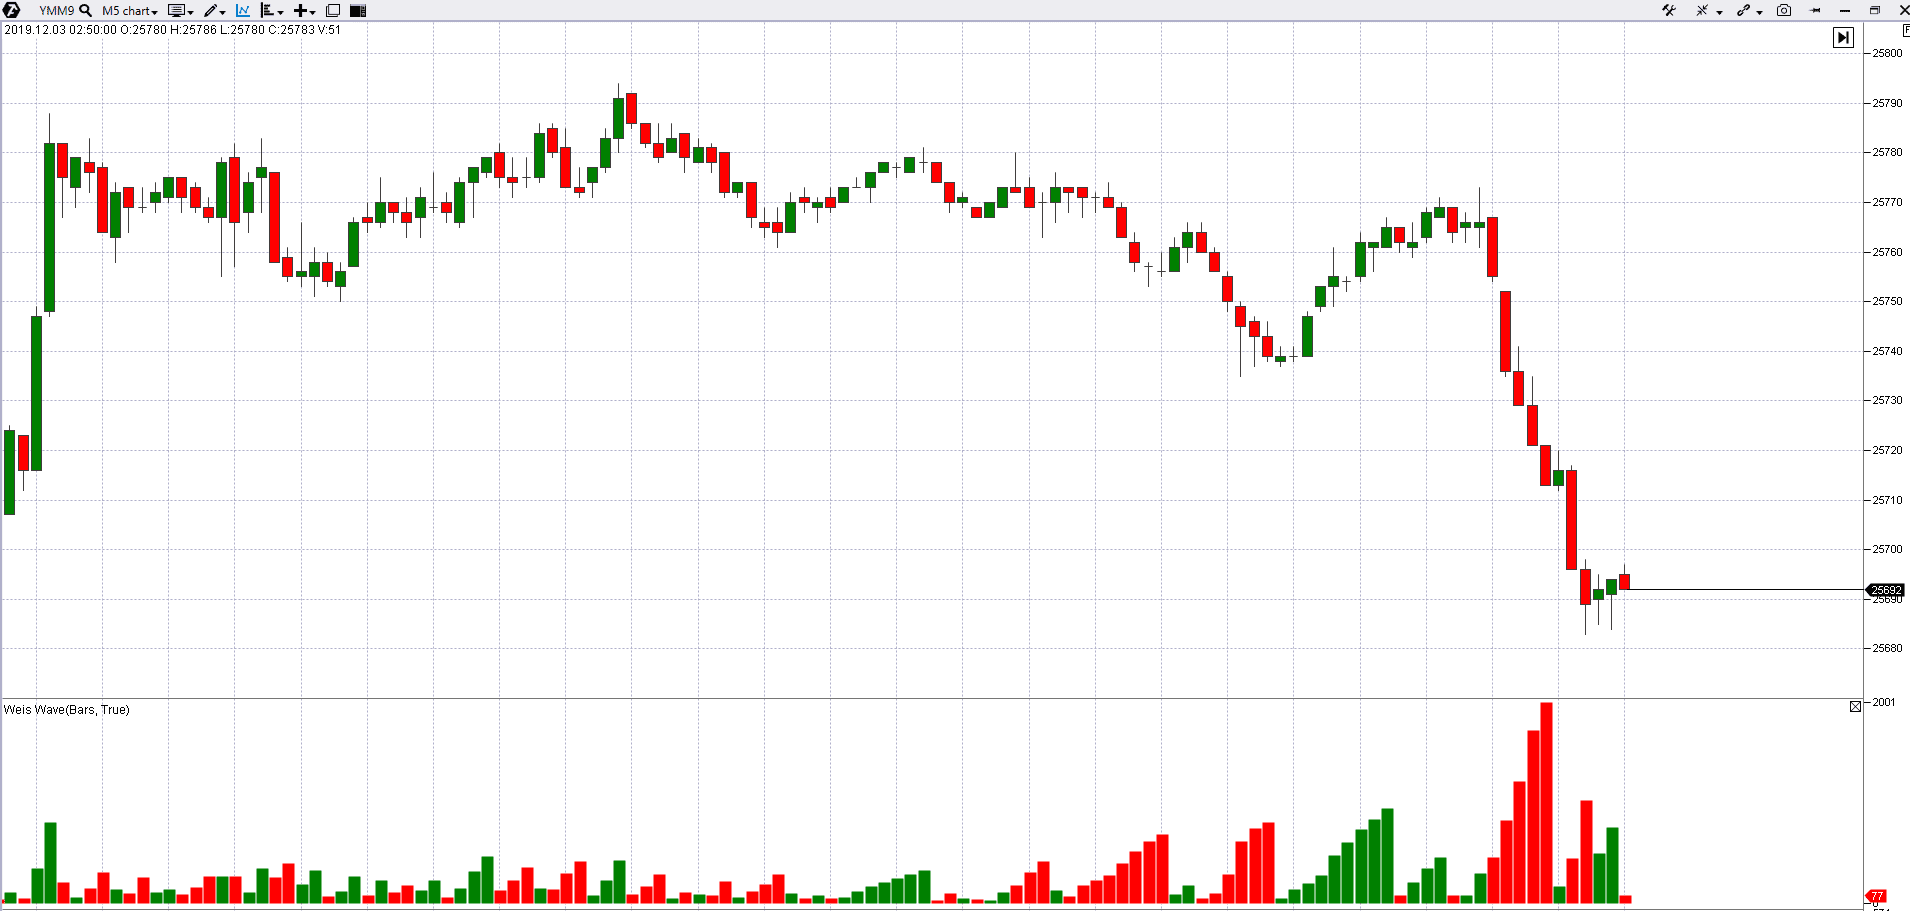
The picture shows the Weis Wave Indicator in the chart of a Dow Jones Index futures (YMM9). As you might guess, the Weis Indicator uses a built-in algorithm, which:
- splits the general chain of price bars into a sequence of alternating ascending and descending waves;
- sums up the volume at each of the waves (the sum of volumes on each of the bars that compose a wave);
- displays the received volume in the form of a bar chart. Since the Indicator uses a cumulative volume, the bar chart looks like triangles, which end abruptly to the right. Green triangles present volume of the ascending waves, while red ones – volume of descending waves.
The Indicator might be applied to any market, period and chart type.
How to interpret the Weis Wave Indicator values
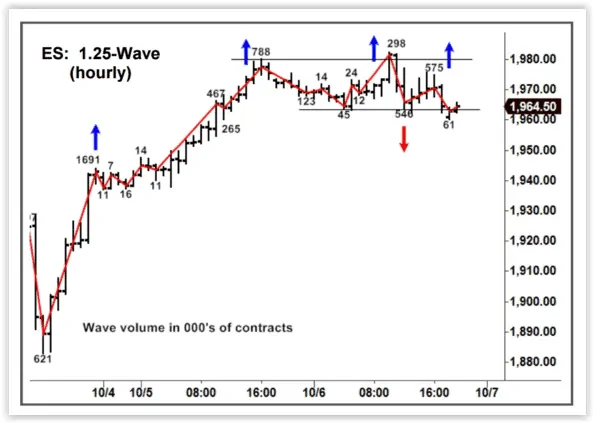
Let us consider an example from the original source. Here is a E-mini S&P futures chart with 1 hour period. It was October 2015.
The red polygonal line symbolizes splitting into waves, while the figures at knees are sums of the volume at a previous wave.
Here’s how David Weis himself interprets the Indicator data:
The wave volume on an hourly chart underlines the weakening version. A big wave on Friday attracted the biggest up-volume (1.6 million). Volumes on upward waves on Monday and today were 788K and 298K. The volume of more than 500K appeared this morning on the repeated test of the high, but it didn’t result in a new high. It was preceded by a down-wave of 548K – the biggest one after the Friday’s low. The market should go into a next fluctuation downwards with the help of just a minor push.
In other words, David sees the bearish market mood in this sequence of waves. He makes this conclusion comparing not only wave volumes but also their price characteristics.
Let us use the power of the trading and analytical ATAS platform and look for bearish patterns in a wave chart in modern markets.
Weis Waves in the gold market
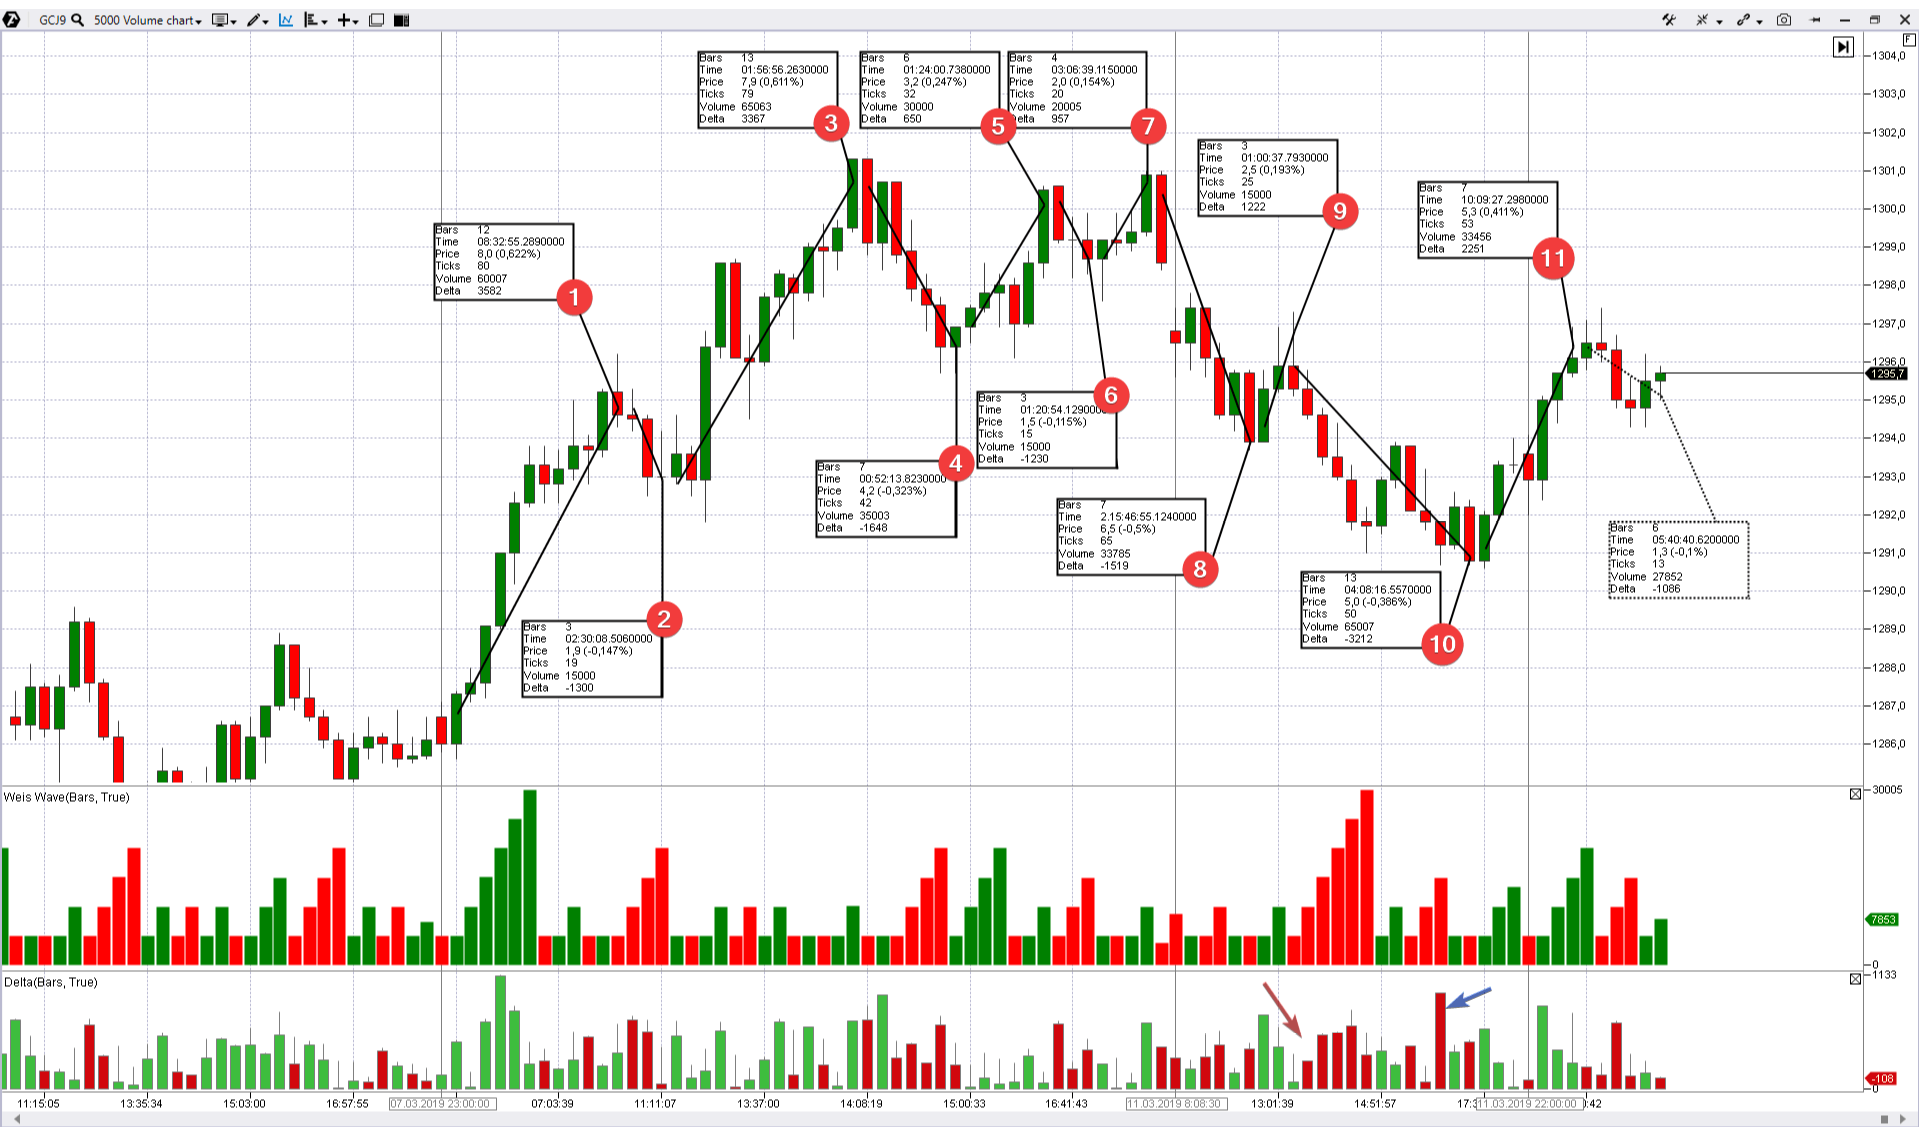
The picture below shows a gold futures (GCJ9) chart. Let’s make some necessary notes before we start interpreting wave characteristics.
First, we use the Volume chart type. The 5000 parameter was selected experimentally. It means that the trading volume in each candle is 5 thousand contracts (with a small technical tolerance). The Volume chart type has several advantages:
- it “squeezes” time periods with low volatility and “expands” periods with high volatility. The chart becomes more homogeneous;
- it excludes a necessity to use the Volume indicator and makes the working space cleaner.
Second, regarding the indicators and chart marking:
- Weis Waves are in the first area, under the price chart. Actually, this indicator is the subject of this article;
- Delta is in the second area, under the price chart. It shows the balance of buyers and sellers. In fact, delta is a difference between executed buy and sell orders (read here in more detail about delta). Delta is required for manual splitting the chart into buy and sell waves;
- A ruler. We manually split the chart into waves with this simple instrument (press F9 to activate the ruler) using simple logic. An upward wave, with one possible intermediate red bar, starts when there are two green bars on the delta. A downward wave, with one possible intermediate green bar, starts when there are two red bars on the delta. We have 11 waves in our example. Manual splitting the bar chains into waves is a creative process and every trader can have his own unique result. That is why, periodical exceptions are quite possible – it depends on an analyst.
As you might notice, the algorithm inside the Weis Wave Indicator is rather sensible and the indicator values display a bit “hectic” and “noisy” behavior – it switches from wave to wave too fast acting on the edge of the chaotic state. It is rather difficult to analyze these values.
However, if we use manual splitting by the above described method, a sequence of waves becomes more reasonable and logical. A distinctive feature of correct splitting is that the ruler shows negative delta on downward waves (marked with even numbers), while the delta is positive on upward waves (marked with odd numbers).
Let us analyze waves one by one:
- A strong upward wave. The price increased by 0.62%. The wave volume is 60 thousand contracts.
- A small pullback by -0.15%. Less than a half of the previous growth.
- One more strong upward wave. The price increased by 0.61%. The wave volume is 65 thousand contracts. Practically identical characteristics with wave 1.
- A deeper pullback. The price decreased by -0.32% – just to the middle of the previous upward wave. Maybe even deeper than by 50%. The volume increased to 30 thousand contracts. It is a sign of weakness.
- This upward wave is weaker than the previous one. The reasons are 1) length – the wave lasts for 6 candles, while the previous one lasts for 13 ones; 2) volume – 30 thousand is two times less; and 3) the price growth progress – the market grew by 0.25% only.
- A small technical pullback.
- One more upward wave, which is even weaker than the weak wave 5. Look how the buying strength is exhausted – the price progress is less and the wave volume is only 20 thousand traded contracts. If we compare the process dynamics on consecutive waves 3, 5 and 7, it becomes obvious that bulls are not ready to rally above the level of 13000.
- Bearish change in the market behavior. This reduction added weight to bearish wave characteristics – the volume increased to 65 thousand contracts (compared to 35 and 15 thousand on two previous downward waves) and the price progress is -0.5% (-0.32% and 0.15% on previous downward waves respectively). Opening a short position becomes justified after this explicit change in the market behavior. We just need to wait for a technical rally.
- This short upward wave provides a possibility for opening sells. The delta is exhausted (marked with a red arrow) and the candle closings are weak (long tails on top mean pressure of the sellers who became active after success on wave 8).
- Reduction that was expected. It was culminated by a splash of sells (marked with a blue arrow) – a good moment to register the profit from the short positions opened on wave 9.
- The growing wave shows that the bulls come back to the game. Characteristics of the buy wave improved both by volume (more than 30 thousand contracts) and progress (+0.41%). Note that the sellers pulled up the growth just at the level of 1297, where weakness was registered before.
- The wave is in the process of formation. The forecast is neutral.
Look at the Weis chart. When he wrote: “The market should go into the next downward fluctuation with the help of a minor push”, he probably meant the wave with characteristics of wave 8 in the gold futures chart.
Weis Waves in the Gazprom stock market
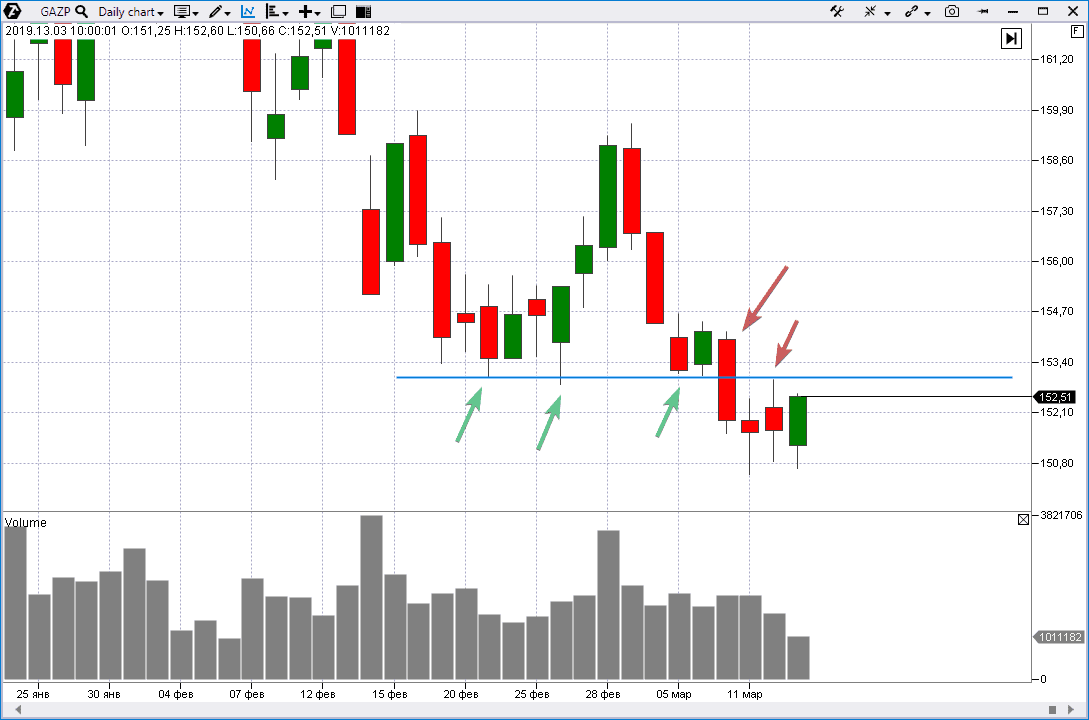
If you open a day chart of the Gazprom stock (GAZP ticker on the Moscow Exchange), you will see that the price bounced (marked with green arrows) several times from the support level of RUB 153 per share during the period from February 19 until March 6.
The price broke this support down on the growing volume on March 7 (first red arrow). Consequently, the intraday traders got an idea for opening a short trade during a potential breakout level test.
The GAZP price went up to the breakout area of the former support at the level of 153. It was a chance. Should we open short positions? If yes, when? How to find confirmation for playing in the “team of bears”?
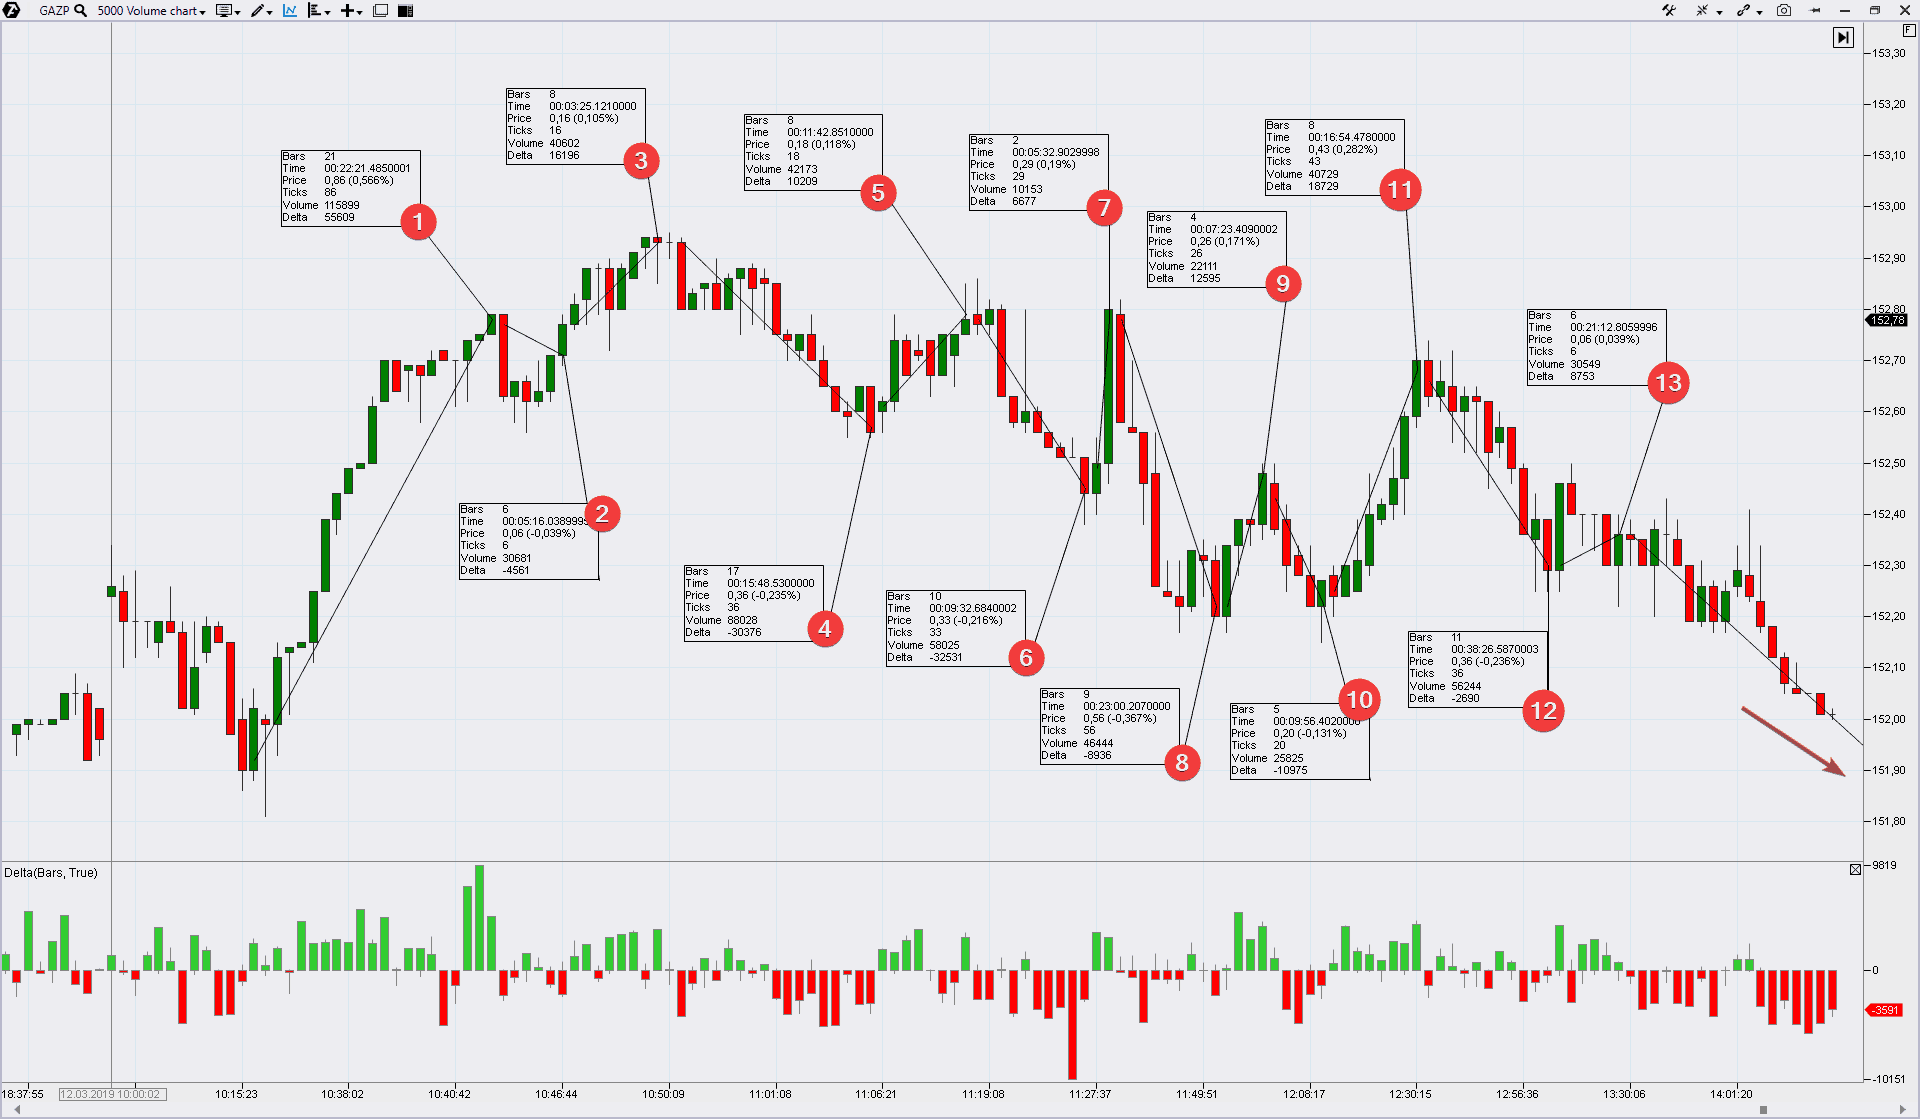
Look at the chart. This time we refused to use the Weis Wave Indicator and again we use accurate manual chart splitting into waves with the help of the ruler. Any analyst selects the instrument he needs, so, you can use those functions, which you consider necessary.
Dynamics of waves 1, 2, 3 and 4 tells us that the buyers’ pressure is being exhausted and the sellers take the initiative in their hands, which can be seen from the qualitative change of wave pairs – upward movement becomes weaker and downward movement becomes stronger. Wave 5 failed to overcome 50% of the length of the previous downward wave – it is a bearish sign.
More aggressive intraday traders could have entered into shorts on top of this wave 5, finding confirmation in the form of long tails on top of the candles on the wave peak. Those who failed to do that had one more chance in the form of wave 7, which has a purely manipulative nature by its shape, since, most probably, its goal was to activate stop losses of early bears before the forthcoming reduction. Wave 11 peak is a comfortable signal for conservative shortists.
As you can see, you can build your trading tactics and strategy through comparing characteristics of the buyers and sellers waves.
Let us come back to the day chart. Look at February 28. A test of former support took place on top of this bar at the level of RUB 159 per share, which was broken on February 14. Download ATAS and analyze waves as David Weis did. You will see a signal at the entry point into a short.
Weis Waves in the oil futures market
The next example shows how Weis Waves work on high speeds. The ATAS platform provides very convenient functions for scalpers and the Weis Wave chart can become a substantial aid for them.
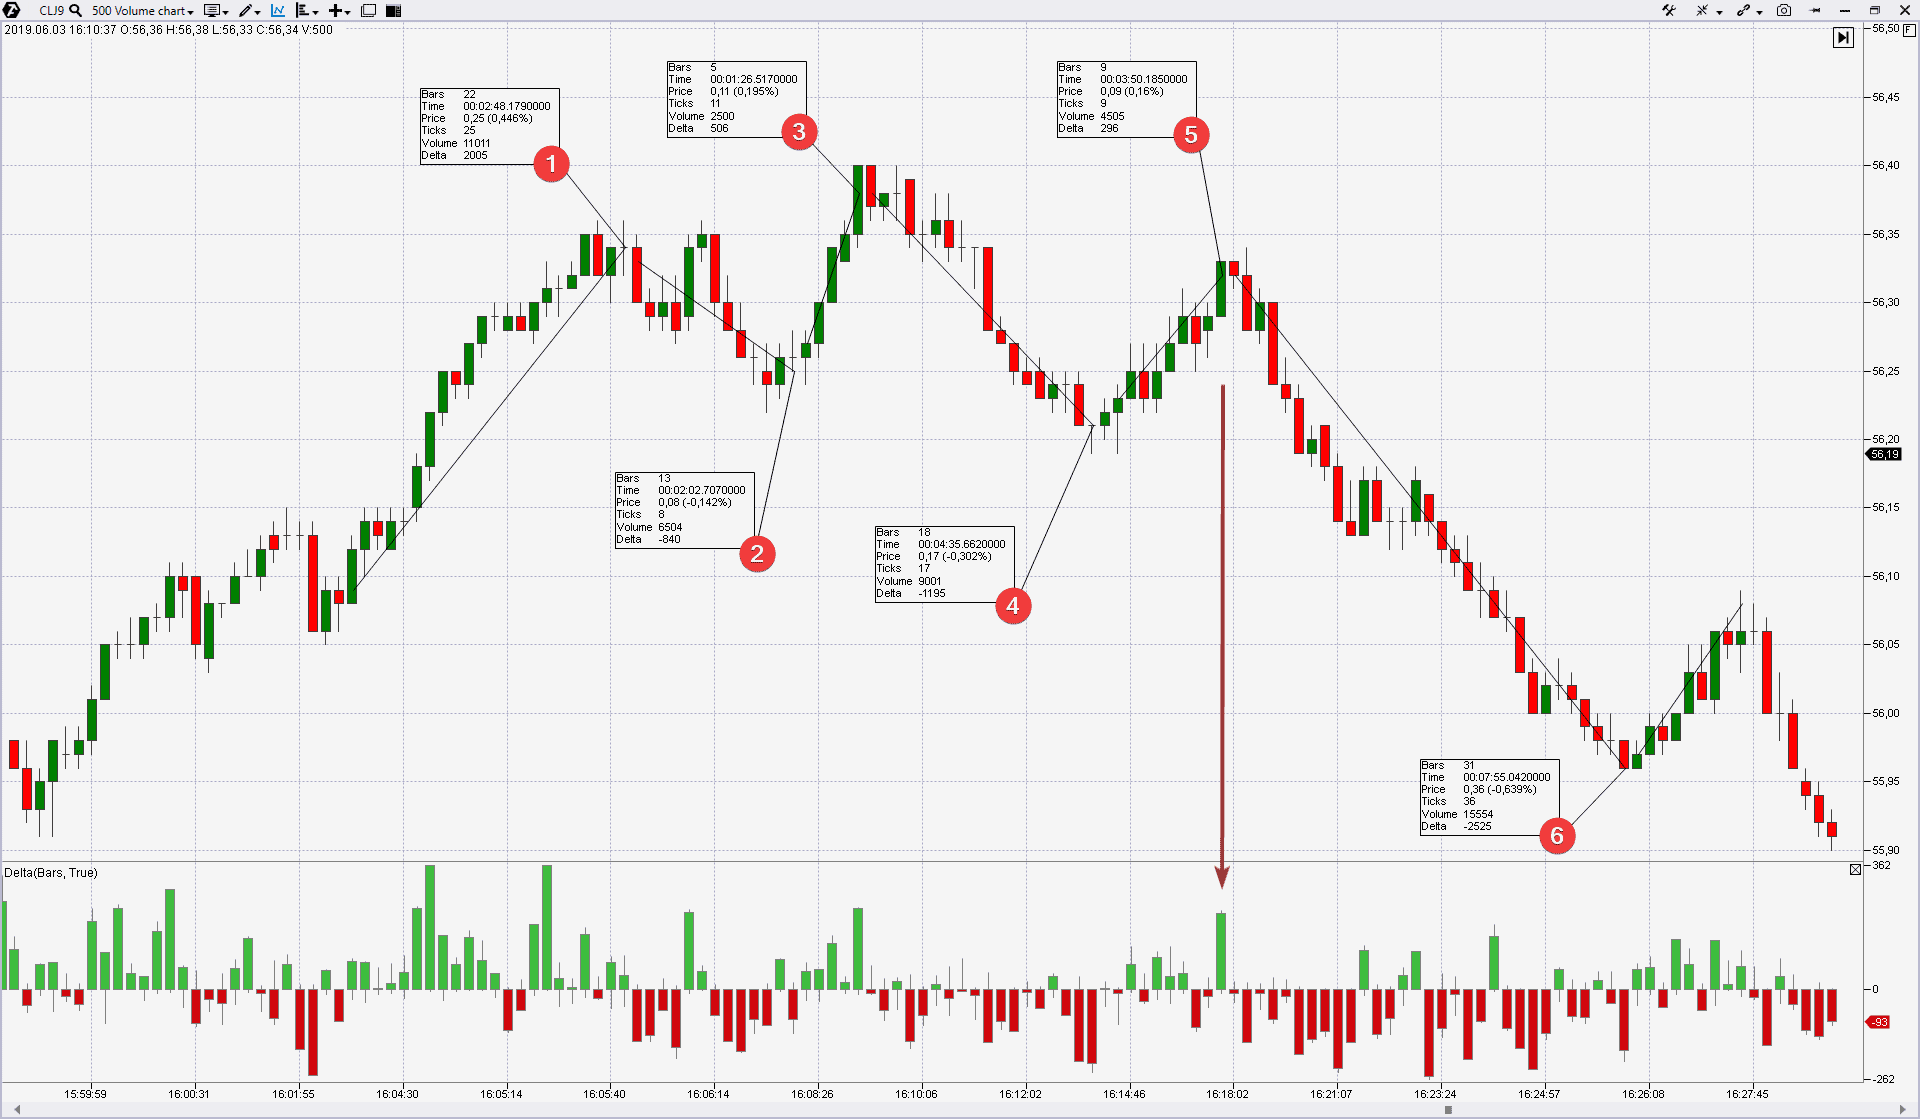
It is a WTI oil futures chart (CL ticker).
Comparison of waves 1, 2, 3 and 4 shows that the market initiative goes from the hands of buyers to the hands of sellers. While wave 3 managed to overcome the previous high only insignificantly (a trap for bulls), wave 4 completely levelled down its achievements and looks like a more expressive bear wave compared to number 2. This dynamics justifies entry into shorts in the end of the next upward wave, which should be weaker than number 3.
Exactly so. The “green splash” on the delta signals about a local culmination of buys (read about culmination of buys in this article) from the VSA and cluster analysis series of articles) exactly at the level of 50% from wave 4. Further reduction on wave 6 brought profit to those who managed to read a change in the market behavior, while the analysis of buy and sell waves by Wyckoff-Weis method provided a timely indication for this.
Summary
This publication not only discloses the course of thoughts of an analyst when interpreting a wave chart the way David Weis teaches us. We also wanted to show that a rich functionality of the trading and analytical ATAS platform allows conducting market research with high quality and convenience, adjusting to the needs of every individual user.
Nota bene. We considered only bear reversals in this material. Click the like button through Facebook if you liked the idea. And we will prepare the third part of the article about Weis Waves, where we would consider splitting and sequential analysis of wave characteristics on important lows for different markets. You will see how a comparative wave dynamics gives well-grounded signals for entering into longs at the beginning of the growing trend.

