Weis Waves is one of a number of indicators of the trading and analytical ATAS platform. Download ATAS, press CTRL+I and the indicator window will open. Weis Waves Indicator is somewhere in the end of a huge list of technical indicators. But its value is not so ordinary.
In this article:
- the history of Weis Waves Indicator emergence;
- how the indicator works;
- in what charts the Weis Waves Indicator works better;
- how-to-use recommendations with examples;
- advantages and disadvantages of the indicator.
The history of Weis Waves Indicator emergence
David H. Weis is a follower of the Wyckoff tape reading method, which he studied for more than 50 years. The name of the Wall Street legend is even in the name of the David’s web site – weisonwyckoff.com.Trading starts from supply and demand and the Weis Waves Indicator started from wave charts with trading volumes, summed up by Wyckoff for each wave in his studies in the beginning of the 20th century.
Below is a picture from the investment and trading course of Richard D. Wyckoff.
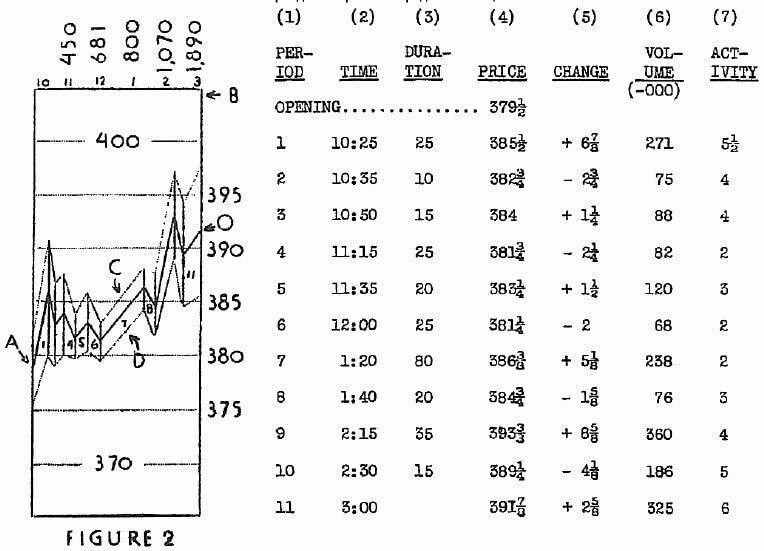
You will think in waves. Richard D. Wyckoff
David Weis developed the concepts of Richard Wyckoff further. It became easier to build charts and conduct analysis of alternating waves of price and volume in different markets and time periods with the software development. In his “Trades About to Happen: A Modern Adaptation of the Wyckoff Method” book, Weis writes: “price movement unfolds in waves rather than in equal time periods” and the wave volume shows everything better than hourly or daily charts.
How the indicator works
“The action of the volume tells us of the supply and demand; price merely denotes the value of the volume”. Humphry B. NeillThe Weis Waves Indicator sums up volumes in each wave. This is how we receive a bar chart of cumulative volumes of alternating waves.
Namely the cumulative volume makes the Weis wave charts unique. It allows comparing the relation of the wave sequence characteristics, such as correspondence of the applied force (expressed in the volume) and received result (the price progress).
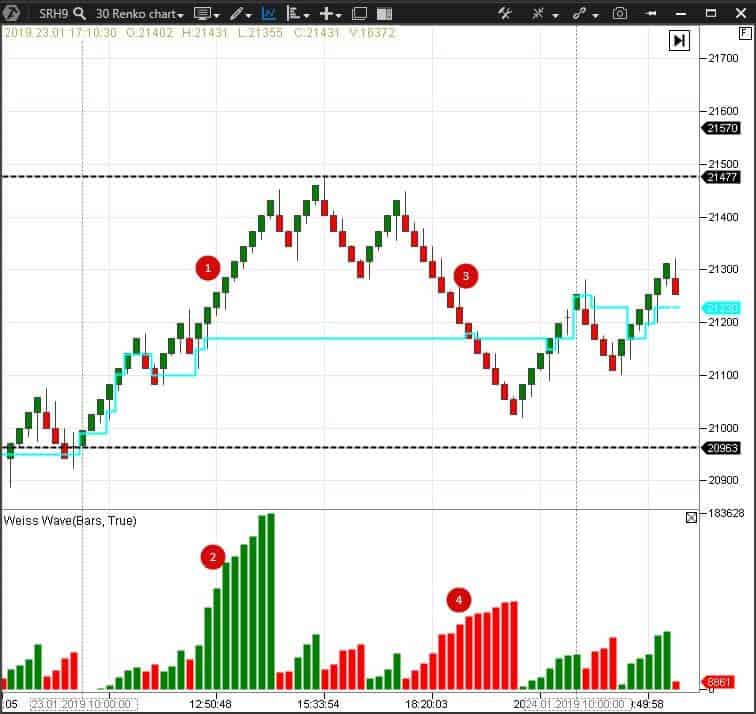
Example. Below you can see a renko chart (30) of a Savings Bank stock futures (SRH9).
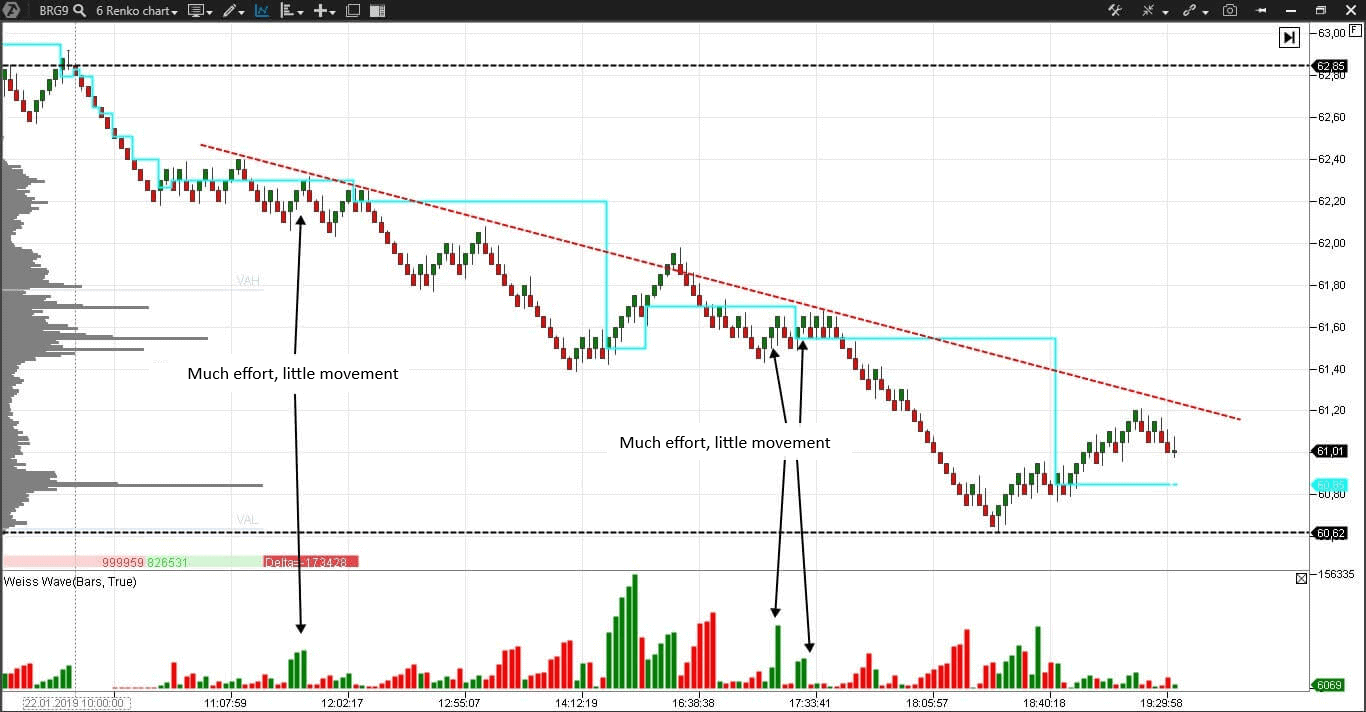
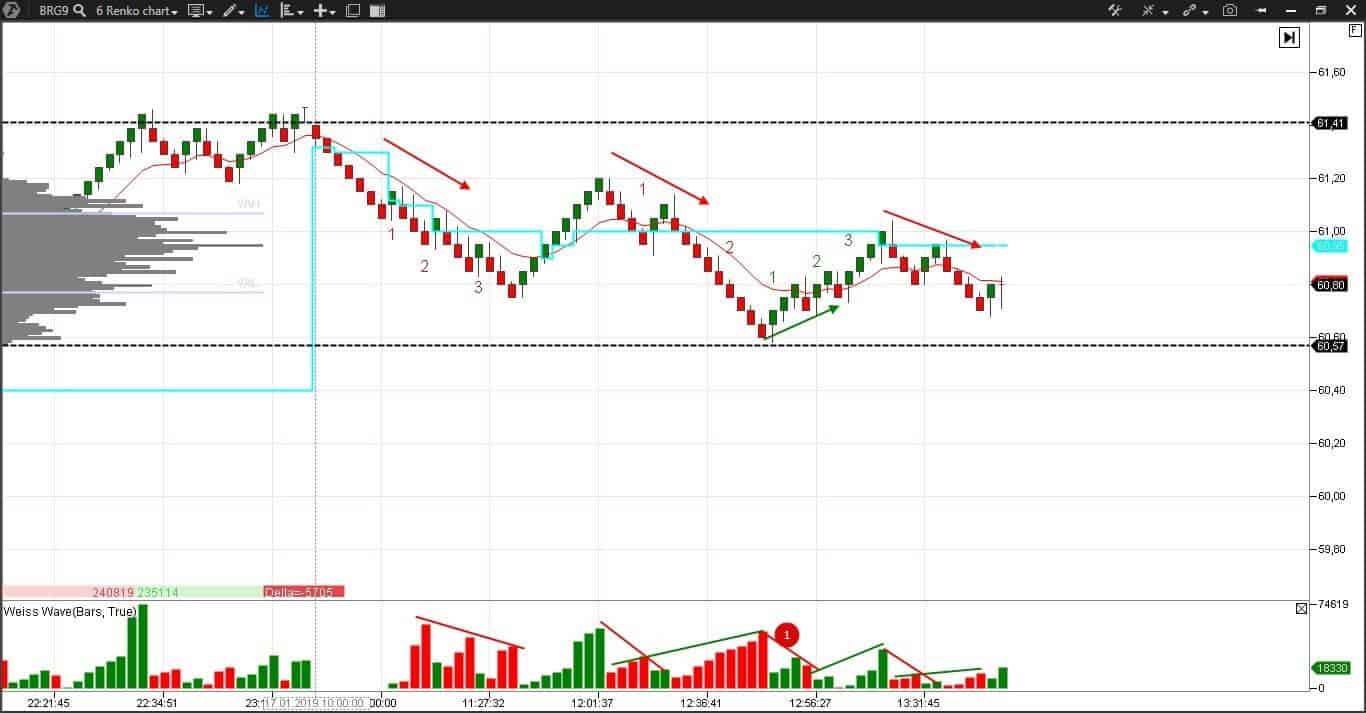
Further is an example of a strong effort (expressed in the Weis indicator) with insufficient reward (the price progress) in a renko chart (6) of the Brent oil futures (BRG9).
The wave charts clearly display the trend movement reversals.
An individual wave is measured by:
- length, that is a time characteristic;
- volume, that is an aggregate number of contracts traded in one direction;
- height, that is the achieved progress.
Having compared characteristics of each wave with respect to the previous or next one, an analyst receives information about the general state of the whole market.
You can also find a divergence in wave charts, which works, at significant levels, the same way as the divergence of MACD, Stochastic, and RSI indicators.
In what charts Weis Waves work better
David Weis experimented a lot with the Wyckoff point-and-figure charts. He was interested in two parameters:- how to select the reversal size;
- how to identify the accumulation line – the price balance area, which could become a starting point of focused movement.
Weis chose the renko and tick charts as the most appropriate for the wave analysis. Weis wrote that renko charts coincide with the original Wyckoff tape reading charts more than other charts, since they do not depend on time. “… renko charts offer peace of mind. They reduce the number of decisions”.
By the way, speaking about renko. Do not miss this article, which describes how to build and use Renko Charts.
Let us conduct a comparative analysis of various types of charts with an adjusted Weis Waves Indicator.
Below you can see 4 charts of a S&P 500 mini futures (ESH9).
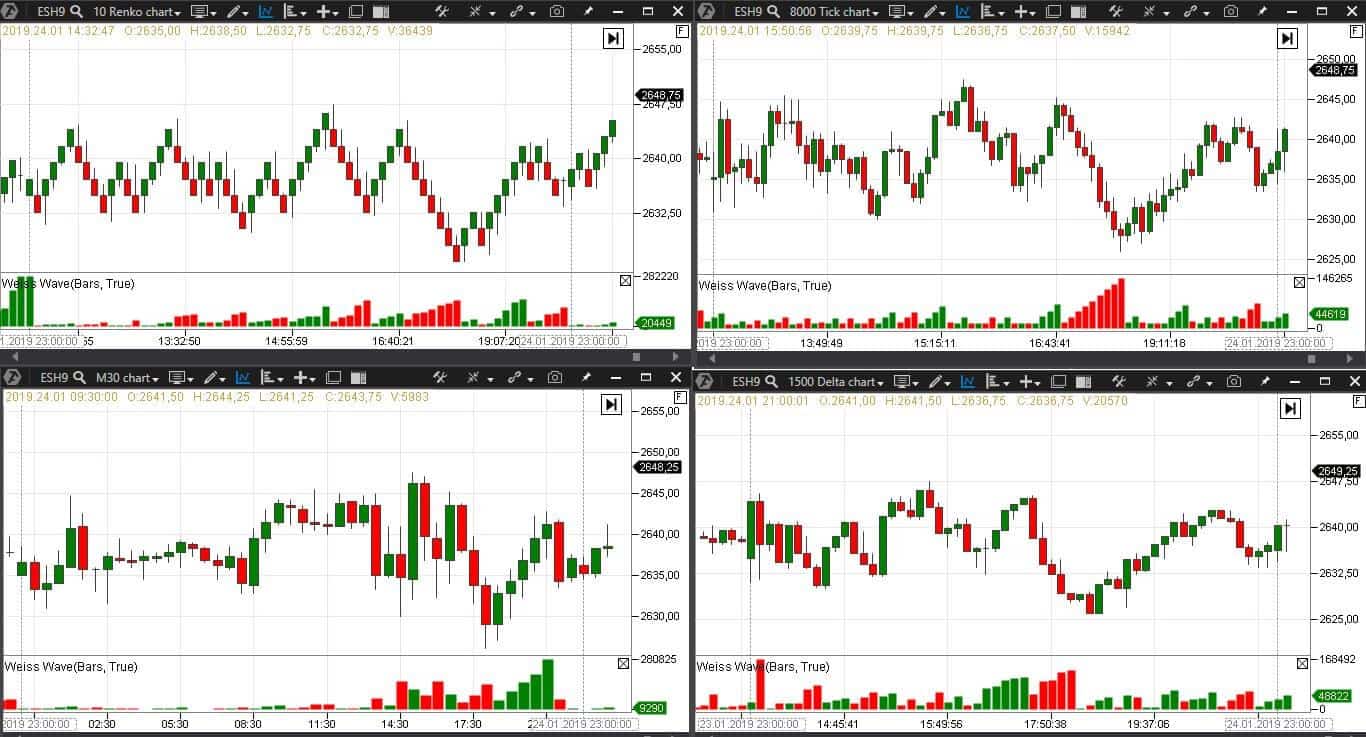
- Top left is a renko chart with the period of 10; waves are clearly seen. They could be measured by height and length;
- Bottom left is a 30-minute candlestick chart. Some waves are clearly seen, but there are periods of chaotic sequence of wave bars. It is difficult to understand what happens in the market in such periods;
- Top right is a tick chart with the 8000 period; the waves are seen nearly as clearly as in the renko chart;
- Bottom right is a Delta type chart with the 1500 period. This chart also shows a wave sequence, but not as clearly as renko and tick charts.
There were no Delta and cluster charts when Weis wrote his book. Perhaps, he would have enjoyed working with them. You can try to work with these charts right now.
How to analyze the market with the help of Weis Waves
There are the following intraday situations, which emerge when using the Weis Waves Indicator:- shortening of the thrust;
- consolidation;
- springs and upthrusts;
- correlation of effort and reward;
- ease of movement;
- reduction of waves;
- divergences.
Let us consider each of them in detail.
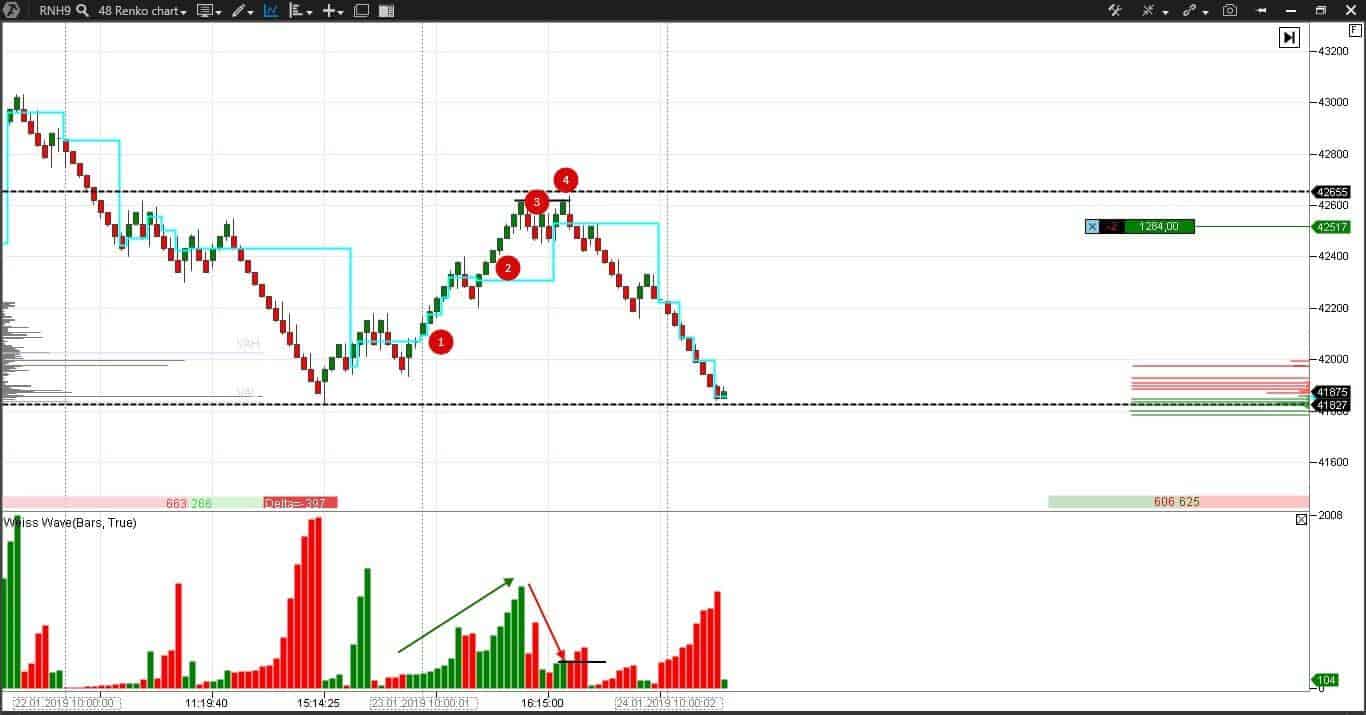
Shortening of the thrust. Reduction of waves and reduction of the price change is a sign of the current trend fatigue. An example of a real-life trade of the Rosneft stock futures (RNH9) in a renko chart (48)
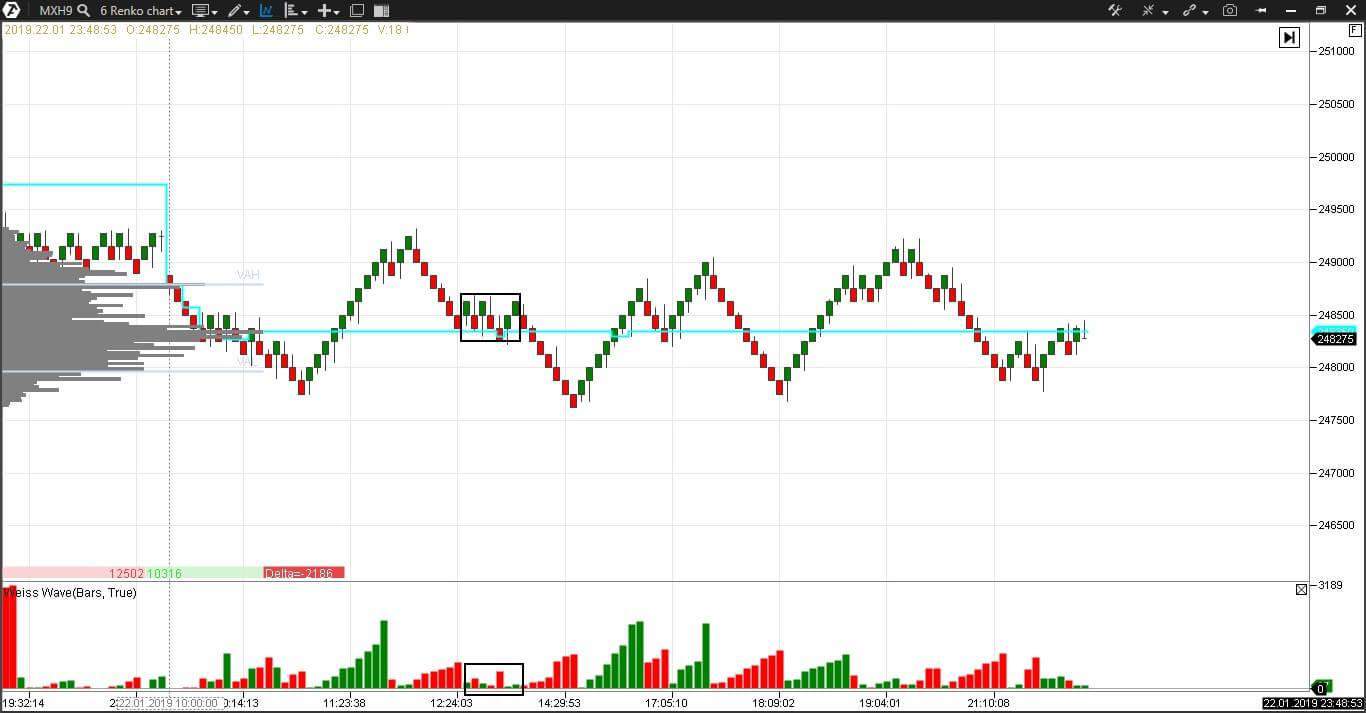
Example of a consolidation of a MICEX index futures (MXH9) is shown in the renko chart (6).
Springs and upthrusts. A spring points down and an upthrust points up. In fact, both forms are false breakouts of a local high or low, which often denote cunning market moves, directed at stop loss activation.
Example of a spring in the MICEX index futures (MXH9) renko chart (6).
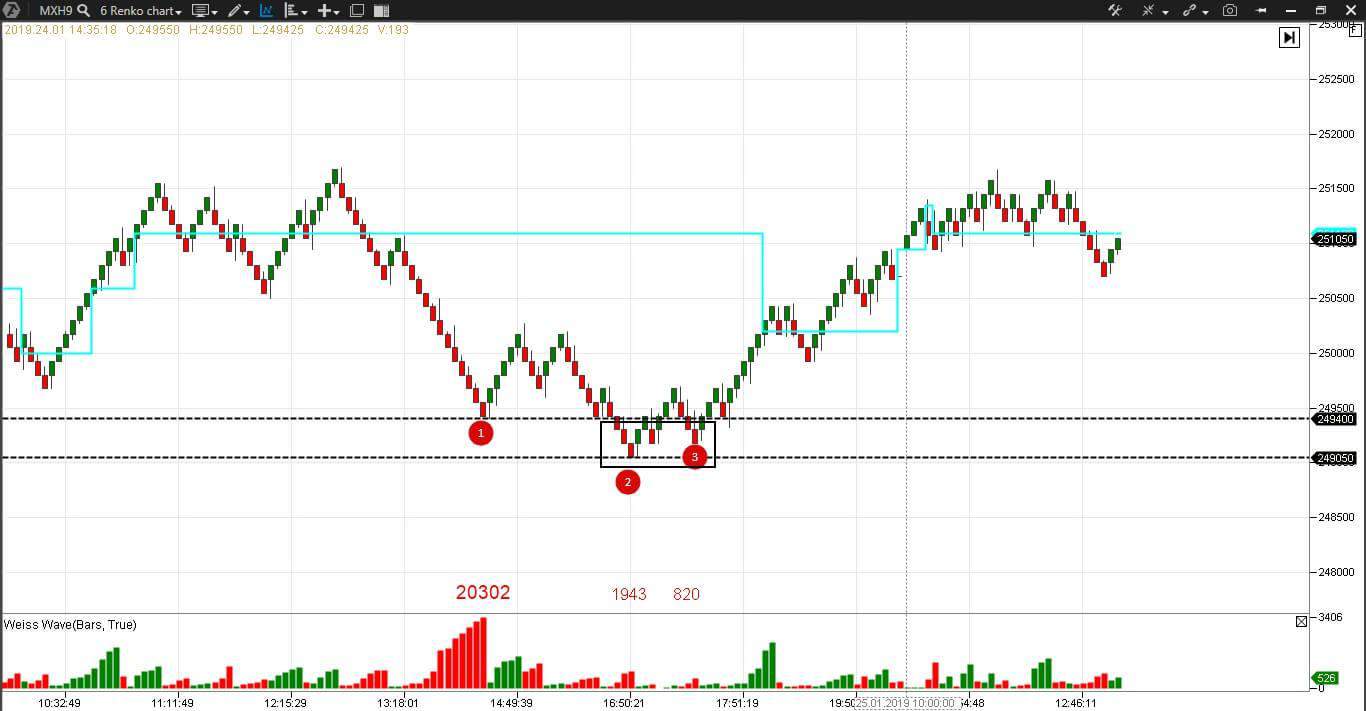
Perhaps, the following events took place:
- Intraday panic;
- Spring and activation of stop losses of those “hot” buyers, who took a risk to enter longs at the panic low;
- Decrease of the volume on a downward wave shows absence of interest in further decrease. The next upward wave gave rise to the “green volume” on the Weis Waves Indicator. This is a real demand.
Big effort and little reward.
If we assess the wave volume as a degree of effort and the price progress as a degree of reward, then the situations, under which a huge volume (effort) is accompanied with a small price change (reward), mean that the efforts were wasted.An example of a little reward against a big effort can be found above in a Brent oil futures chart (see Picture 3). You can find more information about the effort and reward law, for the first time applied by Wyckoff, in our first article from the VSA and cluster analysis series of articles.
Ease of movement.
David Wise describes ease of movement as a steady and smooth price growth against the background of increasing volumes. Ease of movement is a sign of strength of the current trend. The opening price in the candlestick charts in such cases is at the low and the closing price is at the high of the candle.An example of ease of movement was shown in the Savings Bank stock futures chart.
Reduction of waves.
Reduction of current waves in length and volume and growth of opposite waves between them warn about a forthcoming reversal.Example of a Brent oil futures (BRG9) in a renko chart (8).
Divergence.
The price makes a new high/low, but the wave does not make a new high/low. You should be careful with the divergence and look for other signs of its emergence. In fact, the divergence is a slowing down of a previous movement, but it takes time to stop it and change the trend. Divergence is marked on the first red wave in the picture above. The prices make a new low every time and the waves reduce, sending a signal about exhaustion of the impulse and probable change of a short-term movement.Breakout and test of a significant level.
Pullbacks and tests do not happen every time, sometimes the market can strongly go forward before the first correction is made. As a rule, there should be a smaller volume on a test. Example of a Nornickel stock futures in a renko chart (300).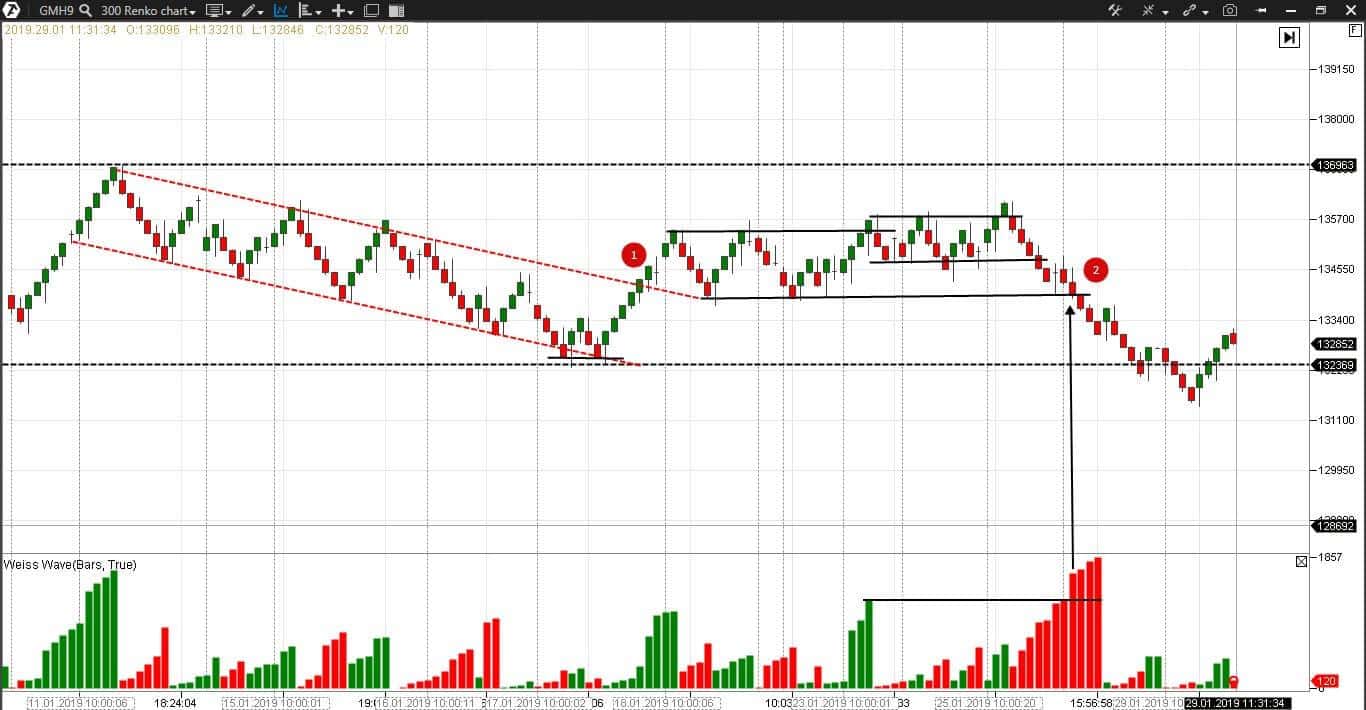
The price consolidated from point 1 to point 2. The sellers broke the consolidation area on an increased volume in point 2. The volume growth, which resulted in the breakout, is marked with an arrow. The chart does not show the fact of the breakout level testing in point 2, however, when approaching it, a trader has to focus on an emerging trading opportunity more attentively.
Trading recommendations from David Weis
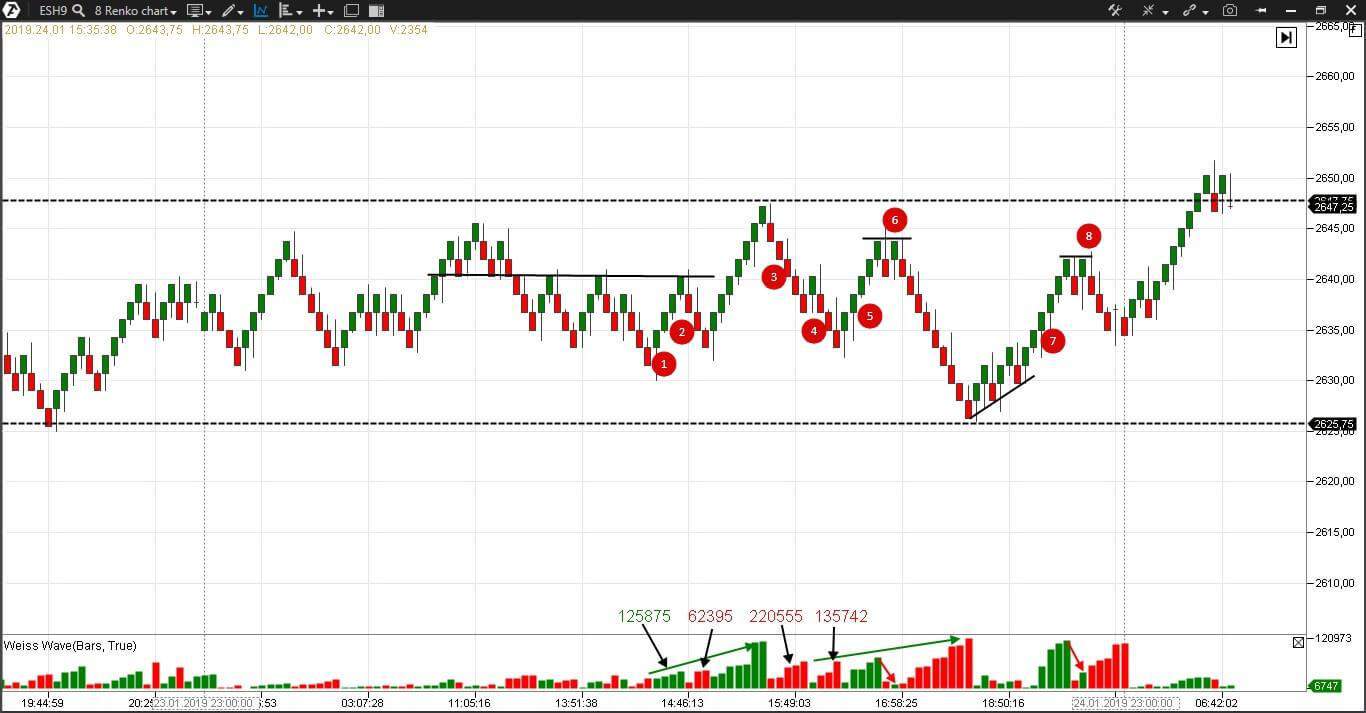
The following are trading recommendations given by David Weis in his book:Recommendation 1. After 3-4 up or down waves look for a shortening of the thrust in the final wave. The wave usually makes some progress and reduces, which testifies to the absence or loss of the impulse. Sometimes the wave volume is big, but the price movement is small, that is the reward is smaller than effort. This resembles the divergence. Example of a S&P 500 mini futures (ESH9) in a renko chart (8).
Example of a USD/RUB futures (SIH9) in a renko chart (30).
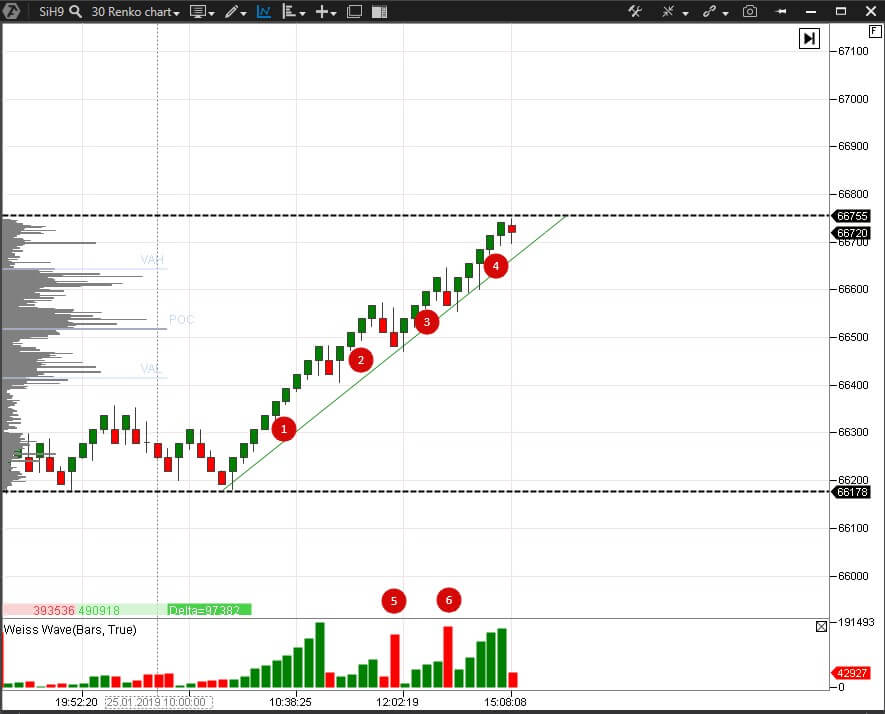
Recommendation 4. The shortening of the thrust is mainly determined by highs and lows of the price bars rather than by the waves’ turning points. The wave volume tells about the strength and weakness of demand and supply.
Recommendations for wave assessment
When assessing the wave characteristics, you should pay attention to:- the pullback size;
- the level until which the trend will last;
- the number of waves;
- the general context.
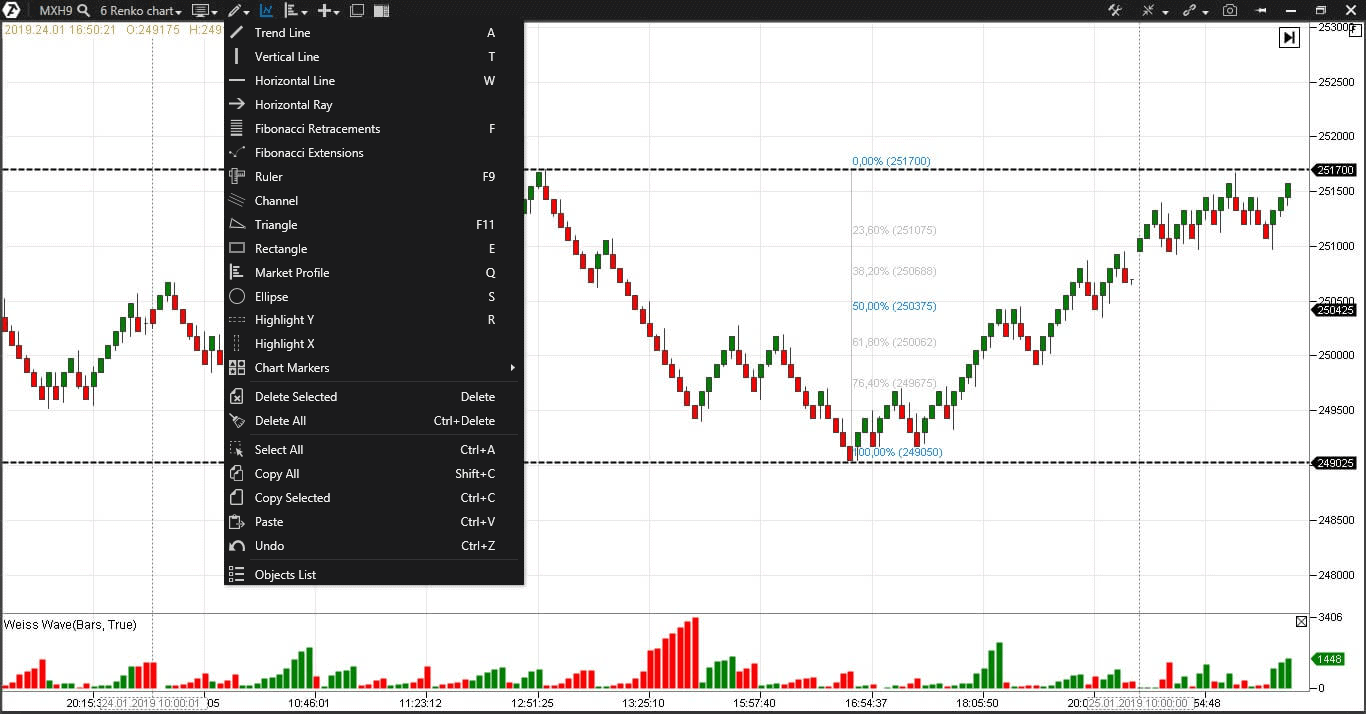
Assess the pullback size with the use of Fibonacci numbers. A pullback could be up to 50% of the previous movement. A movement of more than 50% is the previous trend change. Fibonacci considered 38,2%, 50%, and 61,8% to be significant figures. You do not need to measure anything in ATAS. The platform itself will show you these levels.
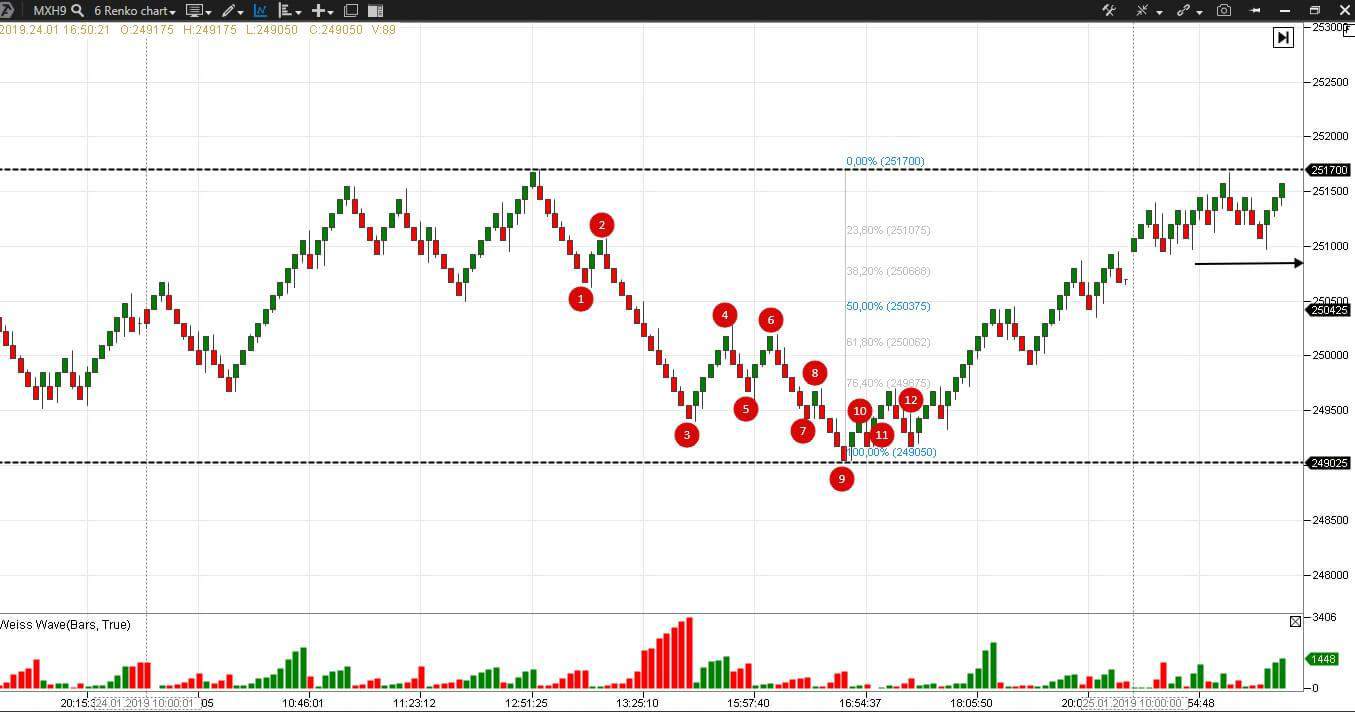
Forecast the target price
Using the number of waves and the size of a renko bar. Weis offers to count the number of waves until the extreme trough/peak, multiply the result by the cost of the renko bar and add to the low/high of a new movement.Example of a MICEX index futures (MXH9) in a renko chart (6).
Pay attention to the background.
An approximate number of preceding waves, required for analysis, is:- 3-4 for a range trading;
- more than 4 for a trend trading.
Develop an integral chart.
If we monitor waves one day after another, we get a better picture of their strength. Big sizes of renko bars work better for a positional trading. It is easier to hold positions during small corrections.Common trading methods with the use of Weis Waves
In general, the approaches to opening of trades with application of Weis Waves correspond with classical postulates. They are divided depending on the current market situation.Trading methods:
- in a trend market – we join the trend in the next bar after a new high/low. Waves can grow without a correction in the trend market. See an example in Picture 10;
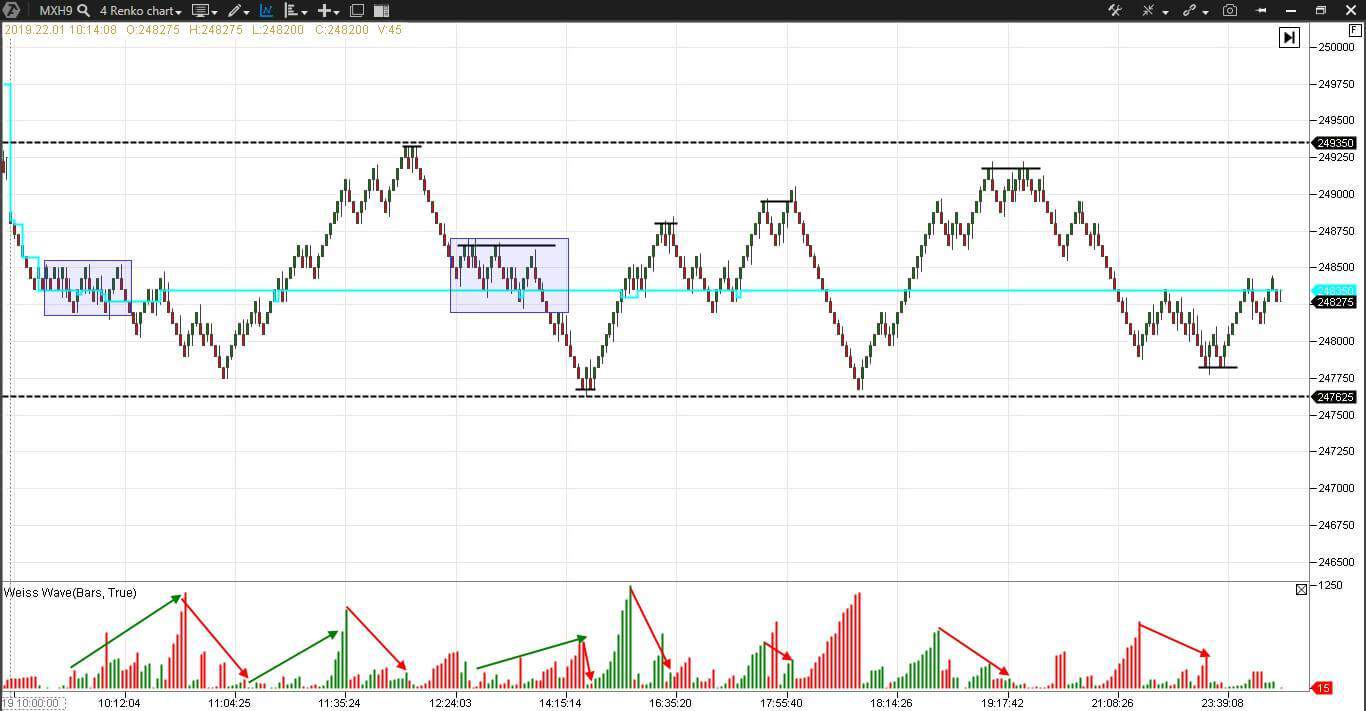
- in a range – we sell from the day high and buy from the day low at shortening of the thrust and wave divergence.
Example of a MICEX index (4) futures (MXH9) in a renko chart (4).
Advantages and disadvantages of the Weis Waves Indicator
Summary
“I call it a moment of recognition when you sense a move is about to happen. The realization sweeps you into taking action”. David H. Weis
The modern software provides unique indicators, which improve trading and market understanding. Conduct a series of experiments, watching the Weis Waves Indicator, which is among the ATAS platform functions, behavior. You will surely get ideas for increasing your efficiency.