Everything you need to know about Technical analysis
Are you interested in the technical analysis? Look no further than this article, which will be useful for you if you are a beginner who wants to learn what the technical analysis is. In this article we will:
- speak about the technical analysis history;
- learn about the basic technical indicators of the market;
- see how the technical analysis became the exchange plague;
- consider traps of the technical analysis;
- compare efficiency of the technical analysis with the footprint analysis (what the footprint is).
History of development of the technical analysis
The genesis of the technical analysis in the exchange business was in the 19th century. Namely then Charles Dow published a number of regularities in the Wall Street Journal, which could help to open trades on the exchange. Perhaps, all the modern traders know the methods of identification of trends on the basis of the simple Dow theory.
Each new theory was accepted with criticism and distrust with the development of the market technical analysis science. For example, the Dow theory was criticised because a signal for a trade came late, when the basic part of the movement had already passed. That is why the majority of traders on the American exchanges continued to use the fundamental analysis and considered it to be more efficient.
However, an economic crisis broke out in America in 1929. It made the fundamental analysis useless, since it was difficult to make an assumption about the growth of any security under conditions of the general recession. The majority of analysts became unemployed on the wave of the crisis and it stimulated development of new ideas by the technical analysis followers. The falling market became a source of new ideas for Elliott, Wyckoff, Gann and many other ‘technicians’.
There is a lot of literature on the technical analysis topic. We do not want to distinguish specific books. If you read one big book on the technical analysis, you will be able to digest 90% of information from other books, since the majority of issues are repeated – market history, indicators, instruments, fundamentals and basic principles.
If you still want to get specific recommendations, read the article about Trading books you must read.
Technical analysis is the exchange plague of the 21st century
The technical analysis instruments started to be implemented in computers, which appeared in the 1970s and which processed information faster than a human being. New methods were developed, which tuned out the market noise and looked for nonlinear dependencies in the price behaviour in the market. These methods included the Wilder Directional System, Williams Percent Range, Joseph Grenville OBV (On Balance Volume) and many others (we spoke about these financial indicators in the article about the market globalization).
There are several thousands of various technical indicators as of today – from generally known (such as trend lines, moving averages, MACD (Moving Average Convergence/Divergence), Stochastic Oscillator and Bollinger Bands) to little known or absolutely unknown.
A big number of available indicators is the result of the modern accessibility of mathematical calculations on the computer. The growing number of technical indicators (they appear every day) proves the statement that there is no ideal indicator which accurately predicts the price behaviour. It is connected with the fact that mathematical formulas can take into account only linear tendencies. But when it comes to unpredictable political decisions or chaos in the markets – mathematics fails.
Thus, we can say that the technical analysis can be applied only under ideal conditions, which, as we all know, do not exist in real life. However, despite all these shortcomings, the technical analysis indicators became ingrained in the lives of traders, especially those ones who use programming algorithms.
The majority of trading robots are developed on the basis of the technical analysis indicators. This created a competitive environment on exchanges. Just imagine that if the majority of trading algorithms are set for the search for the same regularities, the other part of algorithms may easily catch such robots in traps knowing beforehand where an algorithm would infuse its volume.
As of today, the exchange trading is actually a war of robots, which fight for profit on the basis of the technical analysis. It changed the markets so much that it becomes clear how traders of the past century managed to make fortunes so easily. A modern trader looks at the market of the past century like at the golden era of trading where everything, which doesn’t work today or works very poorly, worked properly.
Appearance of the volume analysis indicators
Analysis of the exchange volumes became possible due to the introduction of computers into trading. It was impossible to process such an amount of data manually before computers were invented that is why only the price chart was the main source of analysis.
The volume analysis was accessible at the end of the 20th century only for the ‘chosen ones’, who could afford to maintain servers with ‘big data’ (all exchange trades by each instrument) and pay for the transfer of the tick data flow.
Modern technologies became more accessible and practically every modern trader can afford to pay for the whole volume of information right down to the tick chart without leaving his or her house. The ATAS platform provides even a possibility to have a free access to the historical data.
Technical analysis and footprint signals
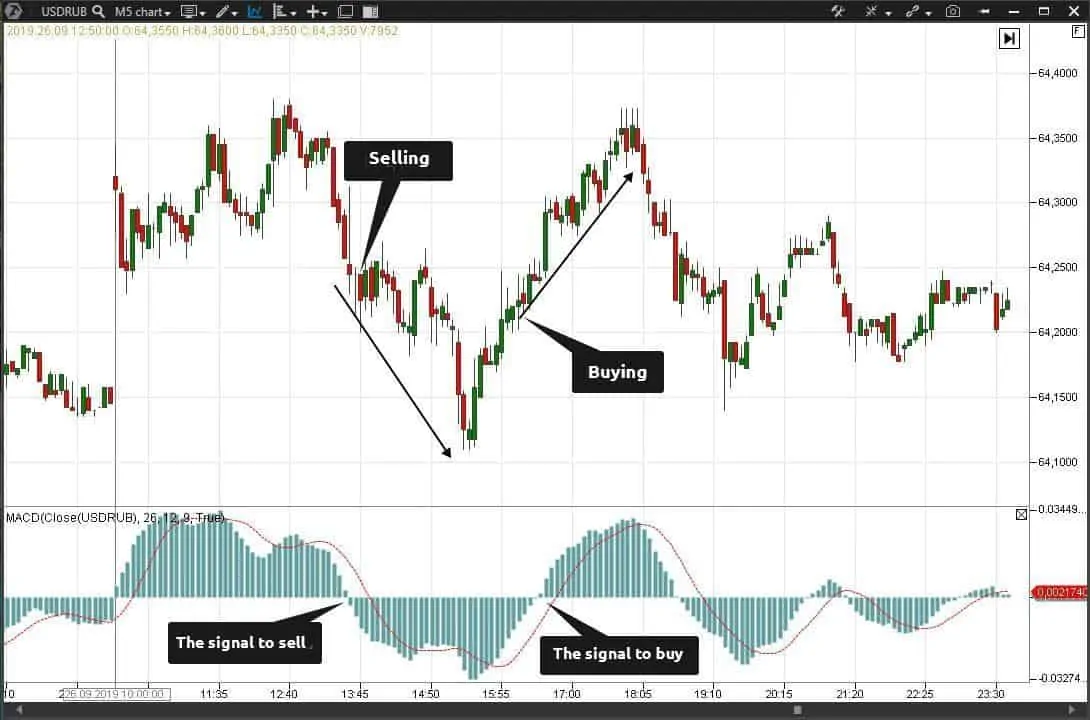
Let’s first consider the currency market technical analysis through the example of MACD (Moving Average Convergence/Divergence) indicator of the technical analysis.
Let’s consider the USD/RUB currency pair from the Moscow Exchange. The MACD indicator is used for checking the trend’s strength and direction and also identification of the reversal points:
- Situation favourable for buying occurs when a moving average with a smaller period (blue line in the picture) in the lower area crosses a moving average with a bigger period (red line) from bottom to top.
- Situation favourable for selling occurs when the moving average with a smaller period in the upper area crosses the moving average with a bigger period from top to bottom.
We will use MACD as a bar chart which shows a distance between the moving averages. If the bar chart passes the zero mark, it means that the moving averages intercrossed. The picture shows MACD indicator the long period of which is equal to 26 and the short one to 12.
As we can see, the MACD indicator signals come with a certain delay. We can see in the chart that the moment of the price reversal is not identified by the indicator. It happens because:
- the average price value is used for calculating the indicator;
- and it has to move in the opposite direction a bit for moving averages to intersect.
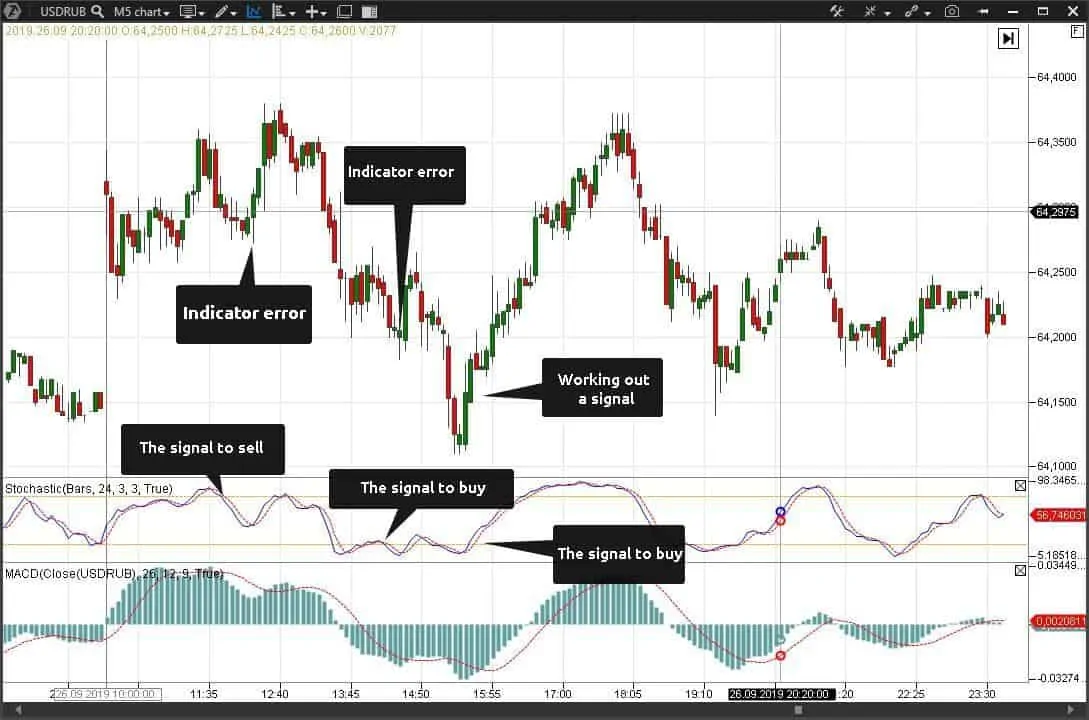
Let’s try to add the stochastic oscillator to the chart, which shows the current price position with respect to the price range for a certain period of time in the past. The indicator looks as follows:
Here we have two horizontal lines which mark 80% and 20% of the whole range. There are also two curved lines which move inside the whole range.
- The solid curved line is a fast stochastic,
- while the dashed line is an average value.
This indicator was developed by George Lane who believed that the price has a tendency to stop when it reaches the previous lows or highs. The stochastic signals are interpreted as follows:
- Situation favourable for buying occurs when the indicator lines first move below the level of 20% and then move above it.
- Situation favourable for selling occurs when the indicator lines first move above the level of 80% and then move below it.
You can check by yourself how many false signals will be sent by the stochastic indicator of the technical analysis before there will be a good signal.
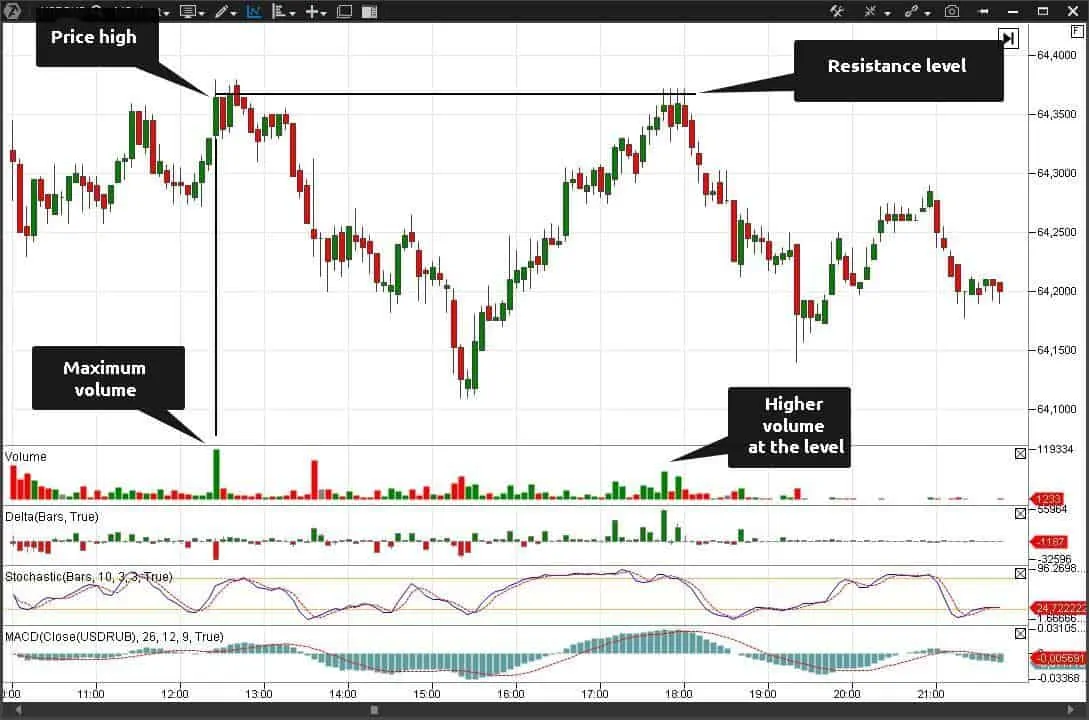
Let’s add the volume indicators, such as Volume and Delta, to our chart for our further discussion.
Now we have a bit more information. For example, there is the maximum volume in the point of the maximum price value. It tells us that this price level caused the maximum interest of the market participants.
As a rule, the price levels with a higher volume will further provoke appearance of high volumes. They would serve, most probably, as the support or resistance area (how to build support and resistance levels) when testing these levels. The area with a higher volume pushed the price down and further became a resistance in the example above.
Technical analysis and footprint signals
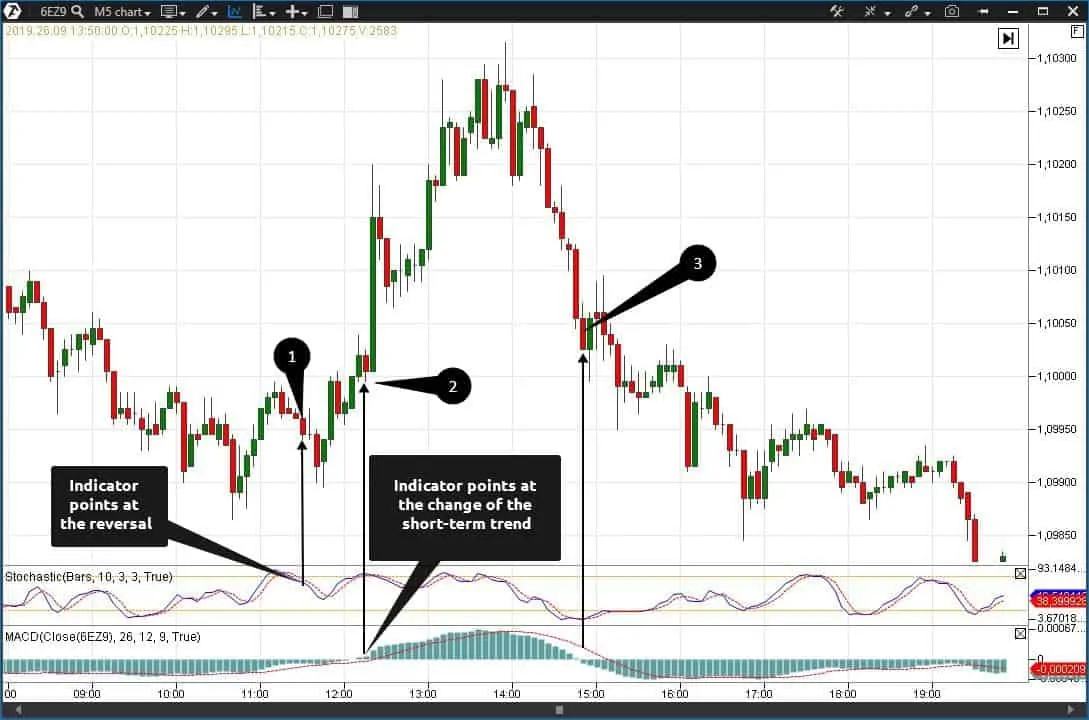
Let’s check now how stochastic and MACD indicators work through the example of the EUR/USD currency pair. Could it be that the technical indicators work properly in this case?
- Stochastic showed a possibility of a reversal in point 1. However, the signal was too late to take at least some movement. MACD was more accurate on a EUR/USD futures.
- The indicator showed the change of priority in point 2. Despite the fact that the signal was a bit late, the price still showed a good increase.
- MACD worked properly in point 3, although the signal itself was also a bit late. In general, not a bad performance for the technical analysis indicators.
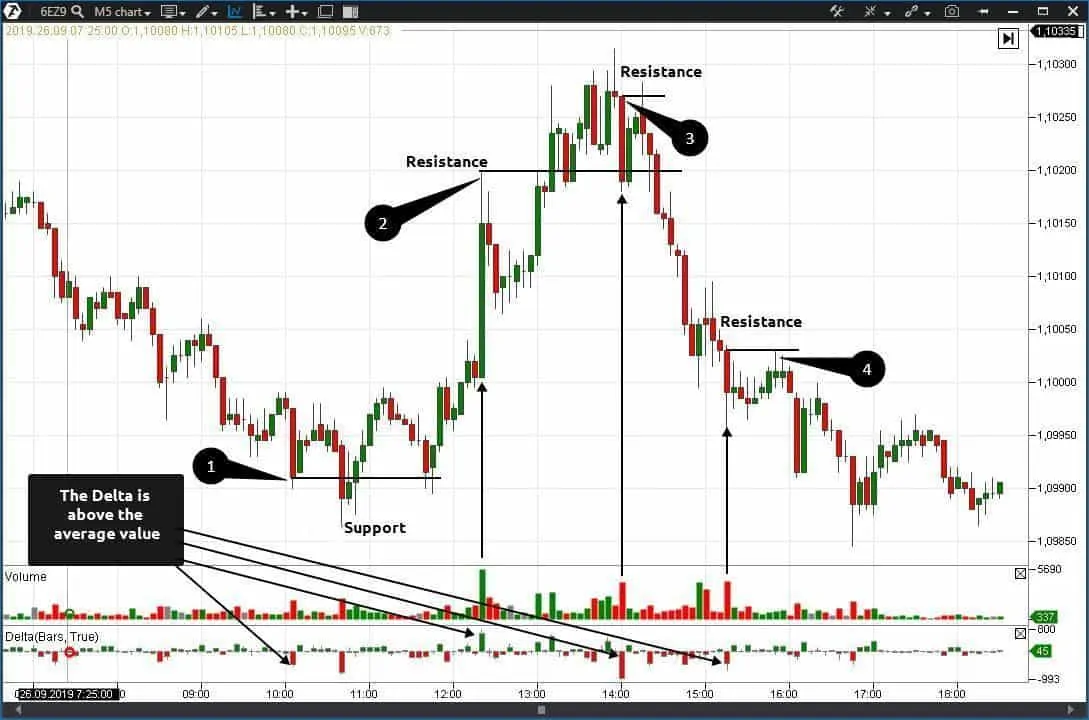
Let’s now check the same chart but with the Volume and Delta indicators.
At first sight, the picture is standard. But let’s monitor how the price behaves when the candles with a higher Delta are tested. Besides, the Delta direction is not that important. The most important thing is that the general volume should be higher than average. Let’s mark candles with such parameters in the chart (volume is above average and delta is above average).
- There is a splash of volume with negative delta in point 1. The candle is descending and the next candles lined up above the low of the reference candle. We draw the support line along its base. As we can see, the support worked out but with a small false breakout.
- The same conditions are in point 2. The only difference is that the candle is ascending, which means that we build the resistance line along the top of the candle. As we can see, the resistance was broken later and, most probably, a stop order will be activated there.
- We built resistance in point 3 which kept the price from growth pretty good.
- The same situation is in point 4: resistance keeps the price from growth and sends it down.
Shortcomings of the technical analysis indicators
Why traders make mistakes so often when they use the technical analysis indicators.
The matter is that the technical analysis indicators alone are not a guide to action. The price value passes through various formulas and you get some final number which cannot take into account specific features of the market, interests of major investors or political events. Of course, the volume analysis indicators also cannot take these things into account but they identify interest areas quite adequately.
Algorithm of making trading decisions
Application of the technical analysis indicators makes the algorithm of making trading decisions very simple. For example, intersection of moving averages with different periods is a signal for opening a trade. Simplicity and accessibility of this algorithm allows to programme this algorithm in a trading robot.
However, if everyone makes money who loses it?
Every trader should take into account the fact that trading is a fight of interests, in which one of the sides stands against the other side. This game has only one winner and a profit of one participant is always a loss of another participant.
A trader who analyzes the volume already takes this conflict of interests into account in his trading. Since namely the levels with maximum volumes are the places where the conflict of interests reaches its peak heights. That is why, such a trader will spend more time on hold and will open trades more rarely and only in the direction of the stronger side of the conflict.
Other volume analysis indicators
You can find more universal indicators in the ATAS platform apart from the classical volume ones (Volume and Delta). Here are some of them:
- Cluster Search – marks price areas in the chart by the set criteria. It is convenient for the search for horizontal levels;
- Big Trades – marks those price areas in the chart where big trades took place. It helps to identify a major market aggressor;
- Market Profile – reflects the volume or delta in the form of a horizontal bar chart;
- Stacked Imbalances – identifies those price areas where there is a significant predominance of buyers over sellers;
- Open Interest – shows how many positions of buyers and sellers are open in the forward market.
Conclusion
In this article, we wanted to show the difference between the technical and volume analysis indicators. The majority of technical indicators were developed at the beginning of the past century while the volume analysis for a long time was accessible only for the chosen.
It is clear that the decisions made on the basis of the classical indicators of technical analysis and volume indicators will be quite different. The technical analysis indicators may show a maximum number of entry points, but … How traders say, the less the trades are, the bigger the profit is. The most frequent trades are possible when a trader applies the scalping technique but it is also based, in the first place, on reading the Smart Tape and Smart DOM.
The technical analysis indicators are known to all, which means that someone more ‘special’ could know beforehand where ‘a crowd of technicians’ would open their positions and where their stop losses would be posted.
Namely that is why we recommend to use the technical analysis indicators as a supplemental recommendation while volume analysis indicators as a guide to action.
Did you like this article? Please, do not forget to press the like button.

