Support and resistance levels are, no doubt, the most frequently used concepts of the market analysis. Support and resistance are used both in the classical technical analysis and in progressive directions – analysis of clusters, deltas and profiles.
In this article, we will tell you not only about the classical side of application of the support and resistance levels but will also show methods of their building on the basis of the volume analysis.
Read in this article:
- Support and resistance levels in the classical technical analysis.
- Looking for trades near support and resistance.
- Indicators of looking for support and resistance.
- Round levels.
- Sloping support and resistance levels.
- Mirror levels. What they are and how they work.
- How to trade by the support and resistance levels. A scheme for building a strategy.
- Example. Entry into buys by mirror levels.
- Example. Entry into sells by mirror levels.
Support and resistance levels in the classical technical analysis
Support and resistance levels in the classical technical analysis are a part of the graphic pattern analysis. Traders use these concepts for designating price levels in the charts, which, as a rule, act as barriers which hamper the price movement in a certain direction.
Usually, the support and resistance levels are built from the price extreme points. Such an idea of level identification seems simple but as soon as you delve into charts you will, most probably, find out that the support and resistance levels can take different forms. There are many extreme points. Should we consider all of them as support and resistance levels? Subjectiveness will make its contribution and it will turn out that finding support and resistance is not as simple as it might seem.

The chart above (15-minute oil futures chart) shows the support and resistance levels:
- Resistance from the local extreme point of the previous day;
- Resistance in action – the price slowed down its growth and rolled back downward;
- A new level was formed at mark 3 after breakout of resistance 1-2;
- The support level at the local low during a day.
What are the support and resistance levels?
Support is the price level, at which you may expect a stop of a downtrend due to concentration of the demand. Consequently, resistance is the price level, at which you may expect a stop of growth due to concentration of the supply.
It is believed that the support/resistance line has the bigger value the bigger is a number of times the price failed to leave its limits.
What the demand and supply concentration at certain levels is caused by? There are many factors:
- fundamental – political and economic factors;
- actions of major players (how to identify actions of a major player in a footprint) – central banks, key funds and investors;
- technical – for example, activity of traders at breakouts of classical formations;
- psychological – the market psychology plays an important role since traders and investors remember the past and react to the changing conditions to foresee the future market movement;
- organizational – dates of expiration, cut-off and other factors;
- technological – algorithm activity.
All these components, in a combination, identify the demand and supply powers.
If several support (demand) and resistance (supply) lines coincide and are, practically, at the same level, they form areas of support and resistance.
Looking for trades near support and resistance
As soon as the lines or areas of support or resistance are identified, they provide valuable potential points of entry into or exit from trades.When the price reaches the support or resistance point, it acts in one of three ways:
- bounces from the support/resistance level;
- breaks the level and continues movement in its direction until it reaches the next significant level of support/resistance;
- makes a false breakout (a trap).
We wrote about these three setups in the article about trading strategies.
The fish are found around the edges of a lake – not in the middle. It’s the same with trades. Most of them occur along the edges of the trading ranges. David H. Weis
When the market approaches the support or resistance level, traders could place their stakes on further development of events and learn soon whether they were right. If a trader has an opinion and opens a position (places a stake), but the price moves in a wrong direction (the opinion was wrong), the position could be closed with a small loss. However, if the price moves in the right direction, the movement (profit) could be significant.
Example. In this example (the picture below shows a day Facebook stock chart) we built the support line from the low in point 1.
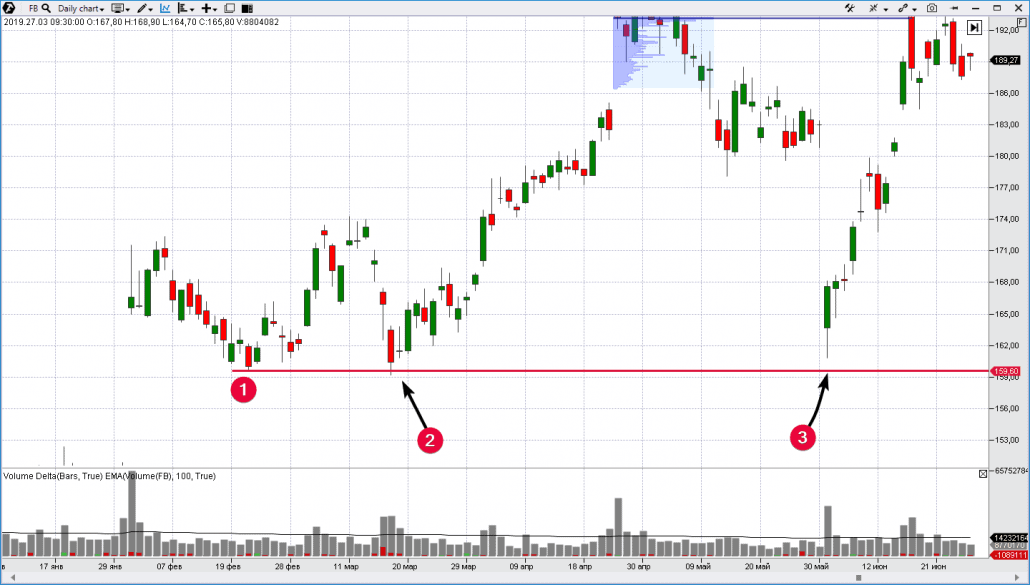
This support level (1) reversed the price upward twice. There was a penetration through the support level in point 2 (overshot) and there was no touch in point 3 (undershot).
We showed an example of how to find the support level (it also works for resistance) building just a horizontal line from an extreme point. If the price formed an extreme point, it means that it already reversed from the level once. It’s quite possible that it would happen again. Such a simple but quite rational logic is clear to the majority of traders, who easily notice extreme points in a chart. But there are still such support and resistance levels, which are not seen by the majority of market participants.
Quite recently we wrote about how to find the support and resistance levels with the help of the Market Profile indicator.
Let’s see how to find the resistance level with the help of the profile in the same Facebook stock market.
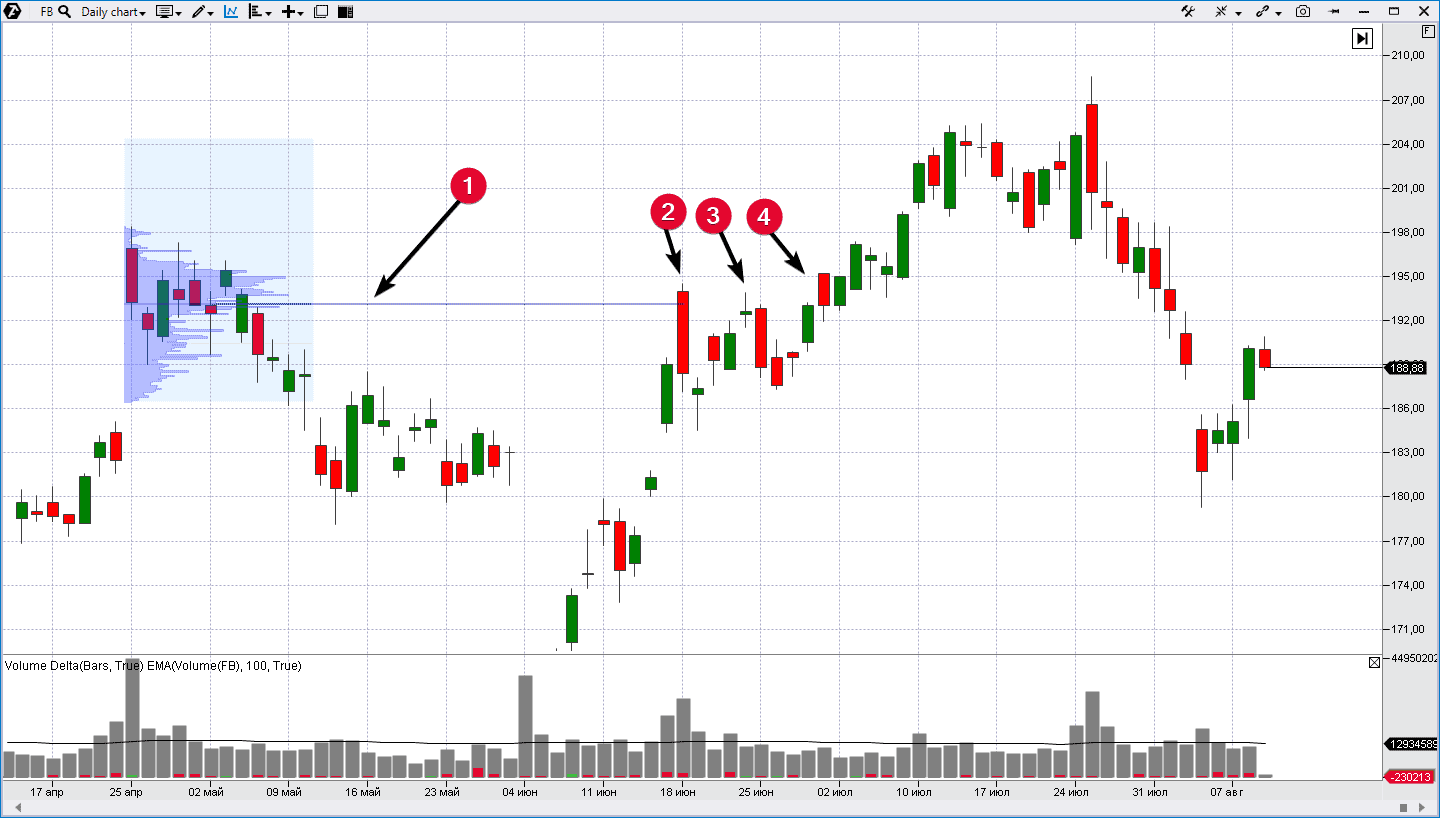
You can see in the picture how the level of the highest volume (1) in the profile serves as resistance for further growth in points 2 and 3. Resistance as if creates the ceiling in the space where the price moves. A breakout started in point 4.
Indicators of looking for support and resistance
However, the Market Profile is not the only variant. Horizontal support and resistance levels could also be found with the help of the following indicators:
- Stacked Imbalance, Big Trades and Speed of Tape;
- Maximum Levels and Dynamic Levels;
- DOM Levels;
- Margin Levels;
- you can also watch our video about looking for the support and resistance levels.
All the above links lead to the articles, which describe methods of looking for support and resistance levels with the help of the volume analysis indicators. Use professional interests to look for the price reversals in those points, where only a few may expect them.
Whether we can use Moving Averages (MA)
The concept of support and resistance from the Moving Average is used in the classical technical analysis. This idea is often discussed both in traders’ forums and serious resources. Here, for example, is a chart from Investopedia.

The chart shows how the Moving Average (15) offers support and resistance in a trend market. Is this effect an illusion or the company stock value really depends on the Moving Average? Every trader makes own decision.
We believe that the support and resistance from Moving Averages is a special case of a multitude of market situations. It emerges because Moving Averages have a ‘lagging nature’. And an impression is produced that MA curves in the chart serve as support and resistance. It takes place under 2 conditions:
- when the market is in a trend (the price ‘runs away’ from the average value and the line runs for it – and it looks like support/resistance);
- when a period of the Moving Average was selected properly.
If the market goes into a flat, whatever period you select, the price will not bounce from the MA. It makes more sense to use Fibonacci retracement levels for building supports and resistances.
You’d better pay attention to the ATAS trading platform. It provides a wide set of instruments for looking for real levels. Download the test version of the platform right now and we will look at the support and resistance levels at a different angle.
Round levels
The asset value may have difficulties with moving outside the round level of the price – for example, USD 100. The majority of traders, as a rule, buy or sell assets when the price is a round number, because they feel that, with a high level of probability, the stock (futures and currencies) are fairly priced at these levels. The majority of take profits and stop orders, posted both by retail investors and major investment banks, are posted at round levels of the price and not at such prices as USD 103.31.
Since many orders are accumulated at one level, these round numbers serve as strong price barriers. Just open the Depth of Market indicator in ATAS and check any market. You will see that more orders are posted at round levels. This fact cannot be denied.
Read in this article in more detail how and why round numbers create the support and resistance levels.
Sloping support and resistance levels
The above examples show how horizontal levels hamper continuation of the price upward and downward movement. However, markets are a complex multilayered structure. And while, during the day, an active trend develops ‘on minutes’, the day trend may show that the market is in a flat. Periods influence each other and the price barriers (support and resistance) change in time.
That is why it is important to understand the trend concepts when you study support and resistance.
For example, if the traders who trade stock by day charts feel panic fear and want to sell while the price rushes down, the more long-term investors, whose market view is formed with weekly candles, wait for a moment to buy near a long-term support line.
Look how quite recently the AMZN stock price several times bounced in both directions from the uptrend lines, which were formed several years ago.
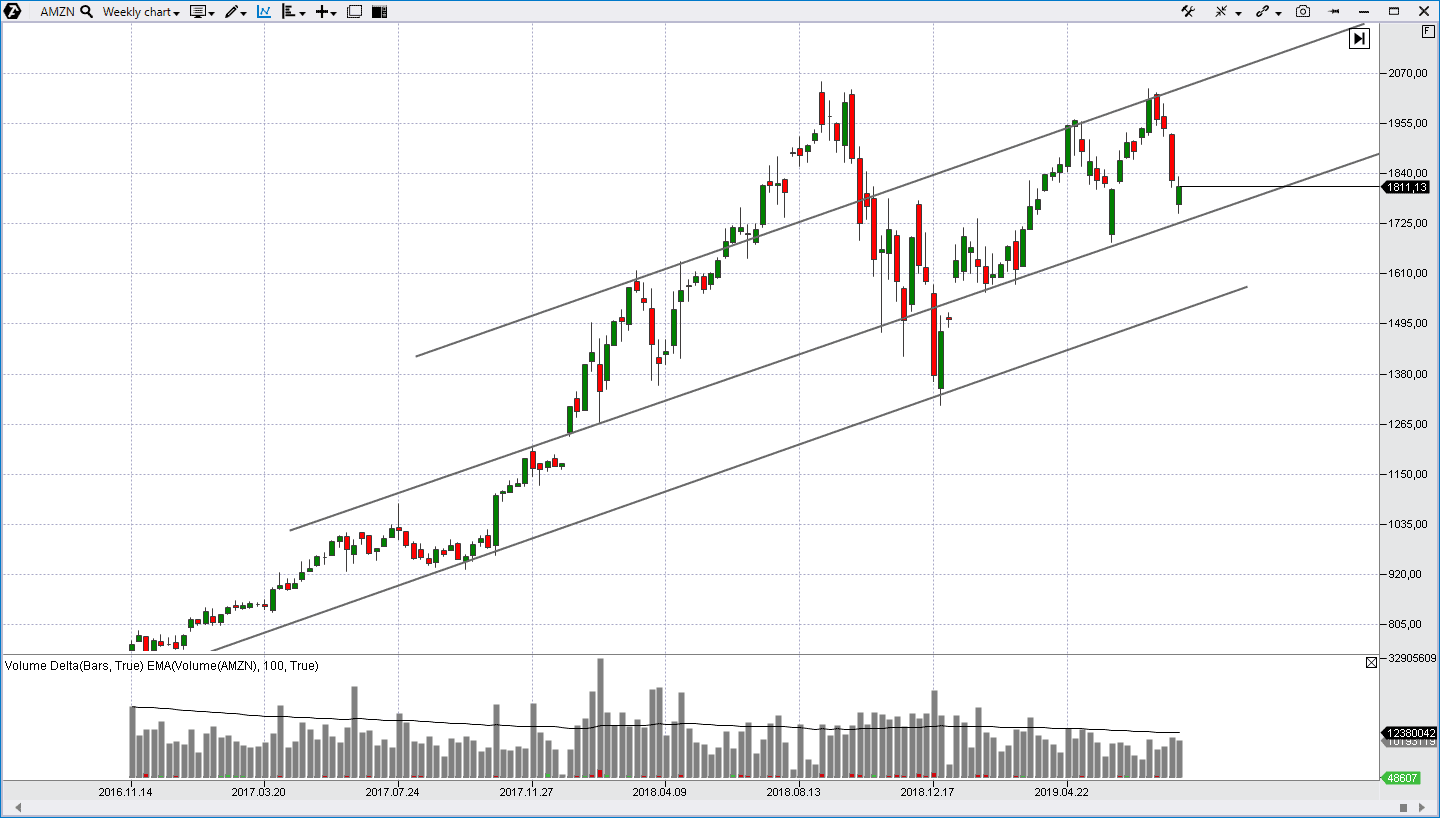
Thus, investors will pay more attention to the paper price when it falls towards the super-important support of the trend line, because this is a historically proven value, caused by fundamental factors, which reduce the probability of further decrease of the asset value to the minimum.
An important factor of the growing trend in the market of many stocks is caused by the fact that the USD value reduces in time. Earlier, the grass was greener and 100 green presidents had a higher purchasing capacity.
However, not all markets grow. Traders will observe a series of descending peaks if an asset has a tendency to reduce. Perhaps, they would want to connect these peaks together to build a trend line and find profitable opportunities for entering into a short.
Example. Let’s consider a situation in the gold futures market.
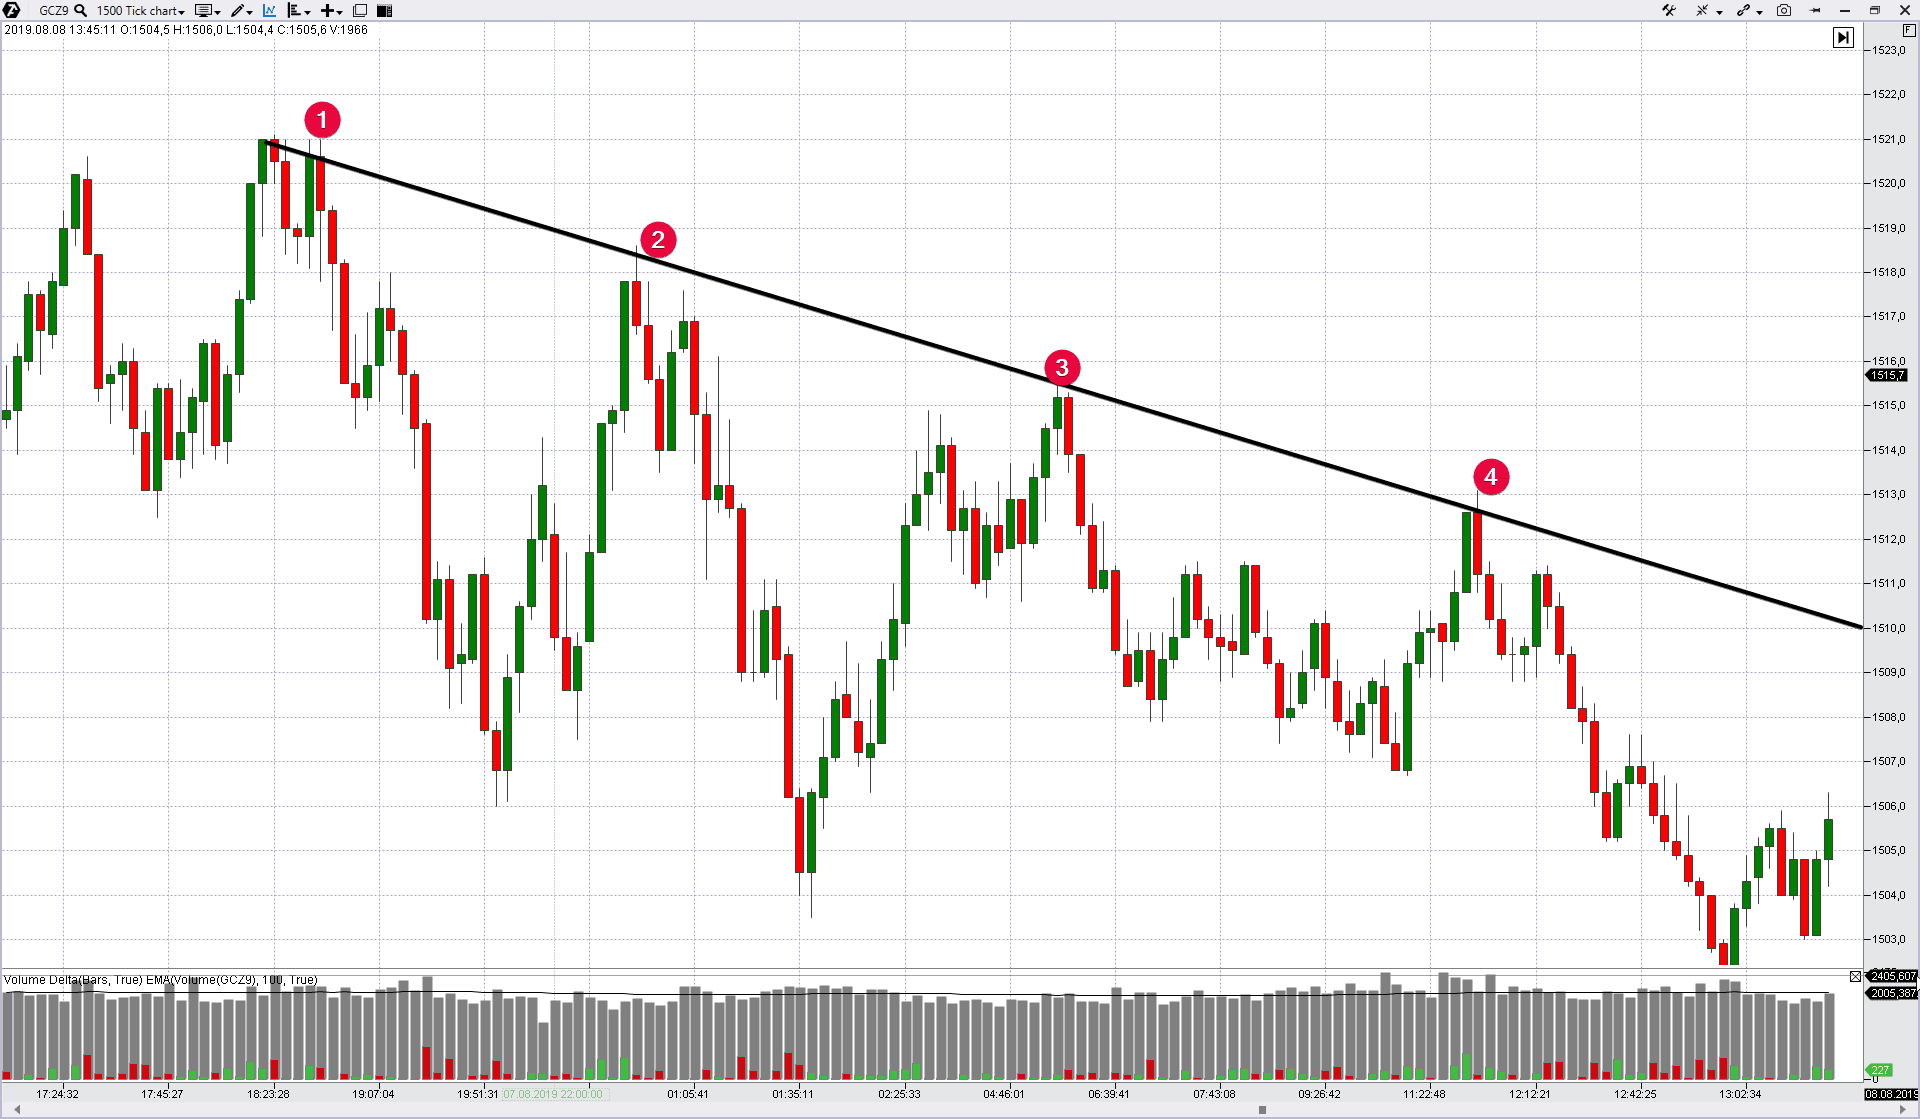
Note that this a tick (1,500) chart and the period is not connected with time. Application of the nonstandard types of charts allows market assessment at a different angle and the resistance and support lines could become more obvious.
In this case, the resistance line is built as a beam, which starts in point 1 and passes through point 2. When the price approached this beam it reversed downward twice (points 3 and 4). That is why when the price approaches the resistance level in the descending market, traders are inclined to expect that the asset will face selling pressure and may consider the possibility of entering into a short position, because this is the line which previously pushed the price down.
Don’t miss our article about the points of entry into a market, where we discussed methods of entry from the support and resistance near the trend channel lines.
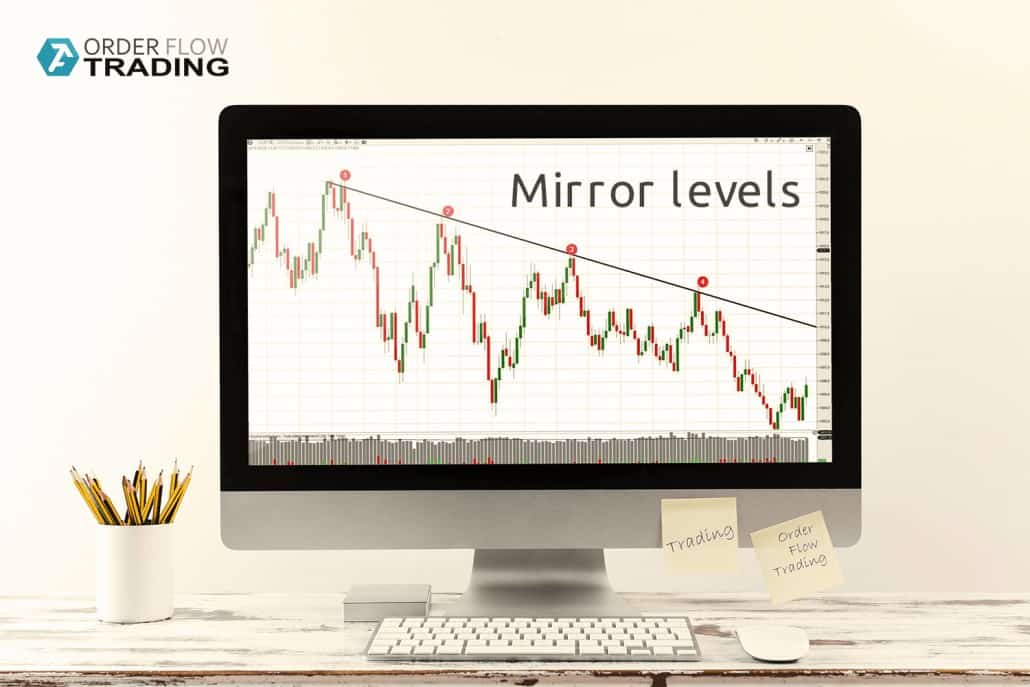
Mirror levels
What are mirror levels in trading? The principle is simple. As soon as the resistance level is broken, it becomes a mirror one and works as the support. On the other hand, this level becomes a mirror one and works as resistance when the support is broken.
Look at the very first chart in this article. We showed a breakout of the resistance level there. Look what happened soon within the same trading session.
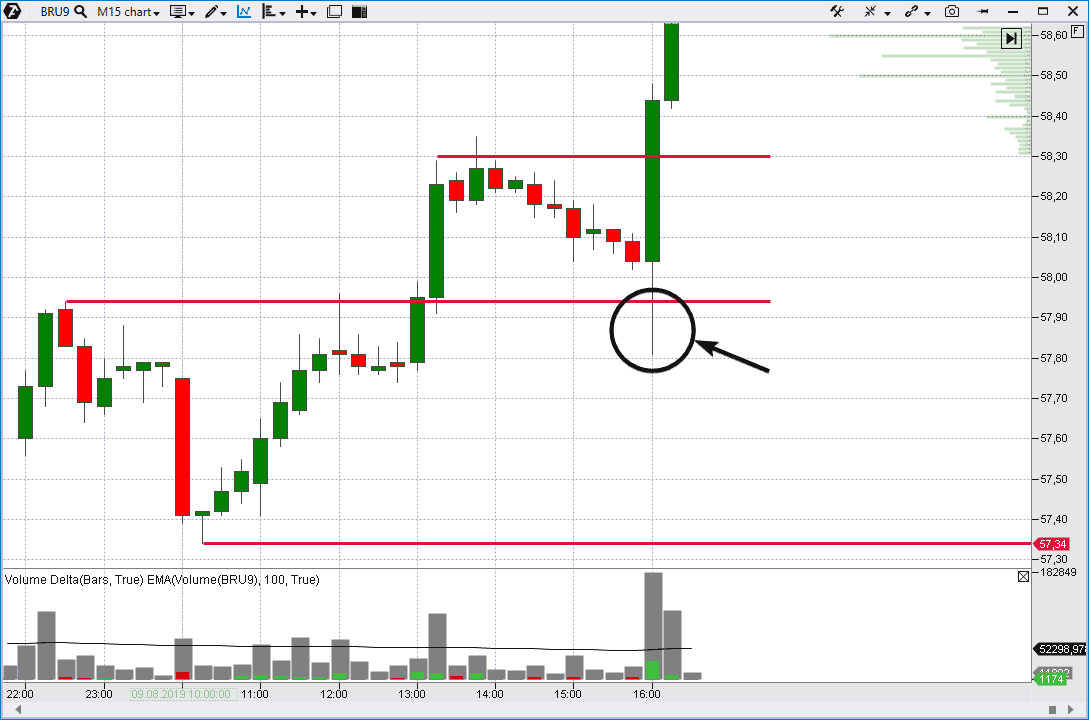
The former resistance acted as support, pushing the price upward, in 3 hours after the breakout.
The opposite works the same way – the former support offers resistance to the price growth. Example – a tick (1,500) chart of a Nasdaq index futures.
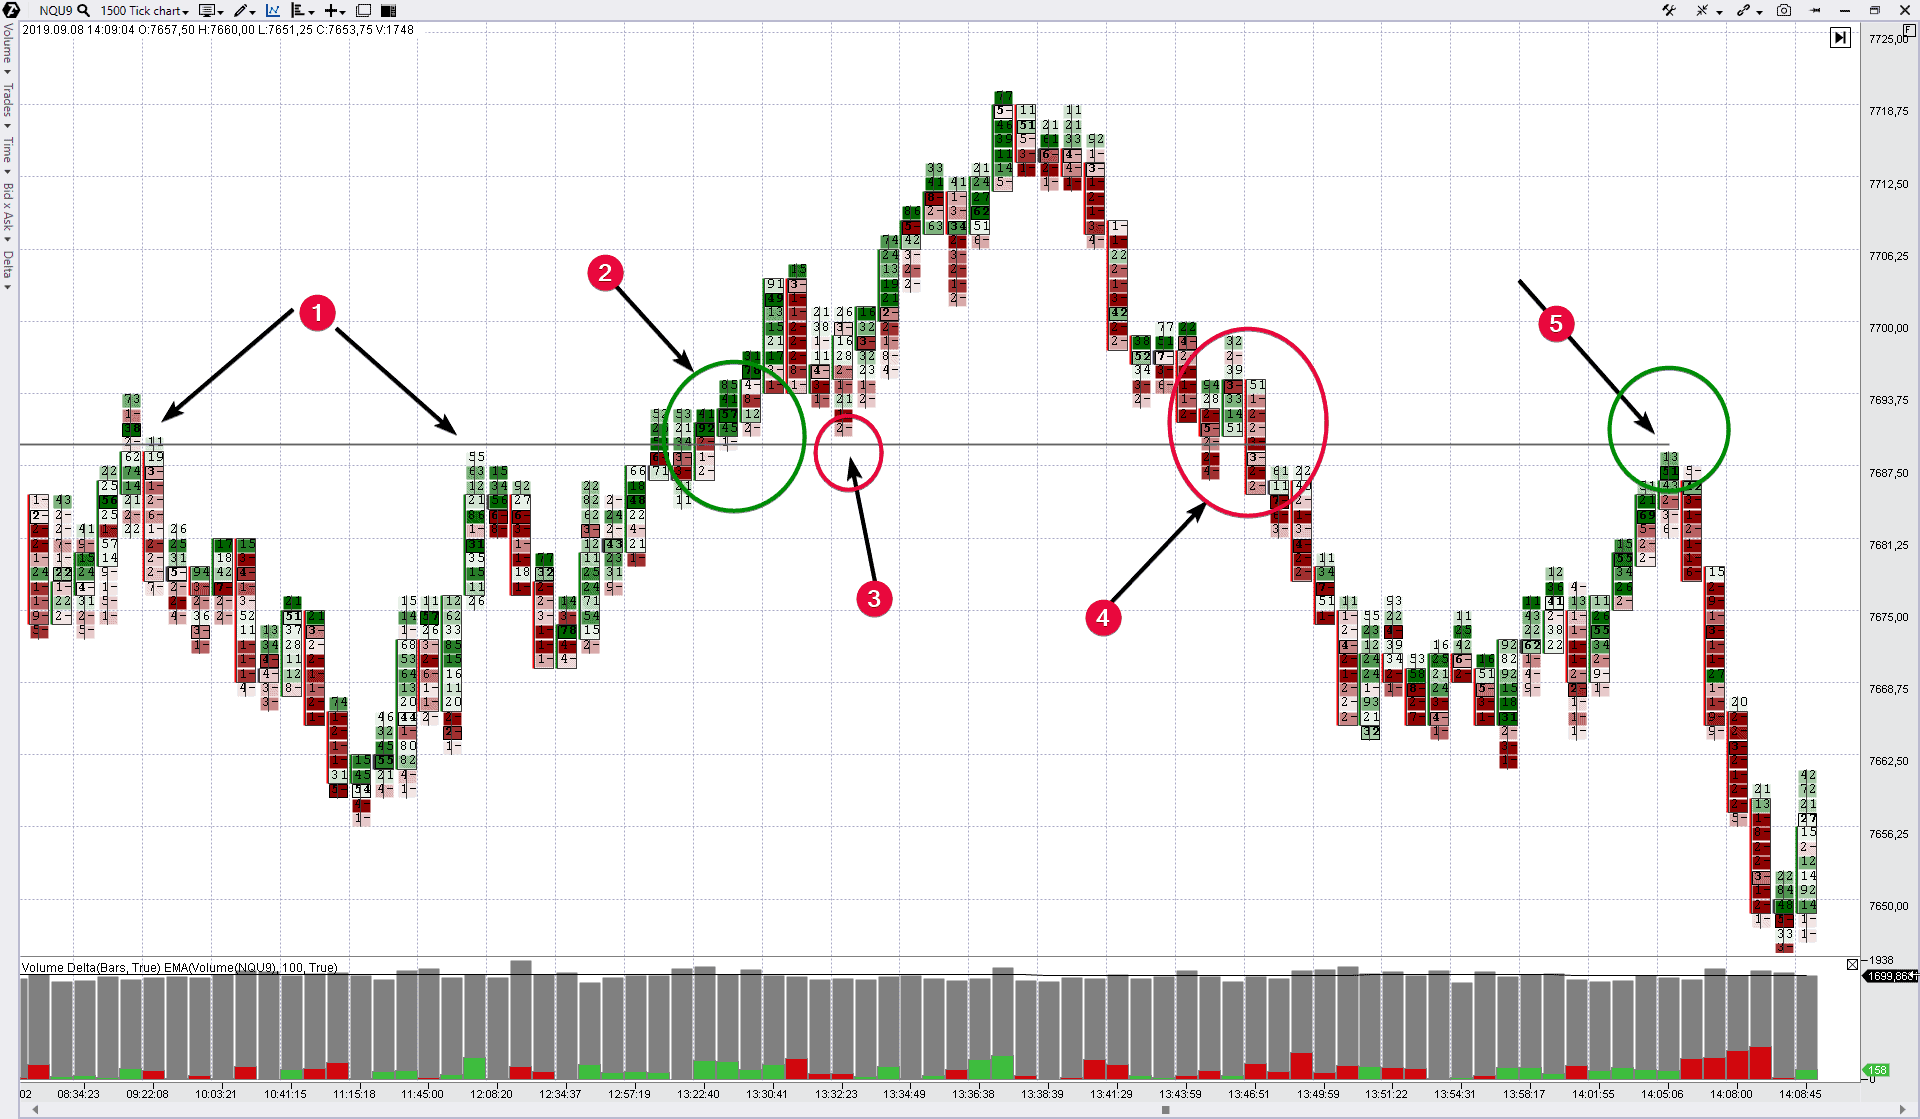
- First, the level of 7,690 worked as resistance;
- Then there was a breakout at a positive delta – green clusters tell us about predominance of buyers (we will discuss the delta value later);
- A breakout test at a negative delta. The level of 7,690 works as support now.
- A bearish breakout of the support with a negative delta.
- A breakout test. Mirror effect – the former support become resistance again.
Why mirror levels work?
The concept of mirror levels is practically constantly mentioned in the literature for beginner traders. It is well-known and is not put in question.
However, the issue of the cause of this phenomenon is not explained (if you have versions, share them in the comments, please).
Indeed, why does the resistance level work as support when it is broken? And why does the support work as resistance when it is broken?
Let’s reason for a while without pretending we know the truth. It is very important here to select the starting point for a logical chain. Let’s use the words of Bernard Baruch as the basic principle:
The main purpose of the stock market is to make fools of as many men as possible.
Consequently, if the market bounces up from the former resistance (a test of a bullish breakout), it means that someone was made a fool. Thereby, the market achieves its main purpose. If we understand who and how was made a fool, it will explain to us the nature of emergence of mirror levels (breakout tests).
Let’s consider an oil futures price chart; the data is from the Moscow Exchange; 15-minute period.
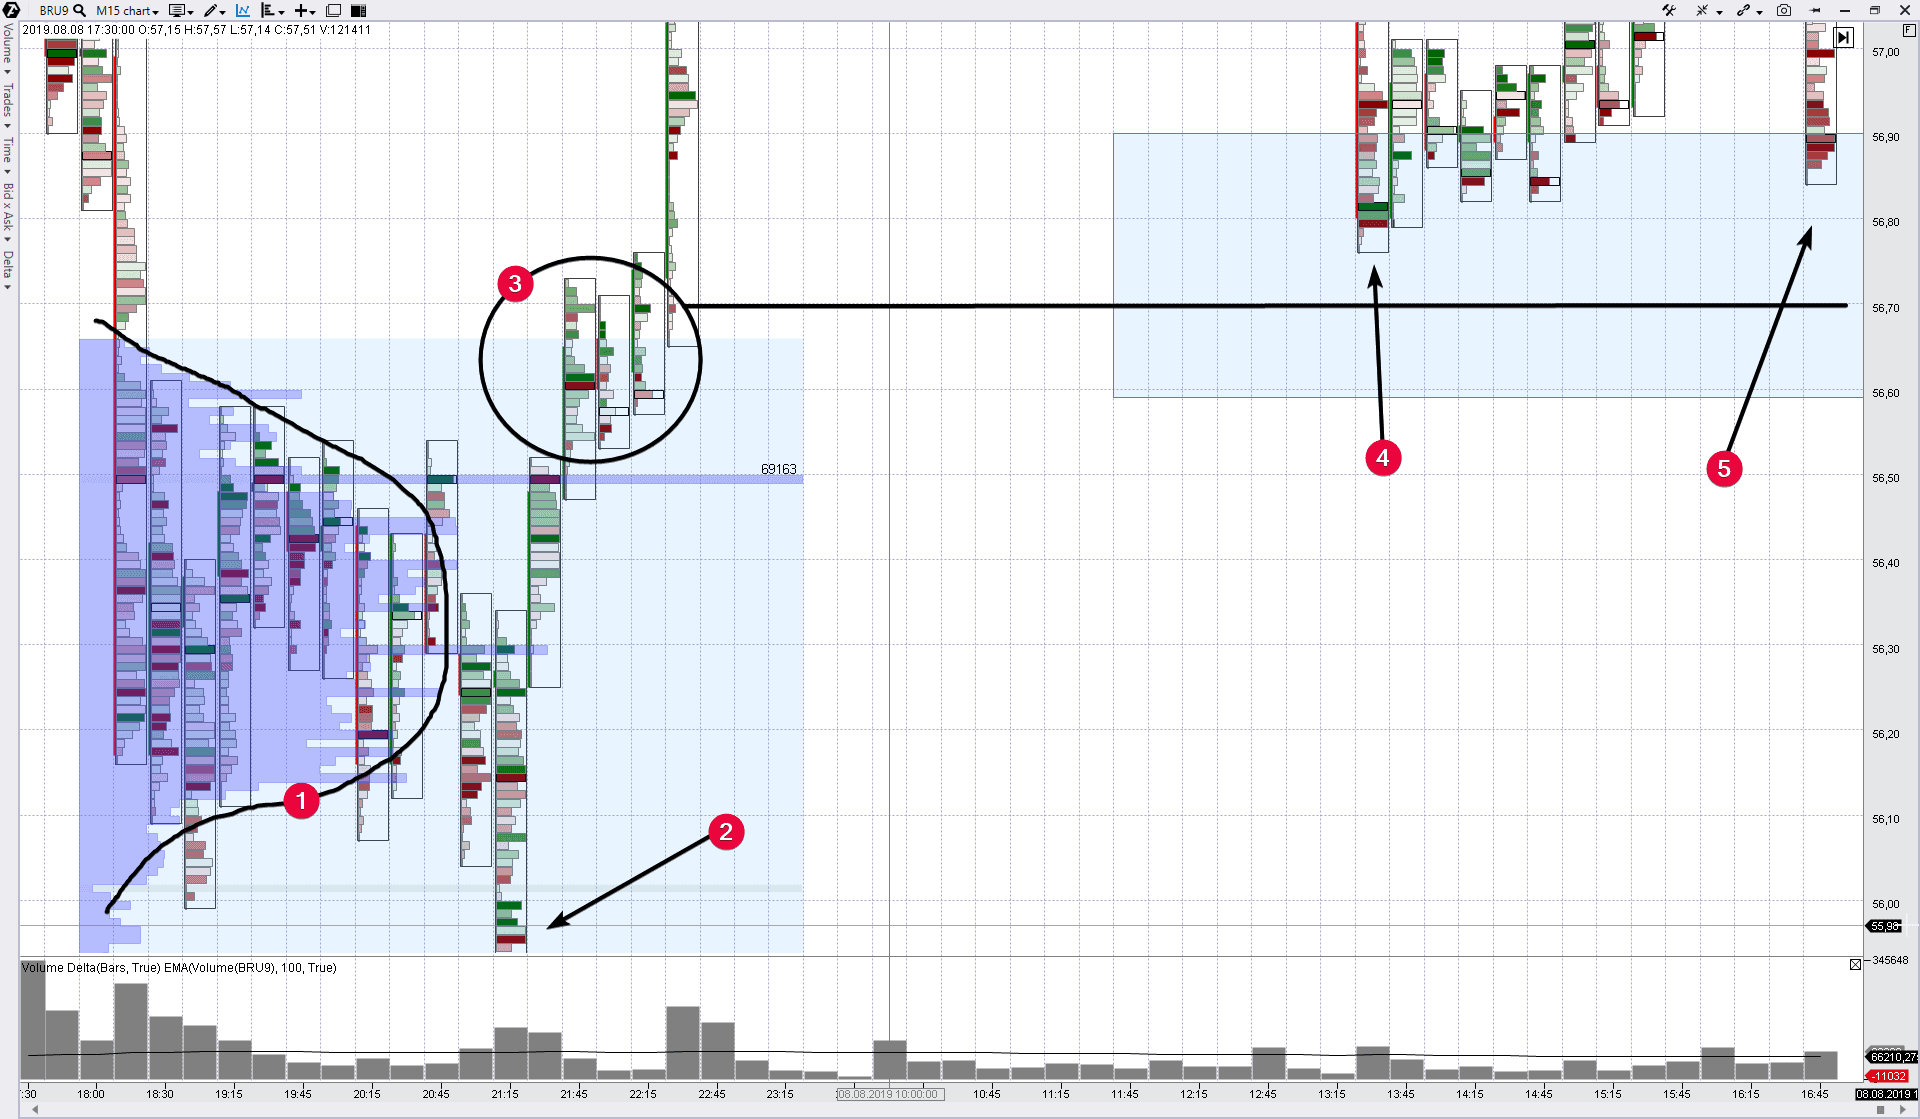
We marked the following in the chart:
- Short-term balance (auction) with formation of a curve in the form of a bell on the profile indicator. The upper boundaries of the profile is the resistance level.
- A trap (false breakout) in the descending direction before a true breakout in the ascending direction.
- Breakout. Note that the clusters are green and the delta is positive. This is an effort of buyers at the resistance breakout.
- The price approached the breakout level of 56.70 the next day and bounced, jumping upward. Breakout test.
- Local shakeout.
Why did the resistance level, which formed the balance (1) and was broken (2), push the price upward? To answer this question, let’s try to understand – who was made a fool?
Supposedly, these were buyers who were long in point (3). We can see them in the footprint by green clusters. After the price continued its upward movement, these buyers moved their stops either into the breakeven or to a level of small profit. It means that they were kicked out by their stop losses in point (4). They received a minimal profit (or didn’t receive it at all) although they correctly selected the market movement direction. In other words, they were made fools.
The uptrend continued but not all bulls managed to enter into a position and/or hold it.
Now look at the previous NQ futures chart. Reason for a while what traders were made fools:
- at the area with the first red oval (test of a bullish breakout);
- at the area with the second green oval (test of a bearish breakout).
How to trade by support and resistance levels?
We already mentioned a number of methods of looking for support and resistance. Let’s speak about the practical side of the issue. How to use the support and resistance levels in trading for making profit?
In general, the scheme is the following:
- Looking for the support and resistance level.
- Waiting for the moment when the price approaches the discovered level.
- Receiving confirmation signals.
- Entering into a position.
- Accompanying the position (protective ATAS strategies).
- Closing the trade.
Every trader decides for himself what methods to select for looking for the levels and what signals to use. There is a multitude of variants. However, we will consider only one of them.
An example of entering into a position by mirror levels
Let’s select the following realization of the above scheme as an example of entering into a position using the strategy of trading by levels:
- Looking for a mirror level.
- Waiting.
- Receiving a confirmation signal from the Cumulative Delta indicator.
- Entering into a position.
Entering into buys by mirror levels
First. We will use the already discovered level of 56.70 in the chart above (an oil futures). We have the broken resistance and we have to wait for a moment when it works in the mirror-like fashion – as the support.
Second. It is desirable to use the ATAS level alerts in order not to miss the approach to the level of 56.70 from top. The software will send the signal immediately, since the test could be very swift-passing.
Third. We will use the ATAS Cumulative Delta indicator to get a confirmation signal. However, we will do it in a creative manner. We will set the use of the Cumulative Delta impulse. To do it, please, open the chart and press Ctrl+I. Then add the Momentum indicator to the chart in 4 steps and use the Cumulative Delta indicator rather than the Close parameter as the data for calculations.
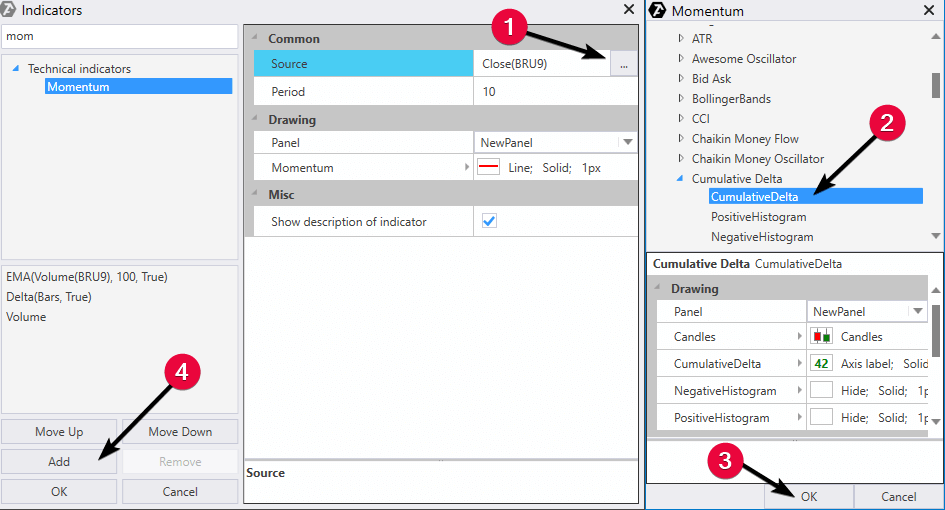
The picture above shows you how to set the indicator. If you do everything correctly, you will get the following chart view.
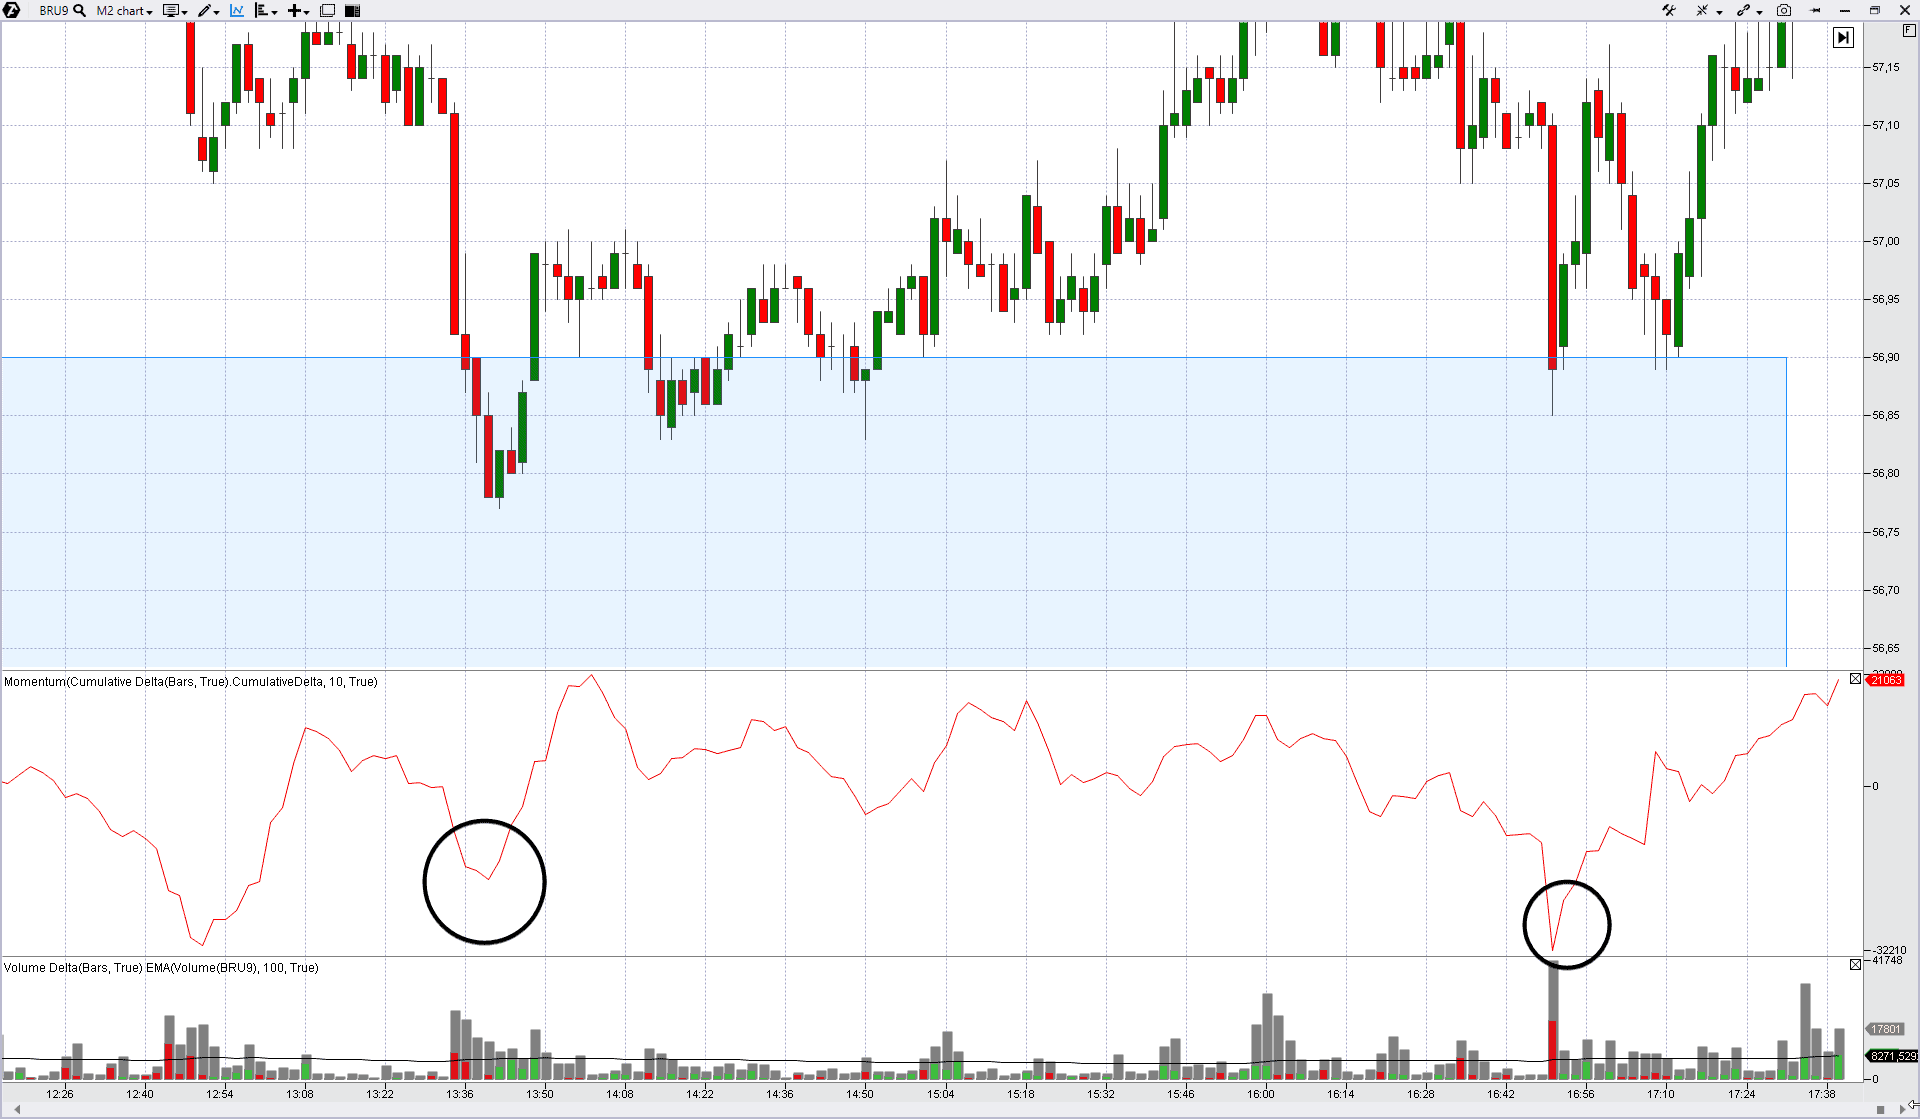
We selected 2-minute period to identify the moment of entering into a trade more accurately. When:
- the price enters the blue area (a supposed support level – we found it in the chart above),
- and the Momentum + Cumulative Delta indicator draws a reversal from bottom to top (it reflects a transition of predominance from sellers to buyers – these situations are marked with black circles),
- we enter into buys.
Entering into sells by mirror levels
Let’s consider oil futures; the data is from the Moscow Exchange; the tick type of the chart.
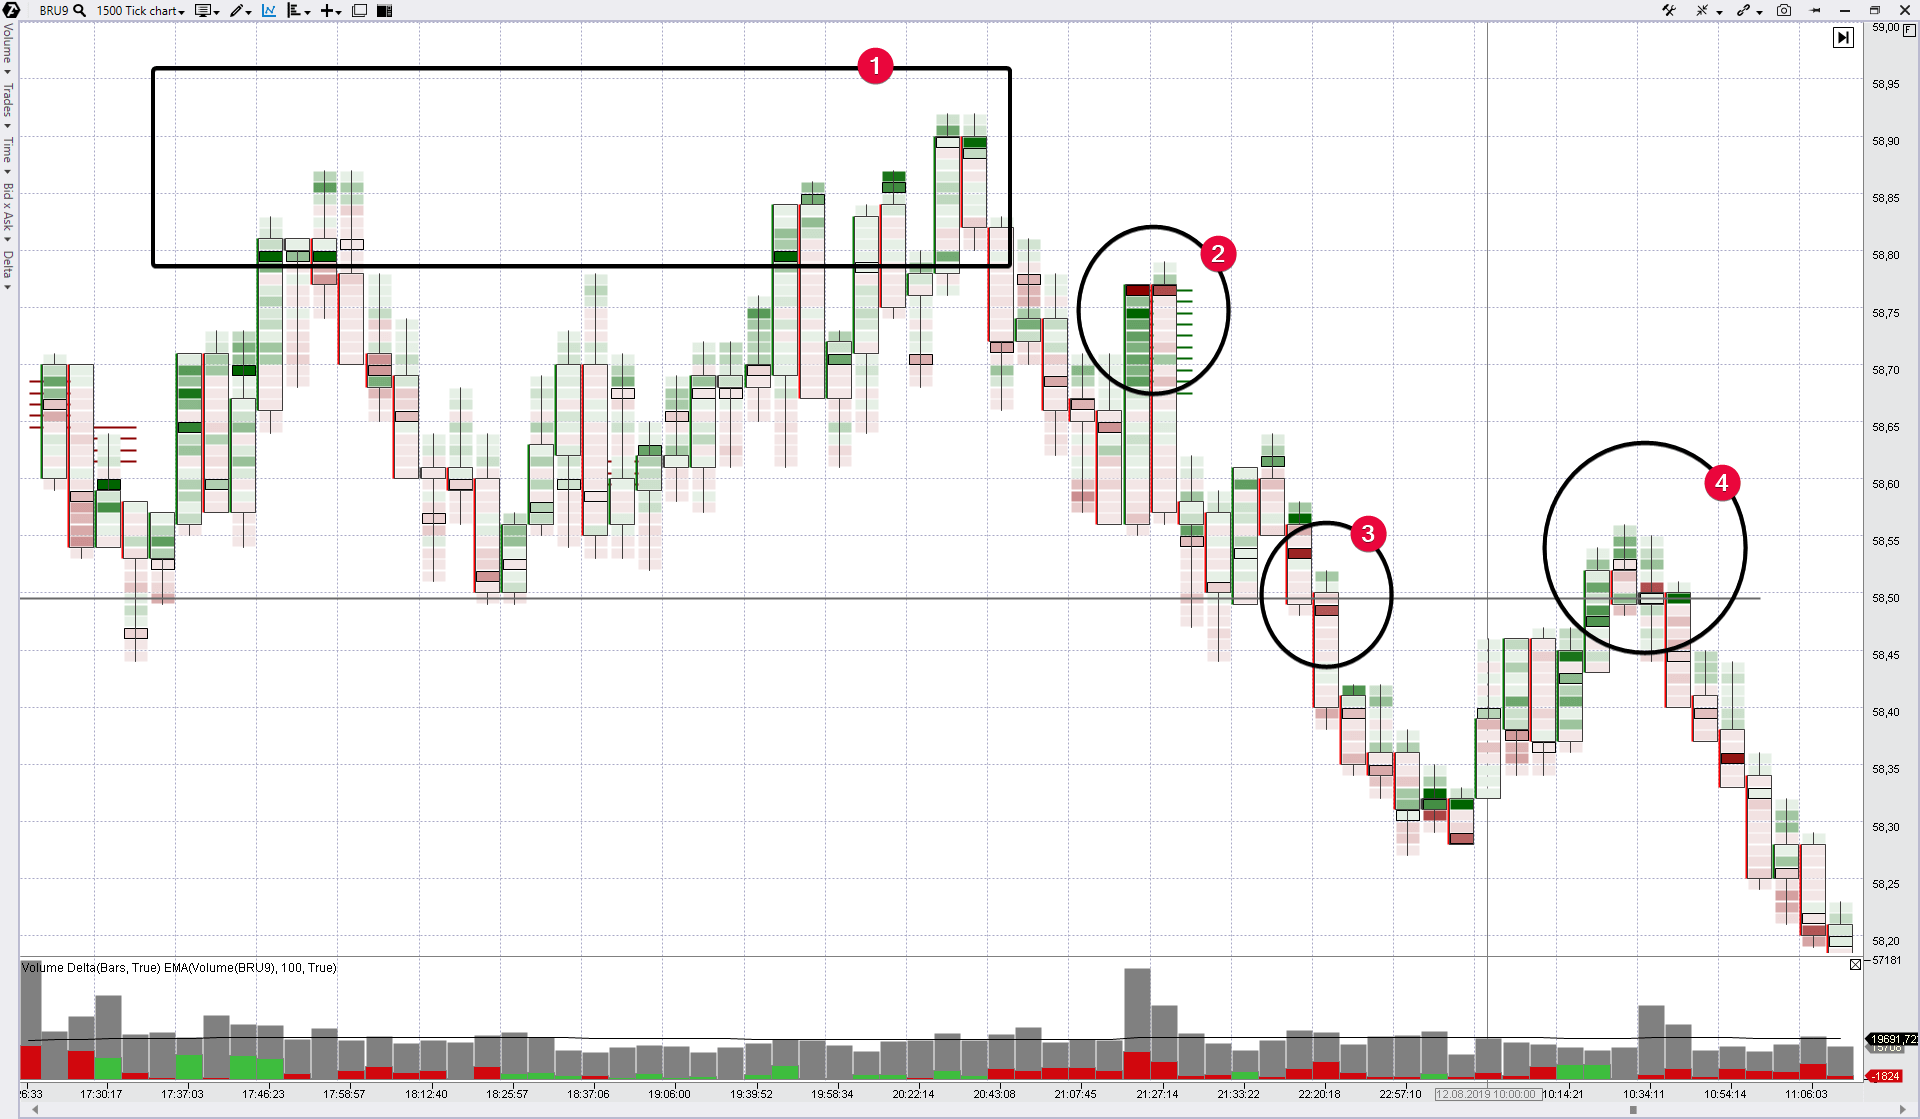
- Isn’t it strange that the buying splashes at the market peaks do not produce a result? The price doesn’t grow. It is a bearish sign.
- Manipulation character of movement. Perhaps, some news were broadcast and the market started ‘to boil’. This happens when the market gets an initial impulse for entering into a trend.
- Bearish effort at the support breakout. This is interesting for us. Facts (1) and (2) give us confidence that the downward breakout is a true one, that is why we begin waiting for a breakout test. The former support level should ‘mirror’ the price down.
- We will consider this moment with the 256-tick period.
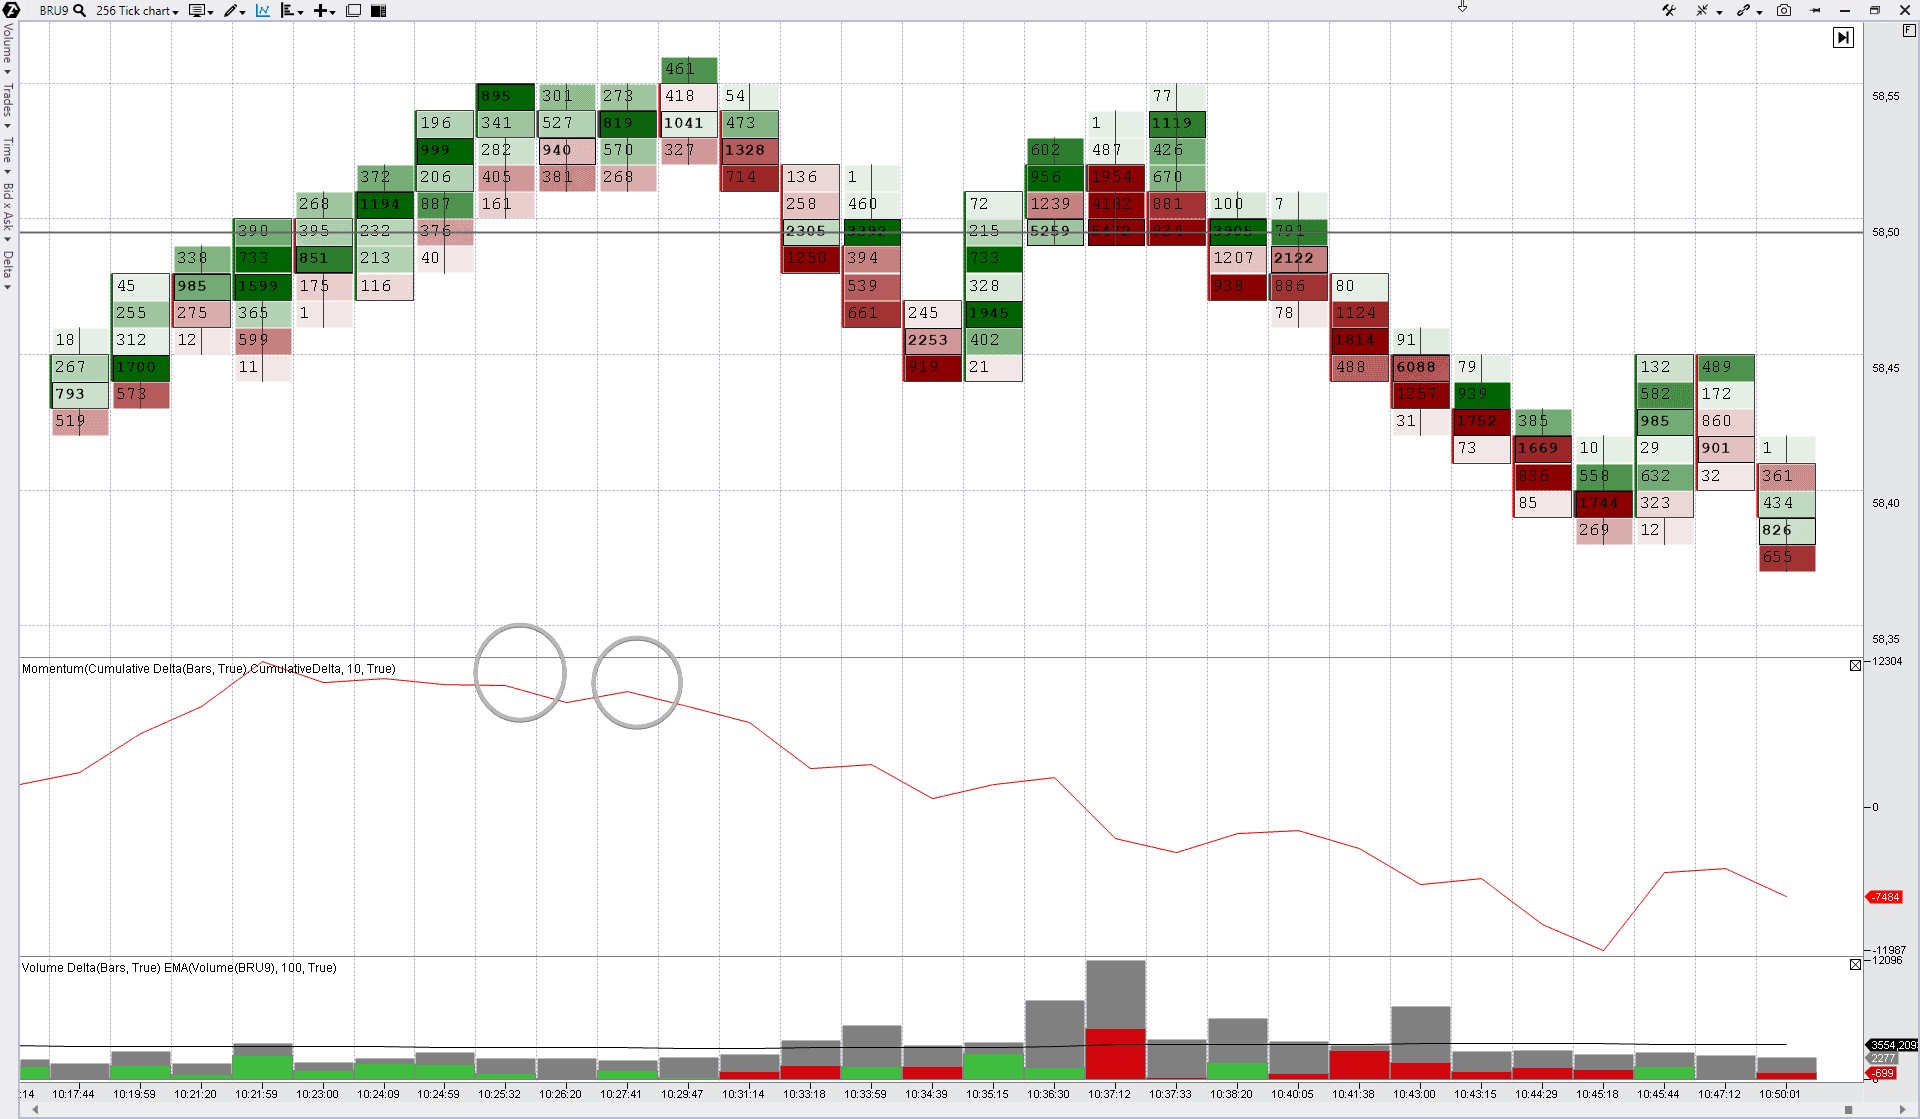
Our ‘new friend’ – Momentum and Cumulative Delta (two in one) – shows drying out of the buying pressure (two grey circles show that the indicator line reversed down) when the price still didn’t begin to move down. This is a signal for entering into a short, assuming that the former support will offer opposition.
In accordance with the above hypothesis, the sellers who entered the market at yesterday’s downward breakout (3) were fooled. They were thrown out of the market through activation of the stop losses, which were located too close – in the breakout area. Drying out of buys at the peak of point (4) shows that the market has ‘misbehaved’ enough and is ready to start reduction.
Summary
As you can see, trading is not only the discipline and strong adherence to the rules. There is a place for creative activity in it.
ATAS provides you with a possibility to find a unique combination.
- 14 types of charts with any period;
- more than 70 types of indicators – each has its own settings. Indicators can be superimposed one onto another.
Download ATAS and play with it:
- to find the support and resistance levels;
- track the receipt of confirmation signals when testing these levels.
Then check your trading ‘on paper’, optimize parameters and you will get your competitive advantage. Best of luck!