The Big Trades, Imbalance and Speed of Tape for level trading
Everything you need to know about profitable trading is 3 levels: the position entry level, the exit level (the goal, take profit) and the possible loss limitation level (the protective stop loss). We already wrote about how to look for the levels for trading with the help of the Market Profile indicator. In this article we will continue the topic and tell you how interesting some other indicators of the volume analysis could be for traders.
Read how to look for the levels of profitable trading with the help of the following indicators:
How to look for the position entry levels?
Let’s develop the topic of looking for the levels in 2 parts:
- The first part of the article is theory. We briefly discuss what these indicators are good for, how they work and how to set them. You can find all the details regarding the indicators’ setting and working on our Youtube channel or in the knowledge base. Inpatient traders can go straight to the second part of the article.
- The second part is practice. We will consider real-life examples with the Moscow Exchange and CME futures.
Theoretical part
What the levels are and why they are important?
Levels are the prices, which are attractive for a large number of traders.
Perhaps, traders considered namely these prices to be fair or they posted stops/takes namely at these levels. If a big volume is traded at several price levels one after another, the price, as a rule, slows down at these levels and tests them. Which means that new trades could be opened here with a minimal risk, because the price would hardly move sharply against your order.
The Big Trades indicator
What it shows – levels, at which major market buys or sells took place.
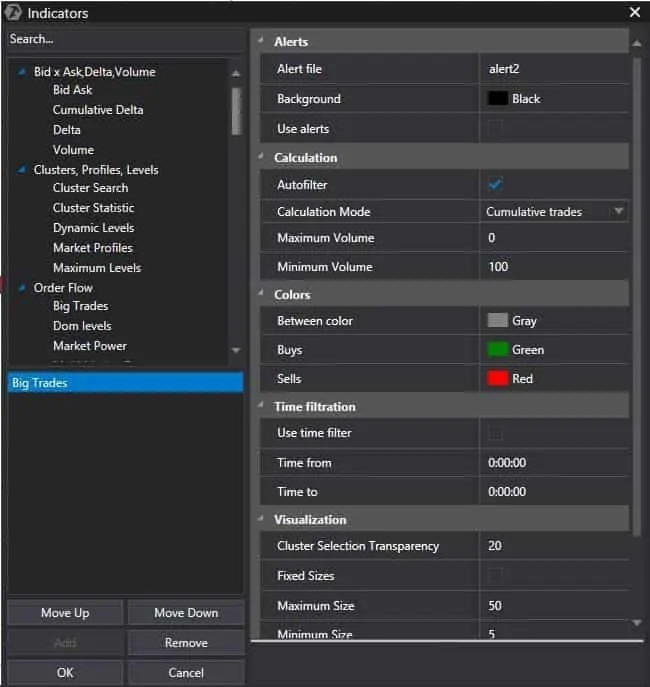
How to set – there is an autofilter for beginners. The indicator correctly works without manual control. Advanced traders can set the filter of the maximum and minimum volume all by themselves.
In what charts it works better – in any.
We wrote a separate article about this indicator.
The Stacked Imbalance indicator
What it shows – levels, at which there were much more aggressive buyers or sellers.
How to set – you set a percentage of excess of one side over the other and a number of the price levels in succession, at which this excess was. Settings are different for each instrument and the most efficient approach is to select them on the basis of your experience. Settings are very simple.
In what charts it works better – in any.
We mentioned this indicator in our articles about imbalances.
The Speed of Tape indicator
What it shows – price levels, at which the speed and number of trades on the tape increased or decreased.
Trades move very fast on the tape. But there is a bigger number of trades at some levels because, for example, entry stops or takes are activated. Robots become active at some price levels because, for example, some important news were broadcast.
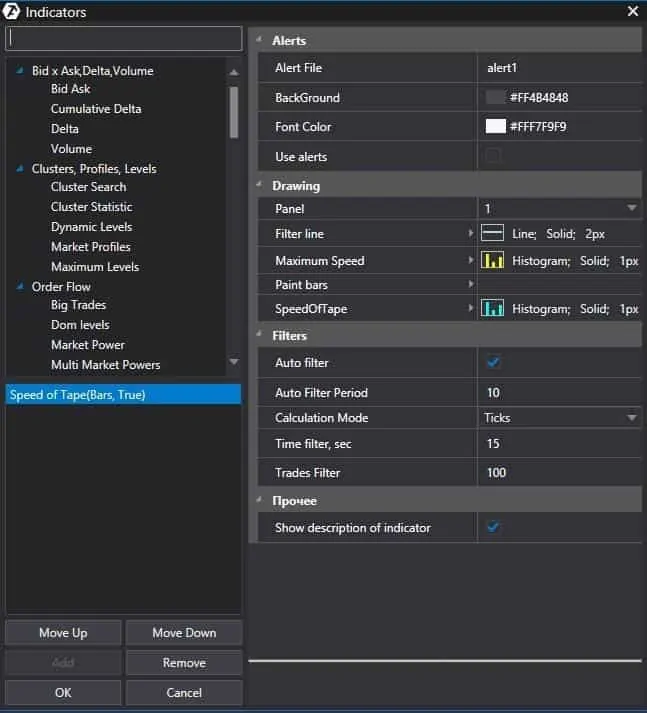
How to set – there is an autofilter for beginners. You do not touch anything and the indicator works. Advanced traders can choose the types of calculations and filtration. For example, the indicator will show those bars where very many just sells or buys took place during several seconds.
In what charts it works better – in any chart, which would change rather fast. These could be short time ranges, range charts or tick charts.
Practical part
Work of the indicators with an RTS index futures
Let’s analyze one trading session consequently using the three indicators.
Looking for the levels using the Big Trades indicator
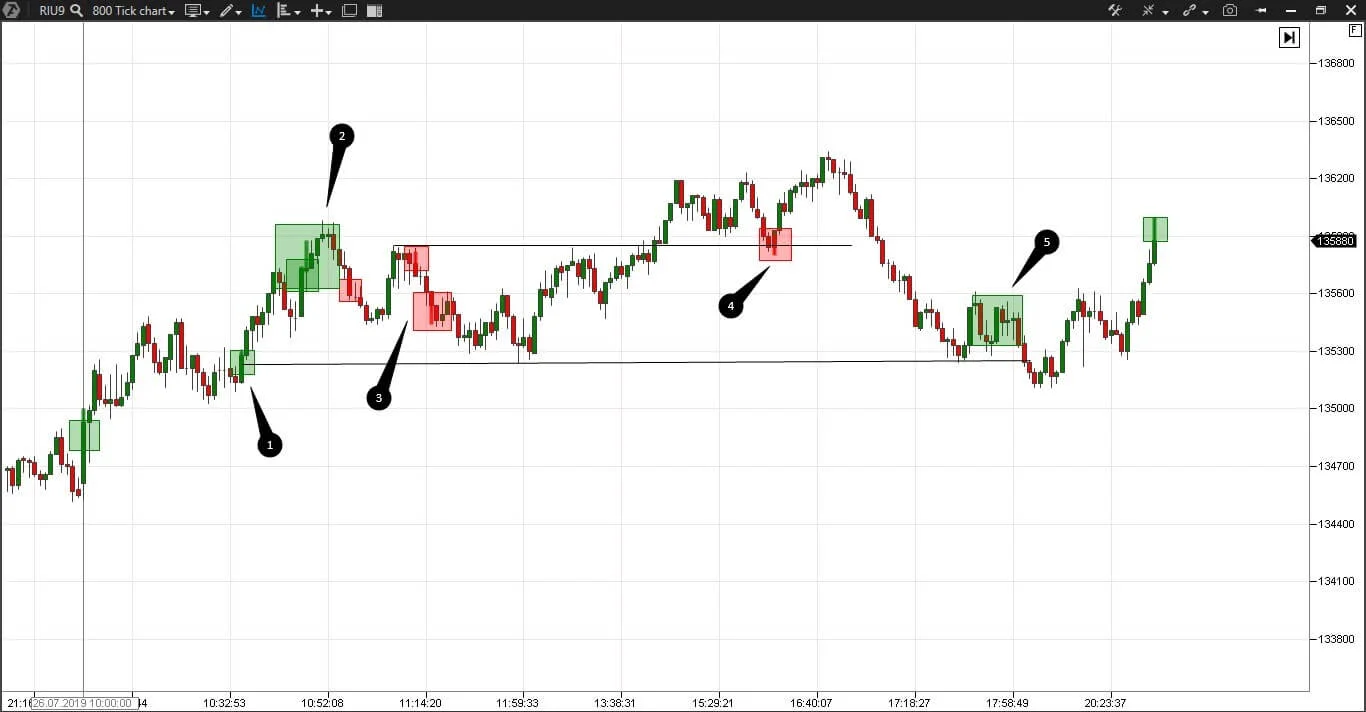
We will work in a tick chart with an RTS index futures (RIU9). This chart type is not connected with time. A new bar is built after a certain number of trades (800 in our case).
Let’s start from the Big Trades indicator. We use the autofilter. We marked the most significant levels of the trading session with black horizontal lines. The Big Trades indicator marks those candles in the chart where major market buys or sells took place.
There were major buys in the first candle of the trading session. We didn’t mark this level because big volumes at the session opening is a standard phenomenon in this market.
Buyers entered the market after a small correction in point 1 and the price grew.
The other traders ‘woke up’ in point 2 and decided to buy because the price grows. We drew a level here. These trades got into a trap and, most probably, closed their positions near point 3. The price didn’t move below the buyers’ entry level in point 1. We built the levels namely for monitoring the price reaction.
Sellers tried to push the price down in point 4 at our upper level but failed.
We see buyers at the first marked level again in point 5. The price moved a little bit below it but then quickly reversed.
In this example, we used the Big Trades indicator to mark two interesting entry levels at the very beginning of the trading session. We could have worked during the whole day with these levels.
Looking for the levels using the Stacked Imbalance indicator
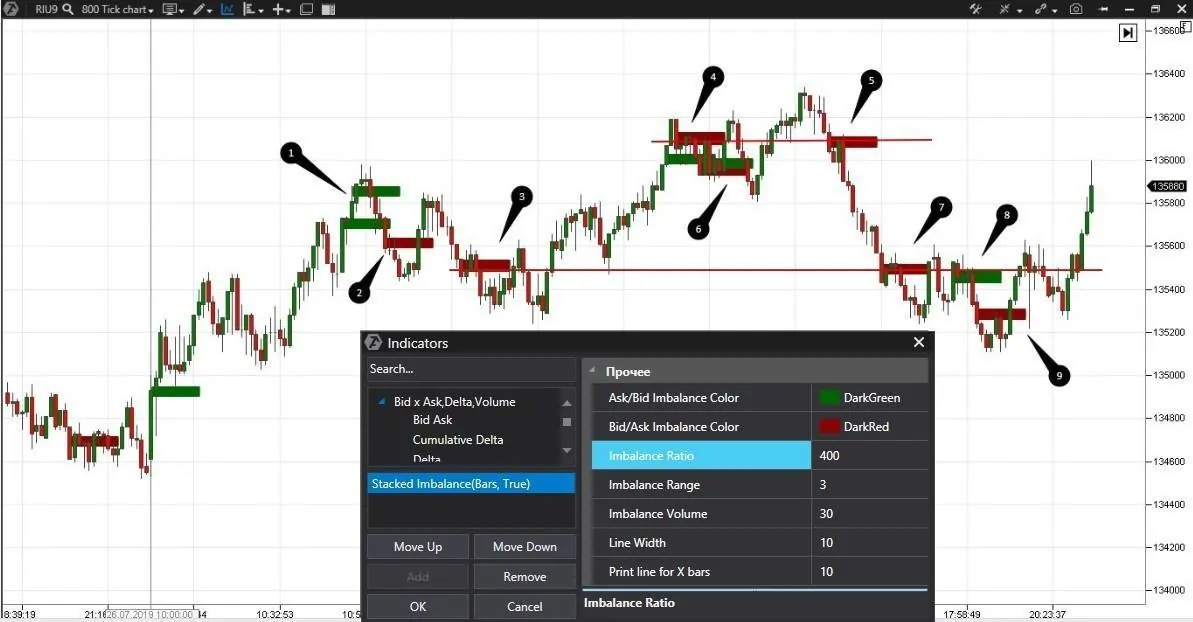
Let’s consider the same trading session at another angle using the Stacked Imbalance indicator. This indicator shows a significant excess of market orders of one of the sides rather than major buys. Significant excess is 200-400%.
It is very characteristic that some price levels at the beginning of the trading session coincide both for the Big Trades and Stacked Imbalance indicators. Significance of coinciding levels is higher.
We again see the entrapped traders, who bought at the local high, in point 1.
These traders, most probably, close loss-making positions in point 2. We marked additional levels, which we didn’t see in the chart using the Big Trades indicator, with red lines in this chart. Both buyers and sellers were active at the bottom level in the second half of the trading session.
We caught two reversals in points 4 and 5 at the upper level with the help of the Stacked Imbalance indicator. The reversal in point 5 could have brought us a big profit because buyers didn’t resist during the price decrease.
We see a fight between buyers and sellers in point 6. In such cases, follow the latest imbalance or stay out of the trade until the picture becomes clearer.
We again see a fight at one level in points 7 and 8. The price tests this level 5 times minimum. And we saw it long ago, that is why we have an advantage, which could be converted into profit trading short-term trades.
Point 9. Either inexperienced traders got into a trap here or the traders who bought in point 8 closed loss-making positions.
We found additional levels and saw 2 significant reversals with the help of the Stacked Imbalance indicator.
Looking for the levels using the Speed of Tape indicator
Now we will consider the trading session at the angle of the Speed of Tape indicator. We will change settings because we want to see the following separately:
- tape acceleration during sells;
- tape acceleration during buys.
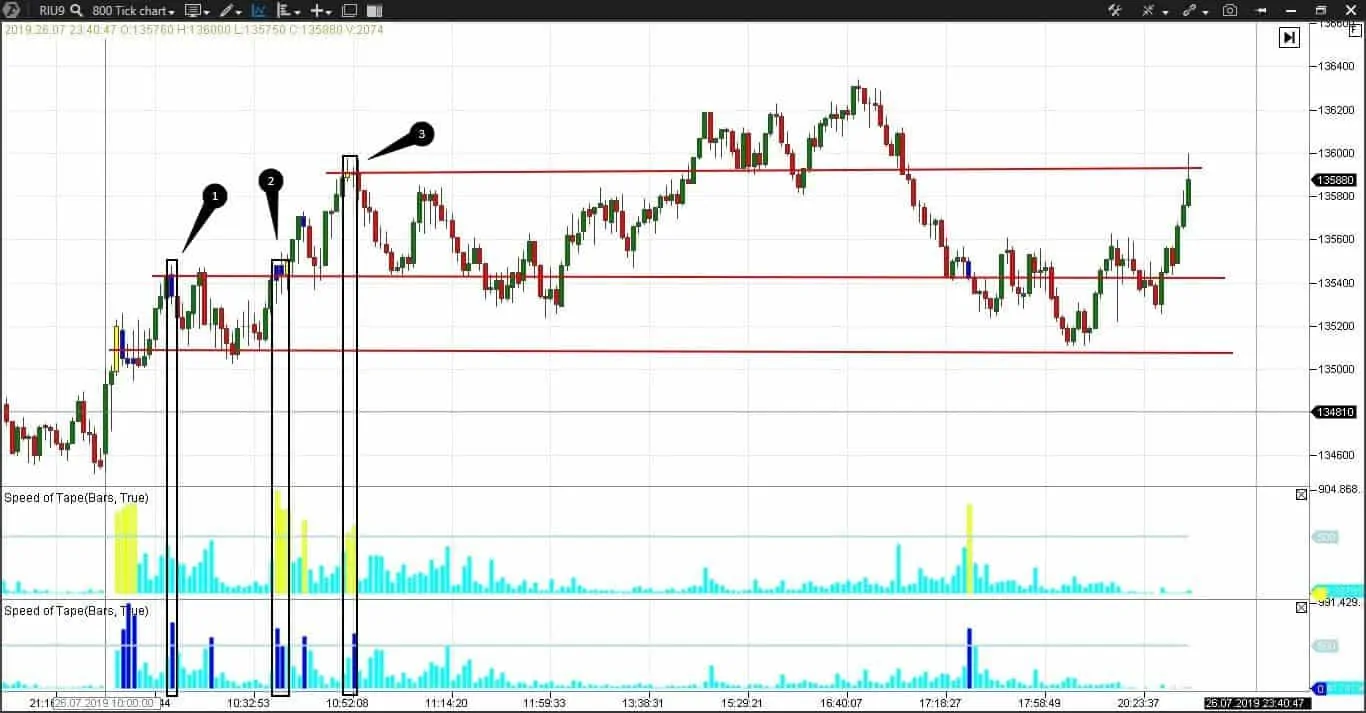
We will add two indicators for this. We will select ‘sells’ + ‘blue colour’ as a filter for the first one and ‘buys’ + ‘yellow colour’ for the second one. The candles, in which only buys or sells will accelerate, would be especially interesting with such settings.
Let’s think in what cases trades in the tape would accelerate – very often during activation of the market entry orders – stops or takes. Especially if these orders are grouped at obvious levels. We even wrote a separate article about cascade stops.
The levels, which the Speed of Tape indicator showed with our settings, coincide with the Big Trades and Stacked Imbalance indicators and this confirms their significance once more.
We marked the candle, in which only sells accelerated, with point 1. These could be both new orders or a partial registration of profit by long positions.
Sells accelerated again in point 2 at the same level, but buys also accelerated. Most probably, absorption takes place in the marked fragment because the price in spite of the sells didn’t fall. Limit buy orders absorbed market sell orders and new market buy orders were posted.
We marked the candles in point 3, where buys accelerated first and only then sells accelerated too. Sellers won and the price went down.
Again, at the beginning of the trading session we marked the levels, which the price tested several times, with the help of the Speed of Tape indicator.
Trading is the work with probabilities. You do not know what happens next. The levels reduce the risk.
Work of the indicators with an E-mini S&P 500 futures
Now, let’s look at CME. We will work in the range US 0/2/6 chart with an E-mini S&P 500 futures (ESU9). These charts are not connected with time, but it is more difficult to build them than the tick ones.
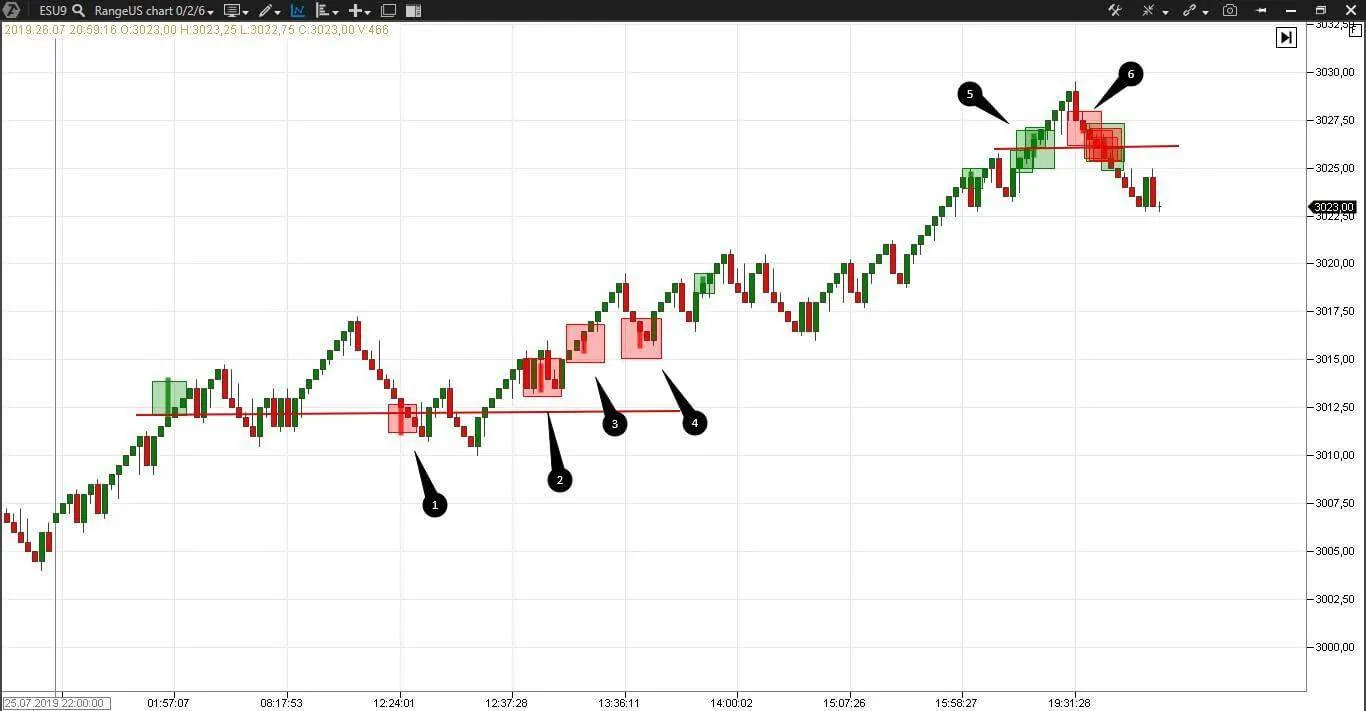
We use Big Trades with the autofilter in the first chart.
It is a very vivid example of the work of limit orders or managed money. We built two levels:
- by the first entry of buyers – the lower red line;
- by the highest activity of buyers and sellers – the upper red line.
We marked activity of sellers, which produced no result, with points 1-4. That is, in spite of the sells, the price didn’t fall but even grew. We wrote in detail why this happens in the article about the order flow. Limit orders do not let the price go down and they absorb all market sell orders. The Big Trades indicator will help you not to fall into the same trap 4 times one after another.
Finally, the traders, who noticed the price growth, woke up in point 5. It is obvious that they didn’t use our indicator. But those who bought significantly earlier already started to register their profits. Perhaps, new sellers also decided that it was a good moment. In this example, we have the levels and also a clear understanding that we shouldn’t open short positions. To get a stable profit we need to go together with the market and not against it. Even the most conservative and unconfident traders could have entered into a long in point 4.
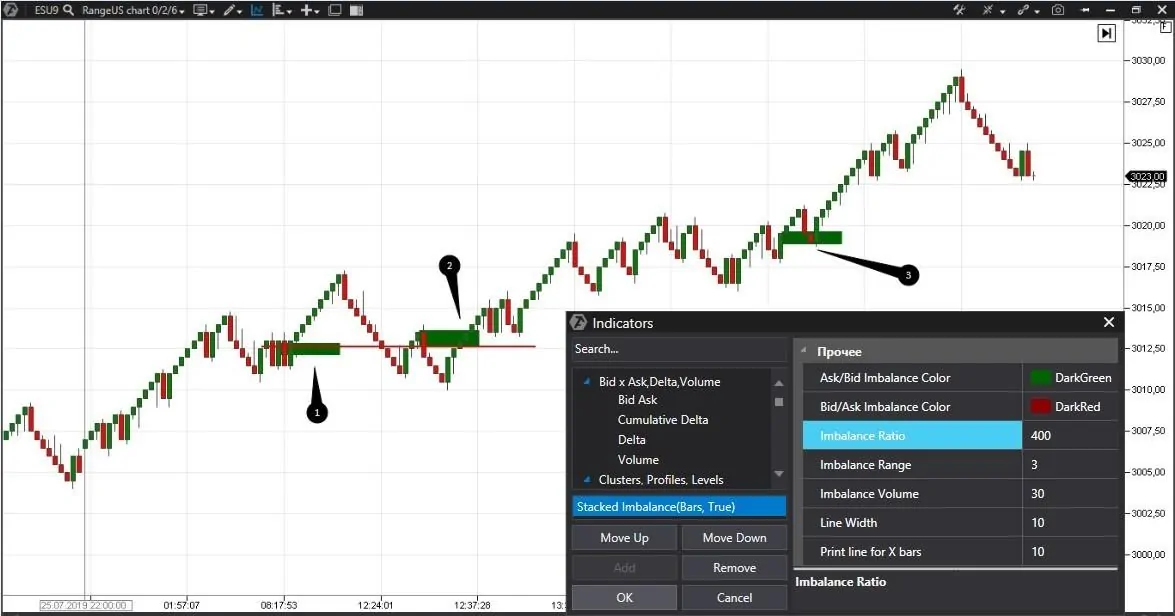
Let’s consider the situation from a different angle using the Stacked Imbalance indicator.
The picture is completely different here. We do not see imbalances of sellers at all, however, we see multiple imbalances of buyers.
We marked imbalances of buyers at one level with points 1 and 2.
We marked the following imbalance with point 3. Here we could have entered into a long position because there are still no sellers. In this case the Stacked Imbalance indicator supplements the Big Trades indicator and helps a trader to feel himself reassured when holding a long position.
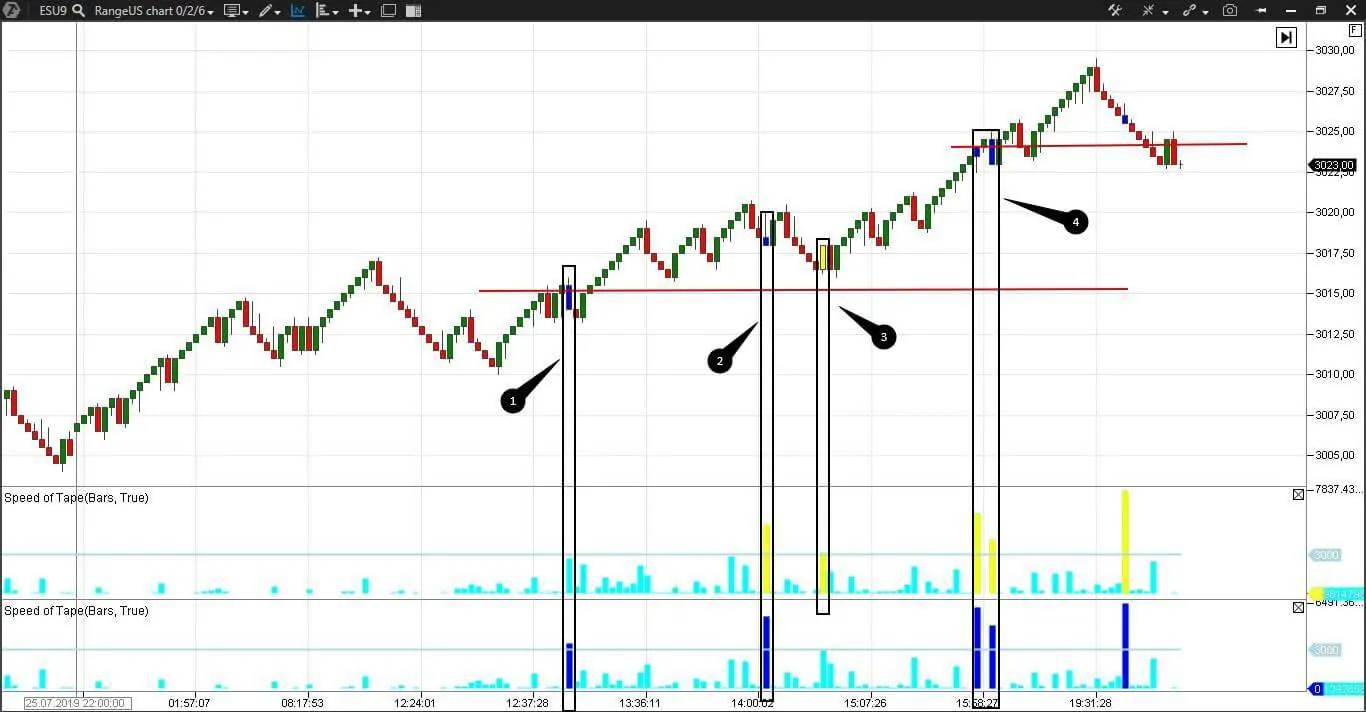
Let’s check the Speed of Tape indicator. We add two indicators again to see buys and sells separately.
This indicator shows a very similar picture to the one we saw using the Big Trades indicator.
Sells accelerate in points 1 and 4 but the price doesn’t go down.
Buys accelerate in point 3 very closely to the level we marked. Sellers preliminary win in point 2. But they don’t celebrate long. The level we built holds the price.
The levels which we built with the help of Speed of Tape supplement the previous charts and the market situation is similarly transparent.
Conclusions
Every trader decides for himself which indicator to use. You get a competitive advantage when you work with the cluster analysis indicators because you build the levels faster and more accurately than when using the classical technical analysis. In trading, it is important to see what happens right now and use the right moments. The ATAS instruments will help you to do it more efficiently than the majority of other market participants.
We considered a number of charts and in each one we found the levels where there were a number of moments for low risk trades. Try ATAS free of charge and set your own unique working space for finding profitable opportunities, which emerge every day.

