Imbalance: how to find and use it in trading. Part 2
In the first part of this article we considered mostly introductory information about imbalances: what imbalances on the exchange are, how they are formed, what they are for, how to get and set them and the basic principles of use.
Below is the second part of the article. We will consider more advanced issues:
- advantages of reversal charts when trading imbalances;
- how the cluster search indicator helps to trade imbalances;
- how to use the stacked imbalance indicator;
- how to use the OI analyzer indicator when trading imbalances;
- general recommendations and examples;
- analysis of a real-life trade;
- Weis waves and renko charts versus imbalance and cluster search.
Advantages of reversal charts when trading imbalances
As we already mentioned, imbalances could be used in all types of charts, however, we invite you to pay special attention to the Reversal charts. They do not depend on time, a new bar is formed when the price moves away from the original direction for a certain number of ticks. These charts are very similar to point-and-figure charts, which were used by traders in the 19th century, when they traded without computers. As well as other charts that do not depend on time, such as renko, range or tick, reversal charts filter out insignificant market noise and detect the trend movement fairly well.
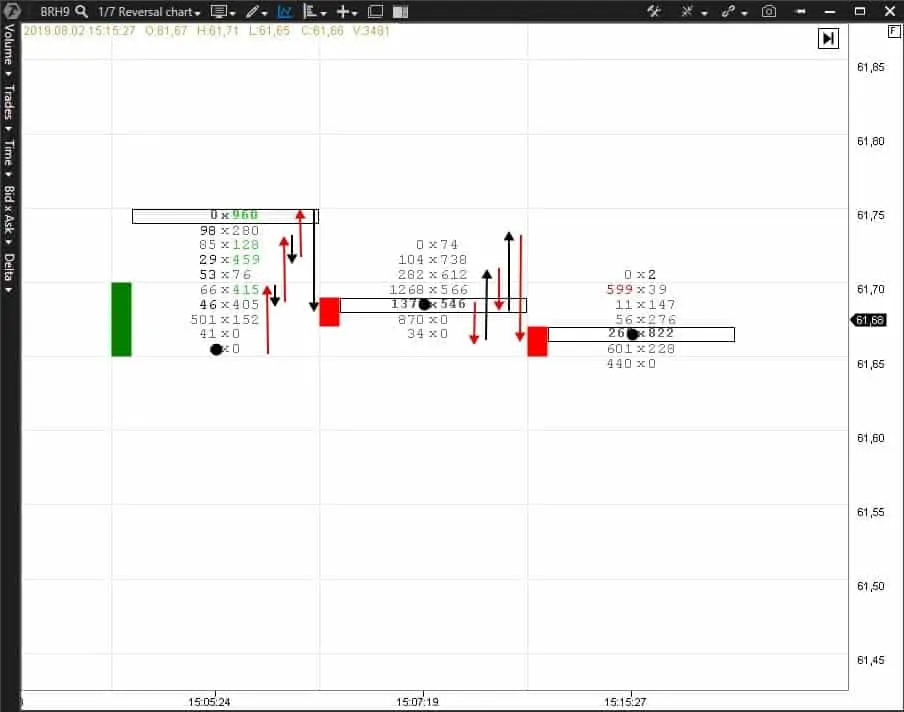
Let us consider in detail how reversal charts are built using example of a Brent oil futures (BRH9 1/17).
Any reversal chart has two parameters:
- the bar size. The bar size in our example is 1 tick or RUB 6.57;
- the pullback size. The pullback size in our example is 7 ticks or RUB 45.99.
Openings of each bar are marked with black dots. At 15:05 the price, first, moved 4 ticks up, then reversed and moved 2 ticks down, then reversed again and moved 5 ticks up, then reversed again and moved 2 ticks down and continued this behavior until the pullback was 7 ticks. A new bar opened at 15:07 on the seventh tick. Here the price changes again until a movement is 7 ticks.
If the bar size is more than 1 tick, the counting starts immediately after the bar formation. If you still have difficulties in understanding how reversal charts are built, please, watch this video on our channel.
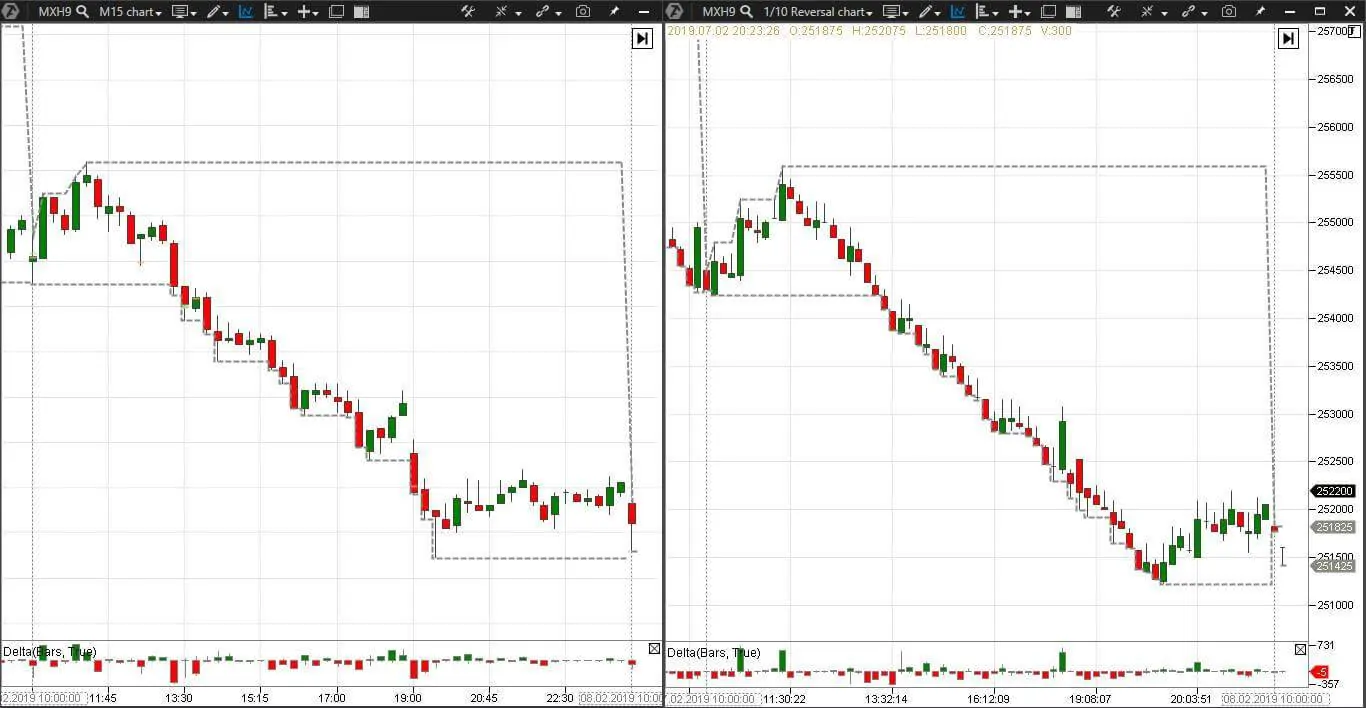
Let us compare a reversal chart and 15-minute chart.
- To the left – 15-minute chart of a MICEX index futures (MXH9);
- To the right – reversal (1/7) chart of a MICEX index futures (MXH9).
We have a trend day. It is clear from both charts. However, the reversal chart has less consolidation areas and more candle shadows, which shows from what side the pullback took place. Long and thin bars, which we considered in the previous article, emerge in the reversal charts. Every trader decides for himself what charts to use for trading. The trading and analytical ATAS platform offers you 15 types of charts and you can find your chart right now.
How the Cluster Search Indicator helps to trade imbalances
Cluster Search is a unique indicator of the ATAS platform. It searches for clusters by set parameters and highlights them in a chart with a color. You can set the search by volume, delta, bids, asks or number of trades.
How does the Cluster Search work with imbalances? Let us consider an example.
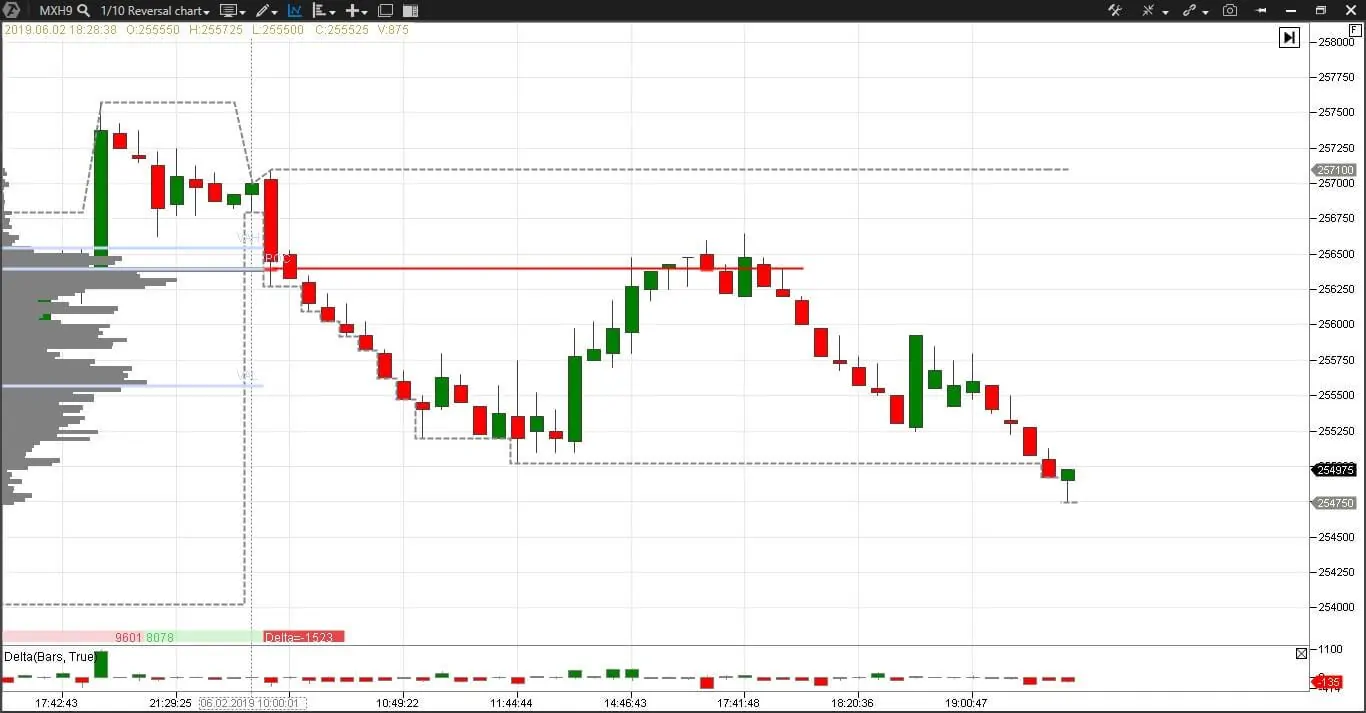
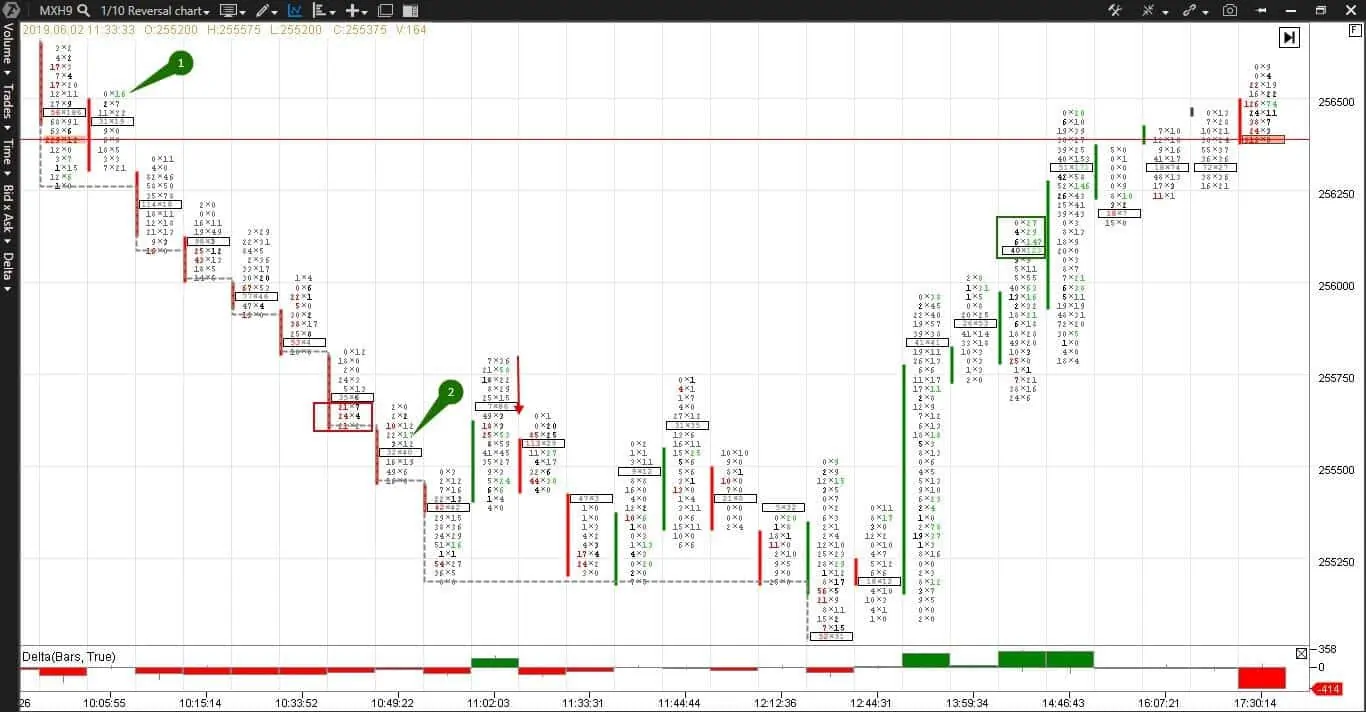
Here is a reversal (1/10) chart for a MICEX index futures (MXH9).
Let us consider in detail an upward reversal on the local low from 11:30 until 12:00.
Let us set the cluster search, delta and daily highlow indicators. See Picture 3.
- The delta indicator marks predominance of aggressive buyers or sellers with red or green color;
- Let us use 2 cluster Search indicators. The first one searches for clusters where the bids value is more than 200 and marks them red. The second one searches for clusters where the asks value is more than 200 and marks them green.
- The daily highlow indicator shows the day’s high and low movement in real time.
A big cluster for selling 229 contracts, marked red, appears in the first candle and a maximum volume level is formed. The buyers test this level in the next candle and get stuck at the candle high – imbalance number 1.
Further on, the price goes down on the next 7 bars, the delta is negative and there is only one green imbalance (number 2).
The seventh candle forms a new day’s low and long bottom shadow – it is logical to fix register profit at this level, expecting a pullback or reversal.
Pullback takes place at 11:02 and the green delta shows that there are buyers. But it is clearly seen on the reversal bar that the price moves from the candle high and the buyers retreat.
The price is traded in a range or is consolidated until 12:44. Then a reversal and upward trend movement, confirmed by a green delta and multiple imbalance of the buyers marked with a green rectangle, take place. The fact that this imbalance is at the bar extremum could be a sign of exhaustion of the trend movement.
At 17:30, a new big cluster for selling, this time, 313 contracts again emerges at the same level as it was the first time and the situation repeats. And it does it for a good reason. You will not see this trading setup without a footprint and will not be able to hold the position without imbalances.
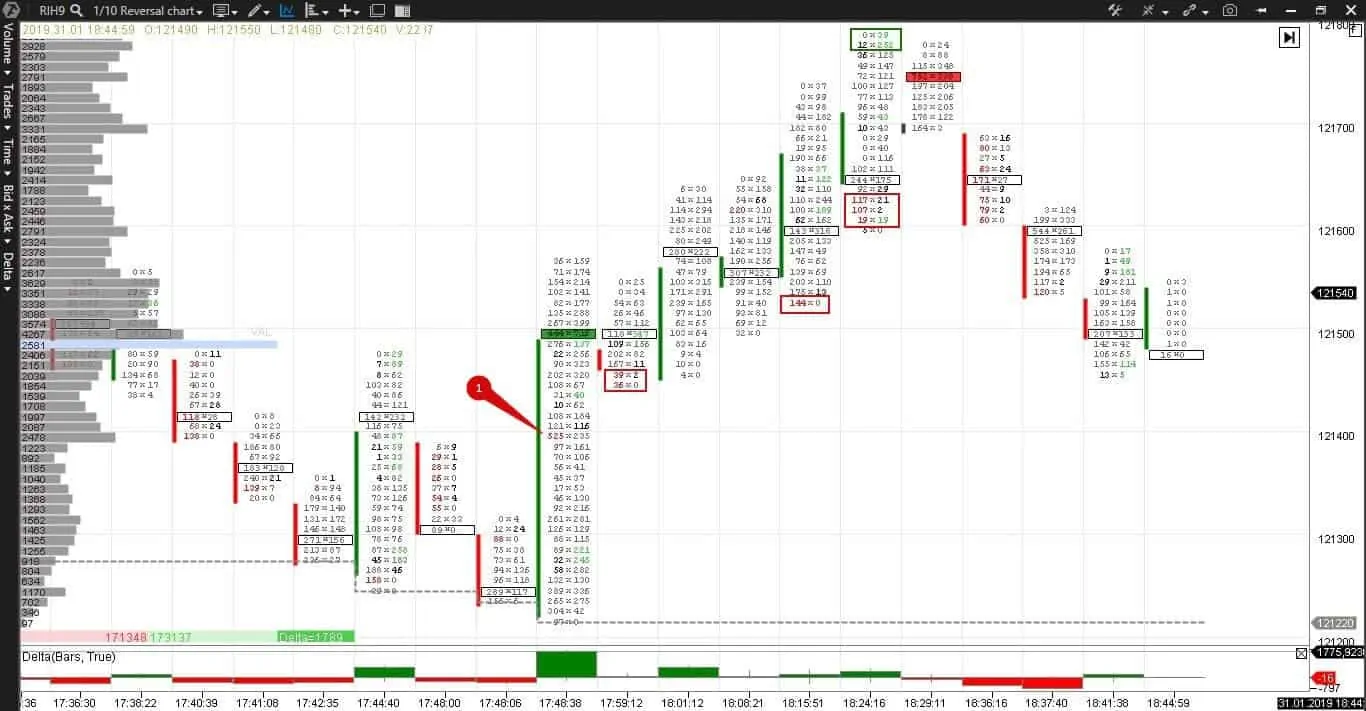
Let us consider one more example in a reversal (1/10) chart of an RTS index futures (RIH9) with the same indicators: delta, daily highlow and cluster search.
Here we also have two cluster search indicators. The first one searches for asks (from 700 contracts) and highlights them green and the second one searches for bids (from 700 contracts) and highlights them red.
At 17:48, at the day’s low, a reversal takes place and a big buying cluster emerges. Note that despite a huge green delta, there are no multiple positive imbalances in this bar, which means that the buyers are not sure in duration and strength of this reversal movement.
The negative imbalance in this candle is marked with number 1. Negative imbalances in the next candles are marked with red rectangles and are at the bar lows. These are entrapped short positions of the traders who do not use footprint. There are no multiple positive imbalances during the upward movement and delta decreases despite the new price peaks. Pullbacks for the bar highs are bigger than from the bar lows. These are warning signs about a possible reversal.
Long positions that got stuck at the bar extremum at 18:24, marked with a green rectangle, confirm the trend exhaustion.
A big selling cluster emerged at 18:29 – a reversal has been formed. The cluster search indicator helps to find an entry point into a trade, imbalances confirm movement and give confidence in holding the position.
How to use the Stacked Imbalance Indicator
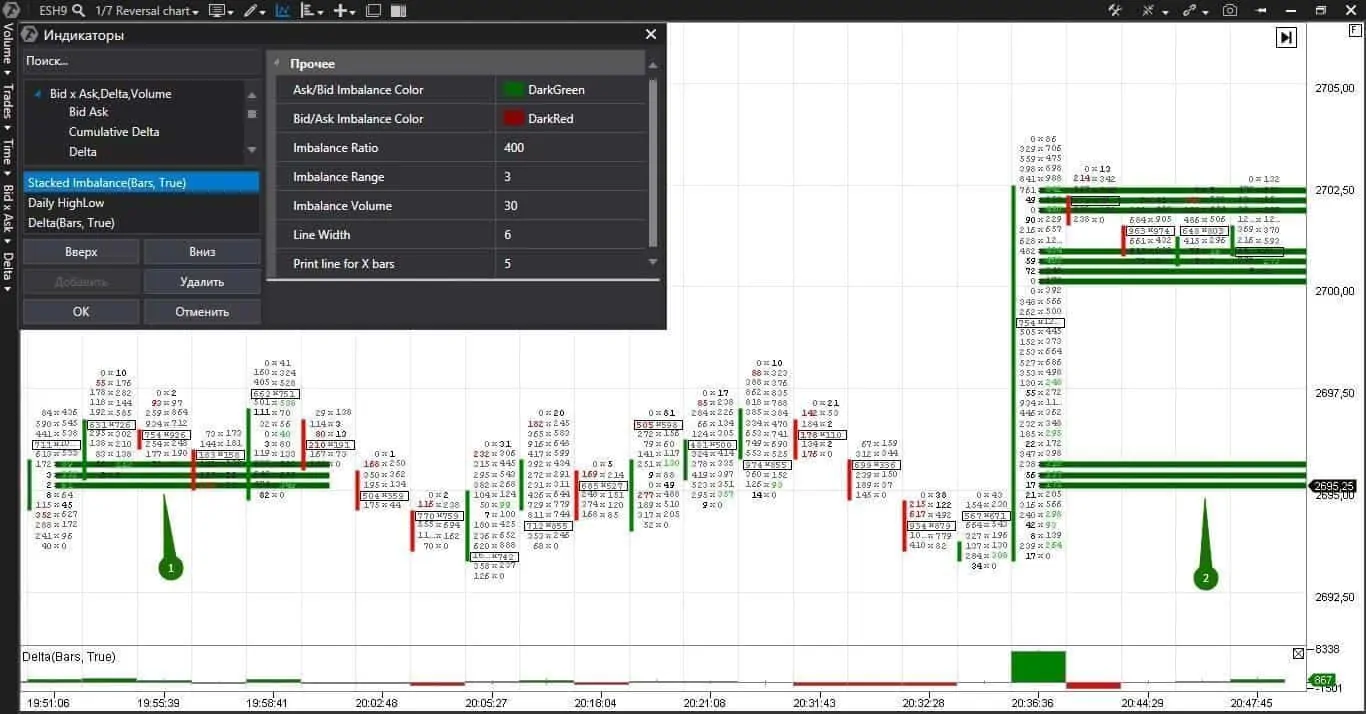
To track imbalances “manually” could be a boring process, especially if you are an intraday trader. It is tiresome to read numbers. As a consequence, concentration reduces, your eyes are strained and so on. What to do? The stacked imbalance indicator will help you. It clearly marks accumulations of imbalances in a chart in accordance with the set parameters. 4-5 bars that follow multiple imbalances is an area of initial imbalance. Areas of initial imbalance are often become support and resistance levels.
Let us consider an example. Here is a reversal (1/7) chart of a S&P 500 mini index futures (ESH9).
Points 1 and 2 mark the support levels, which were formed by multiple imbalances of the buyers. Note that both levels coincide, which makes them more significant. Settings of the stacked imbalance indicator can differ from the cluster imbalance settings, which we considered in the previous article. Thus, different imbalances can be combined on the screen. The less time a trader spends on simple things, such as marking levels, the more time he has for analysis. Use ATAS for automation and convenience of your working process and use your brain and experience for analysis and decision making.
How to use the OI analyzer indicator for imbalance trading
The OI Analyzer Indicator filters out data about increase or decrease of the open interest of buyers and sellers separately.This indicator will help you to understand what buyers and sellers did – opened new positions or closed the existing ones. Only the Moscow Exchange provides data about the open interest in real time, that is why this indicator works only on futures contracts of the Moscow Exchange.
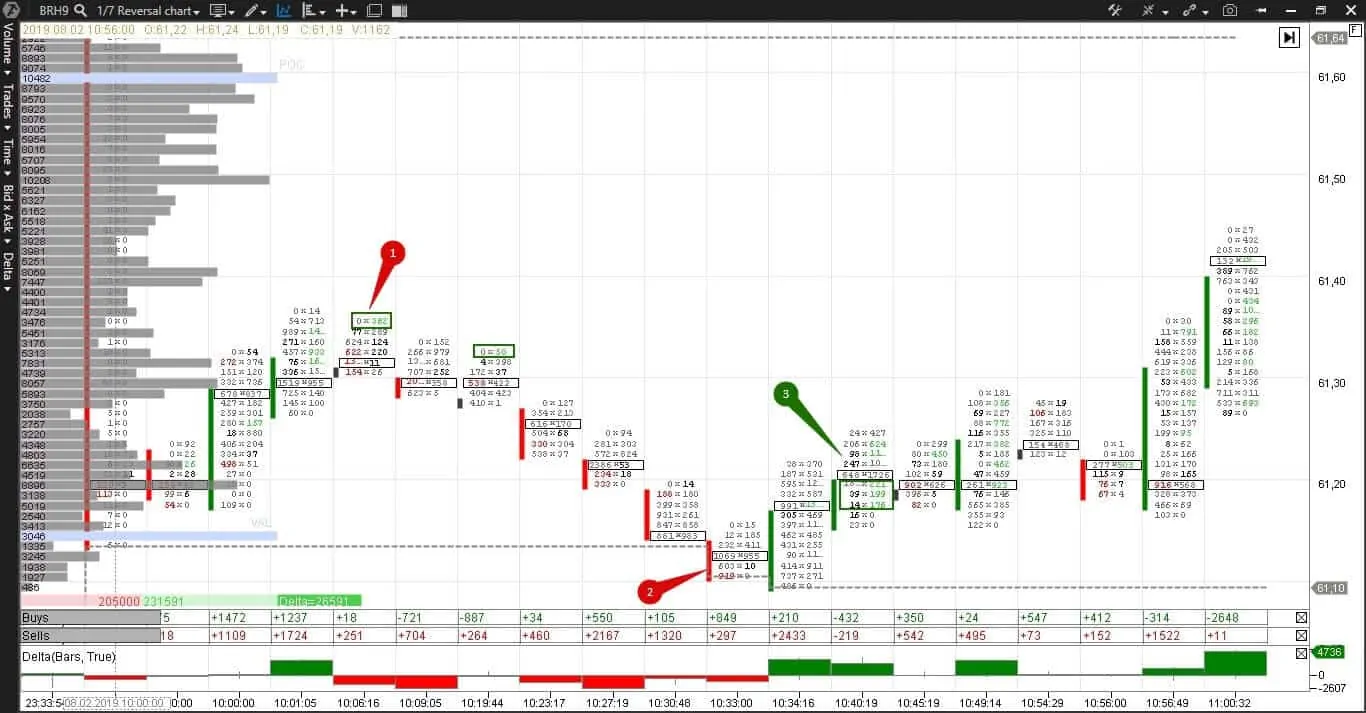
Example of use of the OI Analyzer Indicator on the reversal (1/7) chart of a Brent oil futures (BRH9).
There are already known indicators delta and daily highlow in the chart. Let us note some things before we discuss the OI Analyzer Indicator:
- As soon as a trader sells a contract, without having an open position, he becomes a holder of a short position. As soon as a trader covers (buys out) his short position, he becomes a buyer in the momentum, since a buy order is sent to the market. But he does not stay a buyer after closing his short position, since he exits the market;
- losses cause huge psychological discomfort for traders. Exit from a loss-making position results in an avalanche-like price change;
- significant increase of new short positions, opened by market orders, reduces the price. If this does not happen, it means that there is a big limit order in the market, which protects this price level. In other words, increase of new short positions, executed by limit orders, will not move the price downward;
- significant increase of new long positions increases the price. If this does not happen, it means that there is a big limit order in the market, which protects this price level;
- the OI Analyzer Indicator grows when a number of new opened positions increases and reduces when previously opened market positions are closed.
Let’s come back to the chart. Traders opened 2,867 new long and 10,729 new short positions from the moment of market opening until 10:34. In order to close long positions, the traders will sell open contracts and the price will go down. In order to close short positions, the traders will buy contracts and push the price upward.
The traders registered profit on some long positions at 10:09, which can be seen from the negative OI analyzer buy. However, despite the increase of new short positions, the price goes up from 10:34:16, which means that there is a limit order, which holds back aggressive market sells, at the level of the day’s low. As soon as short positions become loss-making, an avalanche of buy stops by short positions starts and the price goes even higher. If you read imbalances, you can make a decision in cold blood to hold the short position from point 1 to point 2. Long positions that got stuck at extremum points confirmed the price decrease. The OI analyzer warned us from point 3 about a possible price increase in the event of closing the accumulated short positions.
Emergence of multiple imbalances at 10:40 confirms a reversal at the level of the day’s low.
Trading recommendations and examples
Remember that the trading techniques below are general recommendations and do not guarantee profit. Use maximum of available arguments for justification of your market decisions in each specific case.
- When the trend movement starts, we enter with a market order in the course of formation of a multiple imbalance in a bar. This is an aggressive approach with a high risk level, since imbalances can change before the bar closes. One of the variants of the trend movement beginning is exit from the consolidation area;
- In cases of reversals, we wait for closing of a reversal bar and emergence of multiple imbalances and a delta, which has the same color as the imbalances do. After confirmation, we enter with a limit order at the level of multiple imbalance;
- During consolidation, we sell with limit orders from the range high and buy with limit orders from the range low. Short stops will limit the losses, which might appear if the consolidation area is broken;
- Imbalance at the bar extremum points warns about denial of this price level by the market. Multiple imbalances at extremum points appear, during the trend movement, when the trend slows down;
- Move in harmony with the most recent multiple imbalance;
- If the price did not reach the limit order for opening a trade, this is not your trade.
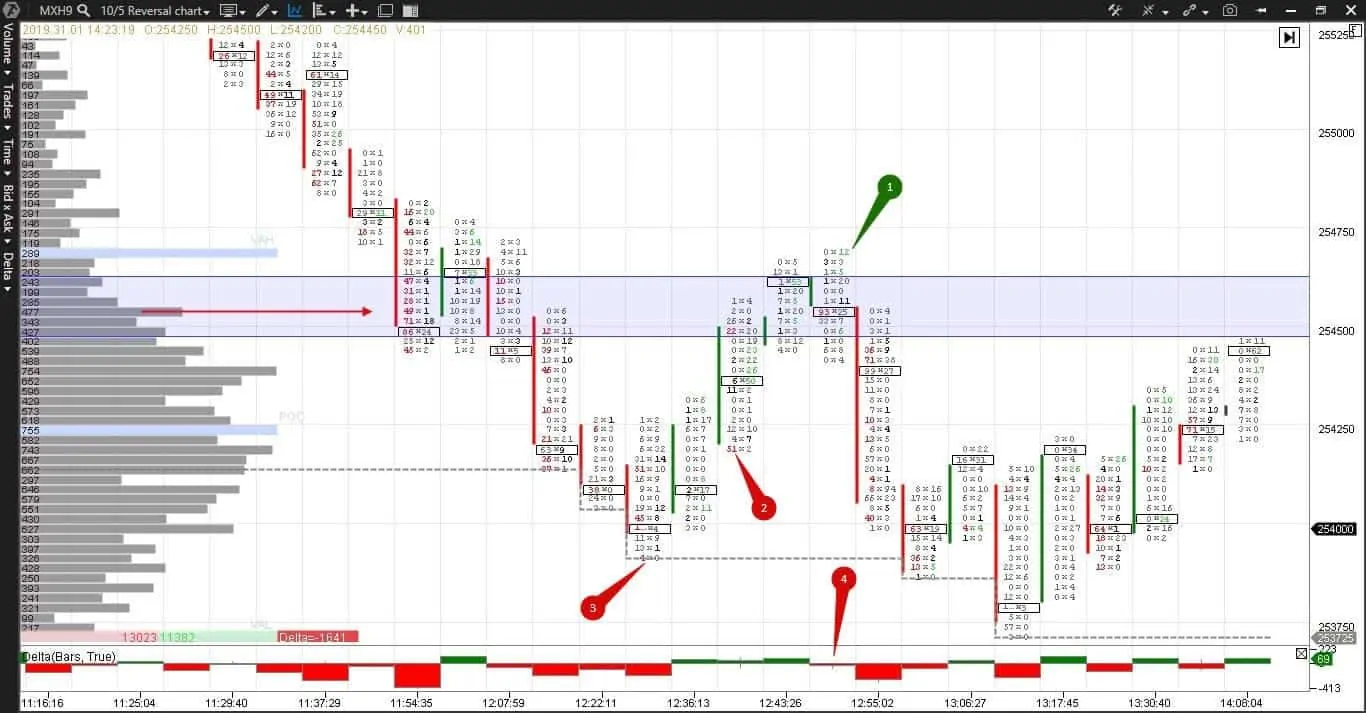
Example. Here we have a reversal (10/5) chart of a MICEX index futures (MXH9) with the delta indicator.
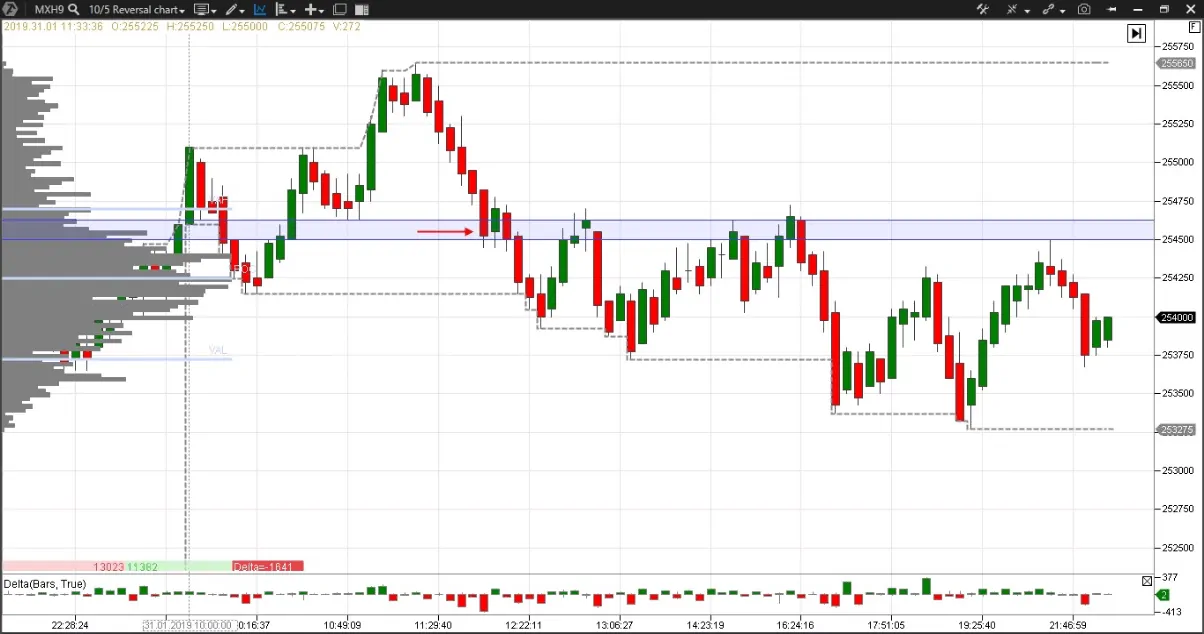
The blue level and red arrow mark a huge multiple imbalance of sellers. It is highly likely that it influences the further course of trading. Points 1, 2 and 3 mark long and short positions that got stuck at the bar extremum points. The negative delta warns in point 4, when the buyers tried to break the resistance level, that the level withstood.
We reduced the upper chart to the candle pattern to show a global picture. The sellers’ imbalance level was an insurmountable barrier for buyers all the day long.
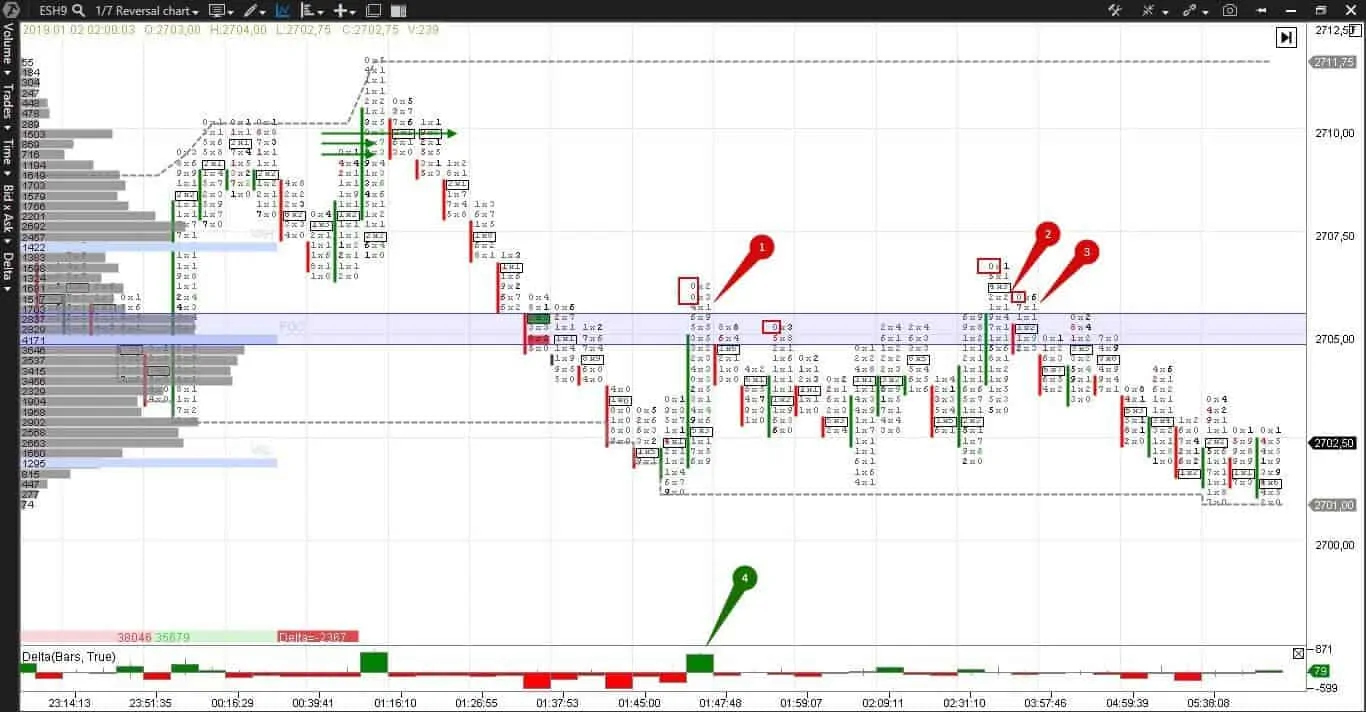
A similar example is in a reversal (1/7) chart of a S&P 500 mini futures (ESH9) with already known indicators: delta, daily highlow and cluster search.
A reversal took place at the level of the day’s high. The buyers imbalances, at the level of which a reversal took place, are marked with green arrows. Interests of buyers and sellers collided at the maximum volume level and two big opposite clusters emerged at the same time. Sellers turned out to be stronger and the maximum volume level turned into a serious resistance level. Three efforts to break it, marked with red numbers, failed. Pay attention to zeros in red rectangles – these are close stops of traders with short positions. Which means, their thoughts were correct but the trade realization wasn’t. Despite a huge green delta, marked with number 4, there are only two individual buyers’ imbalances in the bar. Consequently, a big volume is a struggle between the buyers and sellers without an explicit dominance of one of the parties.
Analysis of a real-life trade
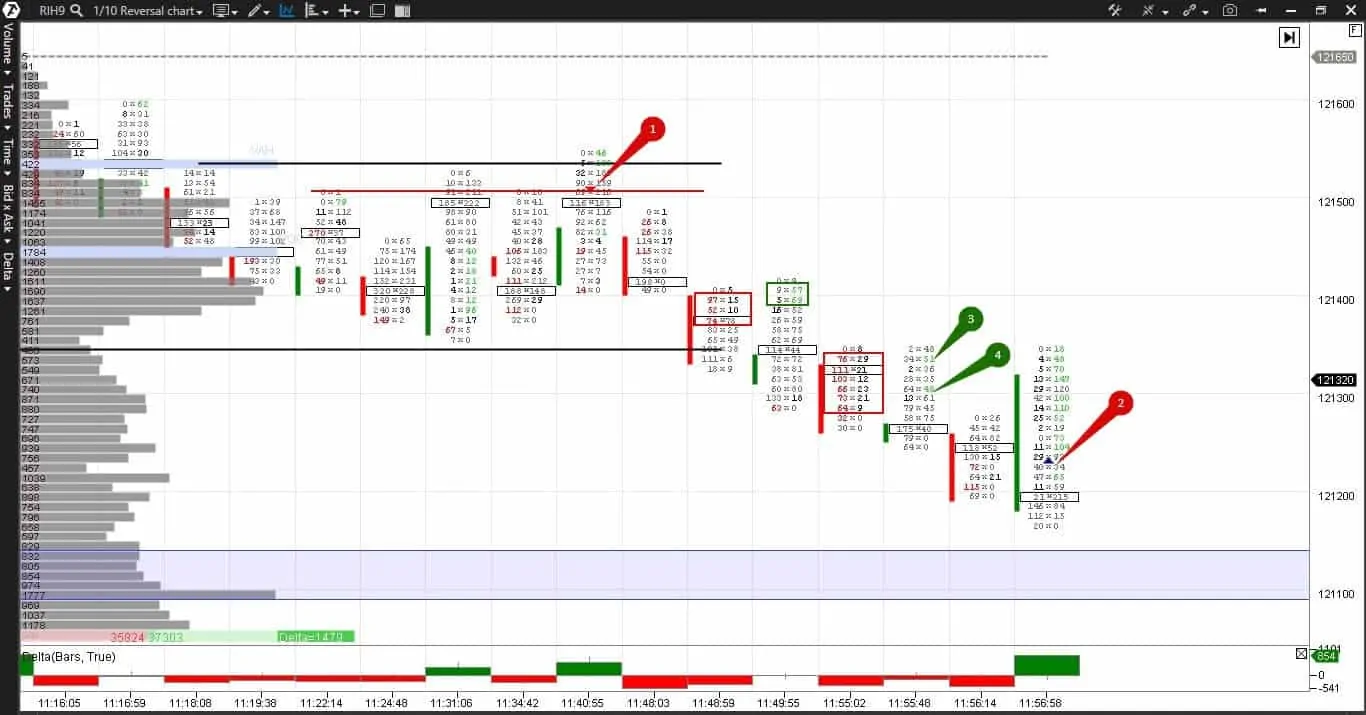
Here we have a reversal chart of an RTS index futures (RIH9) and delta indicator.
The price consolidated in a range from 11:18 until 11:48. There are two variants of trades in a range:
- responsive – selling from the range high and buying from the range low. These are short trades with the risk level in several points and take profit on the opposite range boundary;
- proactive – selling from the lower boundary for breakout of the low and buying from the upper boundary for breakout of the range high. These are more long-term trades, the aim of which is to catch the beginning of the trend movement after the exit from the consolidation area. The risk level is higher in these trades and it is more difficult to calculate the take profit.
The trade in question was opened in point 1 as responsive – it is a sell from the range high. The stop is posted 2 ticks above the range. The negative delta and multiple imbalance at 11:48:59, marked with a red rectangle, turn the responsive sell into a proactive one.
We stay in the trade until:
- the bar delta is negative;
- the price pulls back downward from the bar highs;
- the maximum volume level goes down;
- there are no multiple imbalances of buyers.
A big predominance of sellers over buyers at 11:55:02, marked with a red rectangle, and buyers that got stuck at 11:49:55 confirm the downward trend. The blue level marks the previous multiple buyers’ imbalance – the price slowing down or reversal is possible here. Take Profit is posted at this level. However, the price reverses earlier and the trade is closed with a market order in point 2.
Shortcomings of this trade:
- the opening level should coincide with the trading range high or low in order to reduce the risk level;
- responsive and proactive trades are mixed due to the main traders sins – greed and absence of discipline.
Weis Waves and Renko Charts versus Imbalance and Cluster Search
- Let us compare capabilities of various indicators and charts. We will use:
- Weis waves;
- renko charts;
- imbalance;
- cluster search indicator.
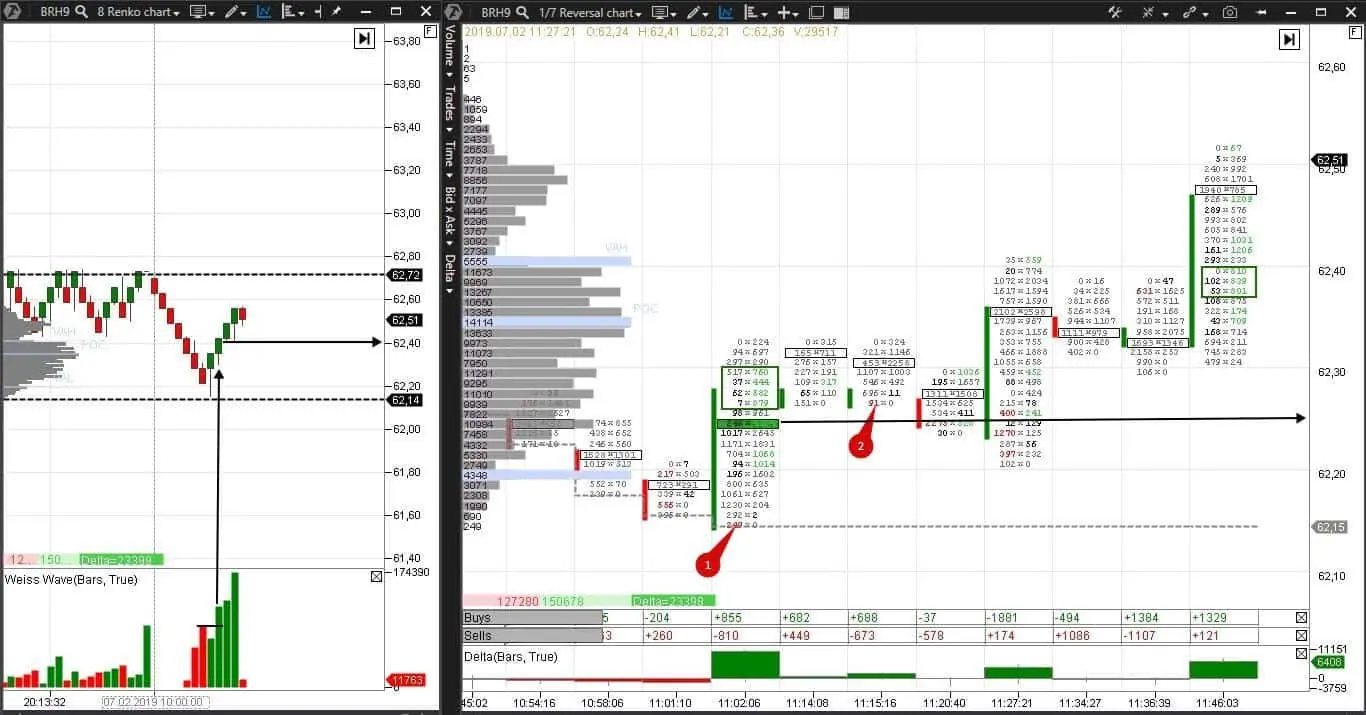
We have here a Brent oil futures (BRH9).
- To the left – renko chart (8) and Weis waves indicator, which we described recently;
To the right – a reversal (1/7) chart, delta, cluster search and oi analyzer indicators.
We can see a reversal at the level of the day’s low in both charts. Let us compare trading signals they send:
- If you want to enter a trade in the wave chart, you need to wait for closing the second green bar. The green wave is higher than the red one and the reversal is confirmed. The best entry into the trade is possible at the 62.40 level;
- The right chart with imbalances shows us a big buying cluster in the reversal bar with a multiple green imbalance above it and a huge positive delta at the level of the day’s low. All these three signs confirm the reversal much earlier than the wave chart at the 62.25 level. Moreover, the price tests this level twice, creating profitable possibilities for an entry into the trade. The profit of 0.15 cents for an oil contract at the current rate is about RUB 100 per contract. It is a pleasure to get additional money bonus using unique indicators.
Summary
Imbalances is a rarely used type of a chart. You don’t hear much about it. If you start increasing your profit in 2 times, would you start to speak about your secret on every corner?
In any case, a better understanding of modern technologies and ability to use them create a competitive advantage and allow being among 10% of successful traders.
The trading and analytical ATAS platform allows each trader setting the working space, which corresponds with both the market nature and personal trading style in the best possible way.

