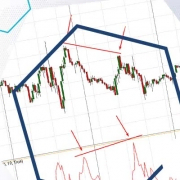

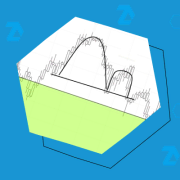
The inverted cup and handle is a bearish chart pattern that signals a potential price drop once it is completed. At first glance, this basic pattern may not seem particularly interesting to traders practicing regularly. However, analyzing it through cluster charts offers deeper insights into the reasons behind the bearish price movement. Specifically, it highlights […]
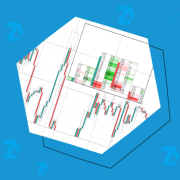
A bull trap is a market scenario with a deceptive price increase. Traders start buying the asset, expecting the uptrend to continue, but the price soon reverses and begins to fall. As a result, those caught in the trap end up closing their positions at a loss. Bull traps are common across all markets and […]
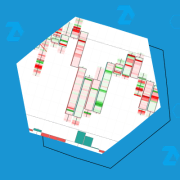
Footprint is a format of the exchange chart that accurately displays information about executed trades, including time, price, volume of buys and sells. This article aims to help traders gain a competitive advantage using footprint charts. Beginners will be able to quickly progress along the learning curve, while more experienced traders will find new ideas […]
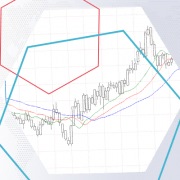
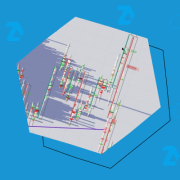
The subject of our today’s article is the CCI indicator. This article is another one in the series of publications about technical indicators. What is interesting about the CCI indicator? Read in this article: what CCI is, definition and calculation formula; how to trade using the CCI indicator – examples and testing using historical data; […]
This is another article on the topic of VSA and cluster analysis. Earlier we have considered: Bag Holding and End of Rising market patterns; No Demand and No Supply patterns; Buying and selling climax patterns. In each previous article, we have grouped two patterns that are in many ways “mirror images” of each other. Shakeout […]