Tag Archive for: Trading patterns theory and practice

Piercing Line Candlestick Pattern

Piercing Line Pattern: How to Trade with the Piercing Line Trading

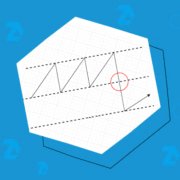
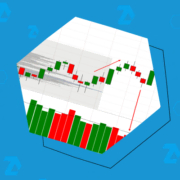
The Piercing Line is a two-candle reversal pattern in candlestick analysis that typically appears at the end of a downtrend, indicating a possible shift toward an upward movement. The pattern is sometimes referred to as the Piercing pattern.  Trading the Piercing Line pattern involves making decisions against the prevailing trend, which carries higher risks. This article […]

FVG Trading

FVG Trading: what is Fair Value Gap, meaning, strategy

Fair Value Gaps (FVG) are impulse price movements caused by an imbalance between buyers and sellers.  This article provides a practical guide with examples of what a FVG is, how to identify it on a chart, and how to use this pattern in trading. You will also learn how to apply a strategy using the […]

How to profitably trade on Wolf Waves

Wolfe Wave Pattern: How to profitably trade on “Wolf Waves”

Wolfe Waves are a trading pattern developed by Bill Wolfe. This article provides a comprehensive guide to trading using this chart pattern. Read more:  How Wolfe Waves Work Identifying Wolfe Waves on a Chart Wolfe Wave Indicator How to Trade Wolfe Waves: General Rules Examples on Charts Trend Trading Trading Trend Reversals What Is the […]

The Megaphone Pattern

Megaphone Pattern: The Best Chart for Trading

The megaphone pattern is a chart formation that looks like an expanding triangle. It appears on the charts of stocks, currency pairs, or other financial instruments, and is characterized by widening boundaries where the highs and lows move in opposite directions, forming a shape similar to a megaphone. Read more: Examples of the Megaphone Pattern […]

What Is an Inside Bar

Inside Bar Pattern: What Is and How to Trade It on Footprint Charts

In trading, an inside bar is a pattern where a candle is fully contained within the range of the previous candle (bar). The high is lower than the previous bar’s high, and the low is higher than the previous bar’s low. Low of the previous bar < Low and High of the current bar < […]

Trading bull traps for beginners

Bull Trap in Trading. What It Is, How to Avoid It, and Profit From It

A bull trap is a market scenario with a deceptive price increase. Traders start buying the asset, expecting the uptrend to continue, but the price soon reverses and begins to fall. As a result, those caught in the trap end up closing their positions at a loss. Bull traps are common across all markets and […]

VSA and cluster analysis. Shakeout and upthrust patterns

This is another article on the topic of VSA and cluster analysis. Earlier we have considered: Bag Holding and End of Rising market patterns; No Demand and No Supply patterns; Buying and selling climax patterns. In each previous article, we have grouped two patterns that are in many ways “mirror images” of each other. Shakeout […]

Parallel channels in trading

Parallel channels are an underrated pattern of technical analysis. When used with instruments for analyzing exchange volumes, parallel channels can become the basis for developing an effective trading strategy. Read more: What parallel channels are Why they work. Examples on history Advantages and disadvantages How to improve parallel channel trading with ATAS Tips for beginner […]

Как и зачем проводить тестирование в трейдинге

What does a test mean in trading?

In the articles of technical analysts for the forex market, you can find conclusions about some test like: “On Friday, the price fell and tested the 200-hour moving average” What does it mean? Read in the article: What a test means in trading. Example 1. Tests in VSA. Example 2. Tests on Mondays. Example 3. […]

Отскоки в трейдинге. Что такое отскок дохой кошки

Bounce in training. What is a Dead Cat Bounce?