Unfinished auction. What it is?
Unfinished auction is not a very popular term. You cannot find much about it in the Forex textbooks for beginners. Traders develop and learn about the unfinished auction only after gaining some experience and knowledge on a real exchange.
This article will tell you about the theory and practice of the unfinished market auction. We will start with basics and finish with the ideas of how to make money.
Read in this article:
- Introduction into the auction theory;
- Auction in clusters;
- Unfinished auction indicator;
- How to use the indicator. Examples.
Introduction into the market auction theory.
Earlier we already wrote in detail about the theory of the market auction on the exchange. However, before we start discussing what an unfinished auction is and what its essence is, let’s briefly go over the basics. Key points:
- When executing trades on the exchange, the buyers and sellers take part in the market auction. The buyers create the market demand, while the sellers produce the supply. There is a permanent dynamic interaction between them, which pushes the price in a certain direction.
- The difference between the powers of demand and supply creates the market disbalance. The market disbalance becomes even when the price reaches the levels, at which it becomes attractive to the opposite side.
- An auction in one direction ends with the last buyer or last seller. The end of an upward auction is the beginning of a downward auction and vice versa.
- Volumes, which are formed at key levels, point to a degree of involvement of buyers and sellers; they show us the degree of balance or disbalance in the market. The potential of development of a focused movement depends on the degree of disbalance.
- While moving up or down, the price creates the asset’s fair value area. Specific features of such areas are:
- increased horizontal volume;
- long-time price holding within a certain range.
- As soon as the market has set a range with extreme points at both sides, it starts trading within this range in order to determine the fair price. The market is traded between these extreme points until the price moves outside the upper or lower extreme point.
Auction in clusters.
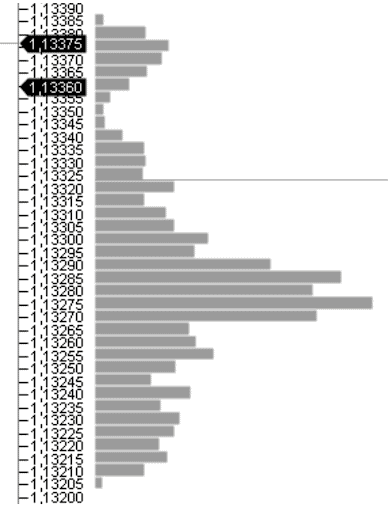
The exchange trades are executed at different price levels and they form the so-called horizontal volumes, that is the traded volume, which takes place at each specific price level. Visually, such a volume could be represented in the form of a bar chart.
The bar chart of horizontal volumes could be analyzed with the help of the Market Profiles indicator, and also with the help of the cluster mode of the chart display.
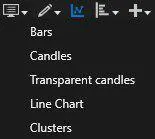
In order to enter the cluster mode, load the ATAS platform and select Mode and Clusters in the chart window.
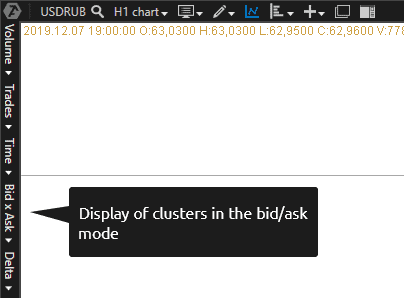
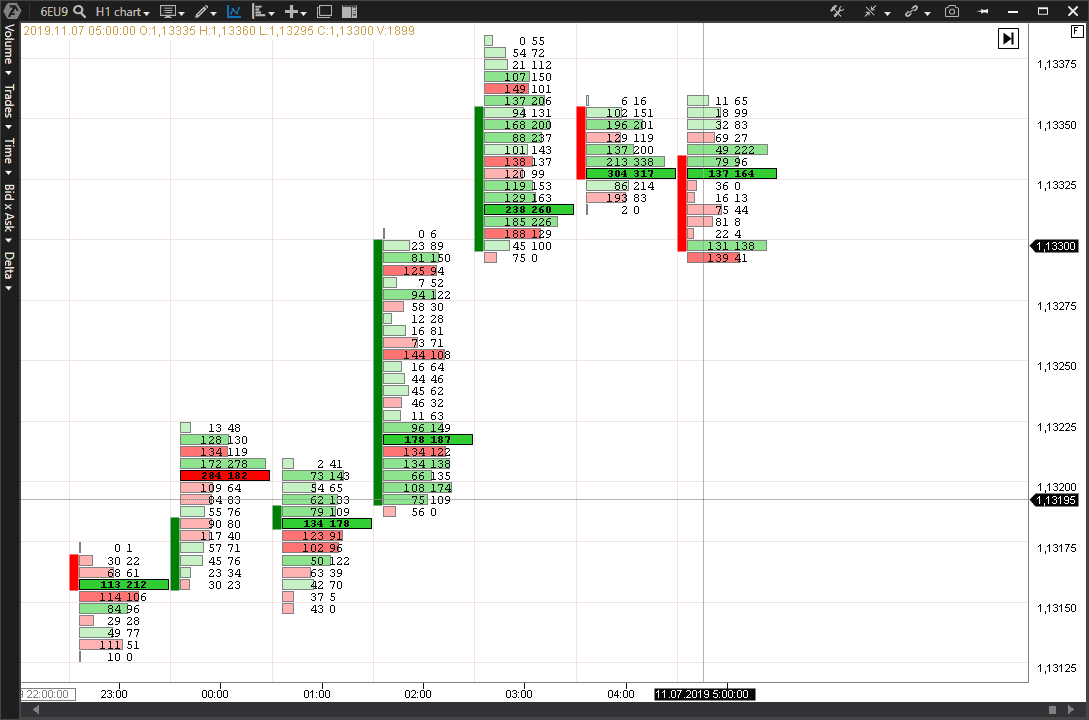
The chart is displayed in such a way, so that each candle reflects the volumes of price levels with the division into bid and ask. If it is not so, select the Bid x Ask setting.
The cluster mode provides information about how the market auction was conducted at each price level:
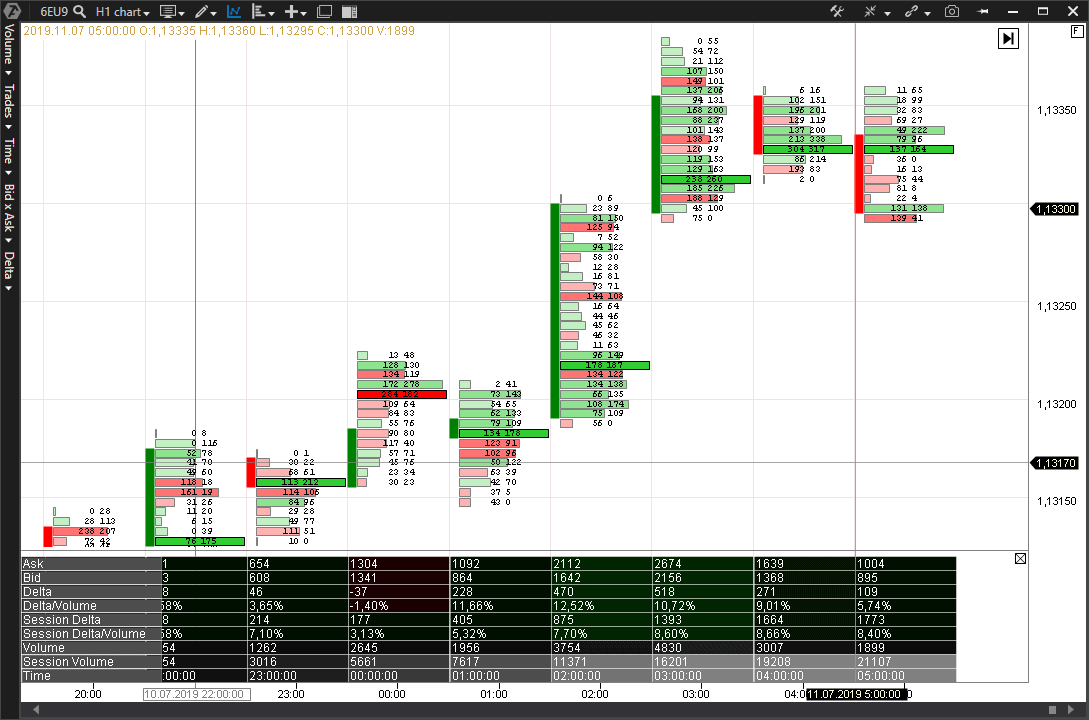
We can add the Cluster Statistic indicator to the chart to get more information.
The Cluster Statistic indicator of the ATAS platform resolves the complete information for each bar in the following components:
- Ask (market sells);
- Bid (market buys);
- Delta (points to a predominance of one of the sides. If the value is positive, the number of market buys is bigger, if negative – the number of market sells is bigger);
- Delta/Volume (shows the percentage the Delta takes in the general volume of all trades. This indicator actually tells us about the degree of predominance in activity of one or the other side. For example, the value of 100% with the negative delta will tell us that there wasn’t even a single active buy in the bar);
- Session Delta (the sum of all deltas from the beginning of a trading session);
- Session Delta/Volume (shows what percentage the Session Delta takes in the general Session Volume;
- Volume (accumulated volume in each bar);
- Session Volume (accumulated volume from the beginning of a trading session);
- Time (time of the beginning of formation of each bar).
If you do not need some of this information, you may turn it off.
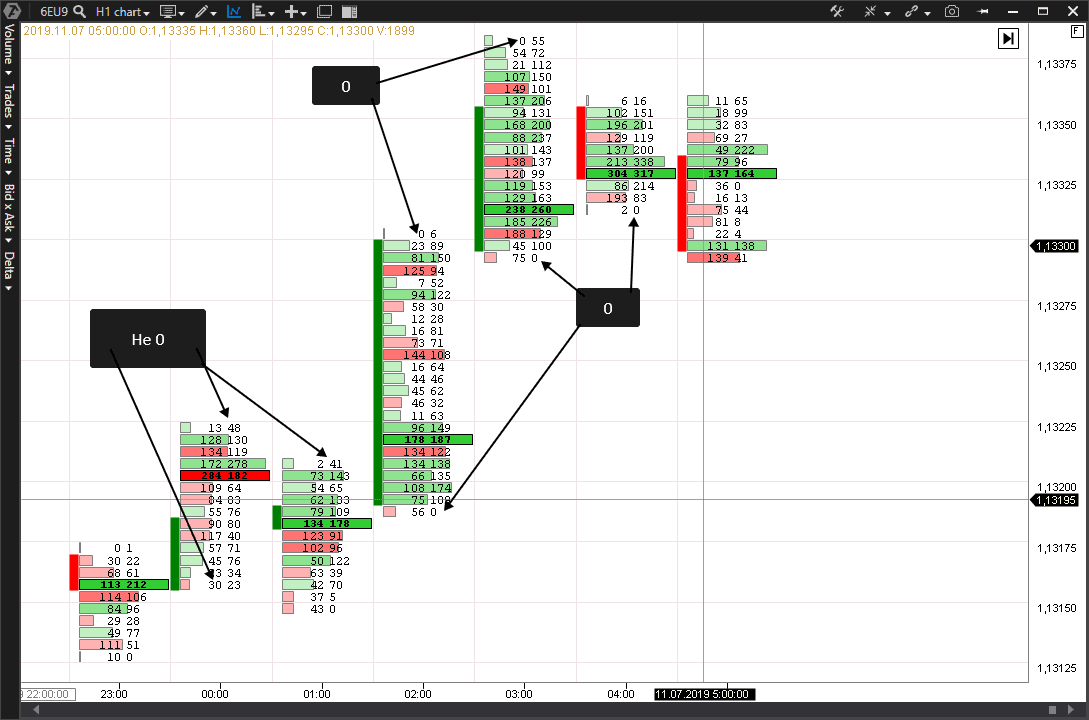
And now note that the majority of the bars have zero bid values at the high level and zero ask values at the low level. Moreover, some bars do not have zero values at extreme points.
The bars, which have zero values from one of the sides at the extreme points, characterize a finished auction. The upward price movement takes place when all orders are taken at the ask price and orders are posted at the bid prices. As a rule, there are no bid trades at the candle’s high and no ask trades at the candle’s low.
In the event the extreme price level in a bar contains both buys and sells, it tells us that the auction has not been finished. Such a situation is called an unfinished auction, the sign of which is the availability of bid trades at the high level or availability of ask trades at the low level of a candle.
What an unfinished auction means?
Availability of an unfinished auction could mean that the price movement has not yet been exhausted and there is a high probability that the price would come back to this level soon.
How to find an unfinished auction in a chart?
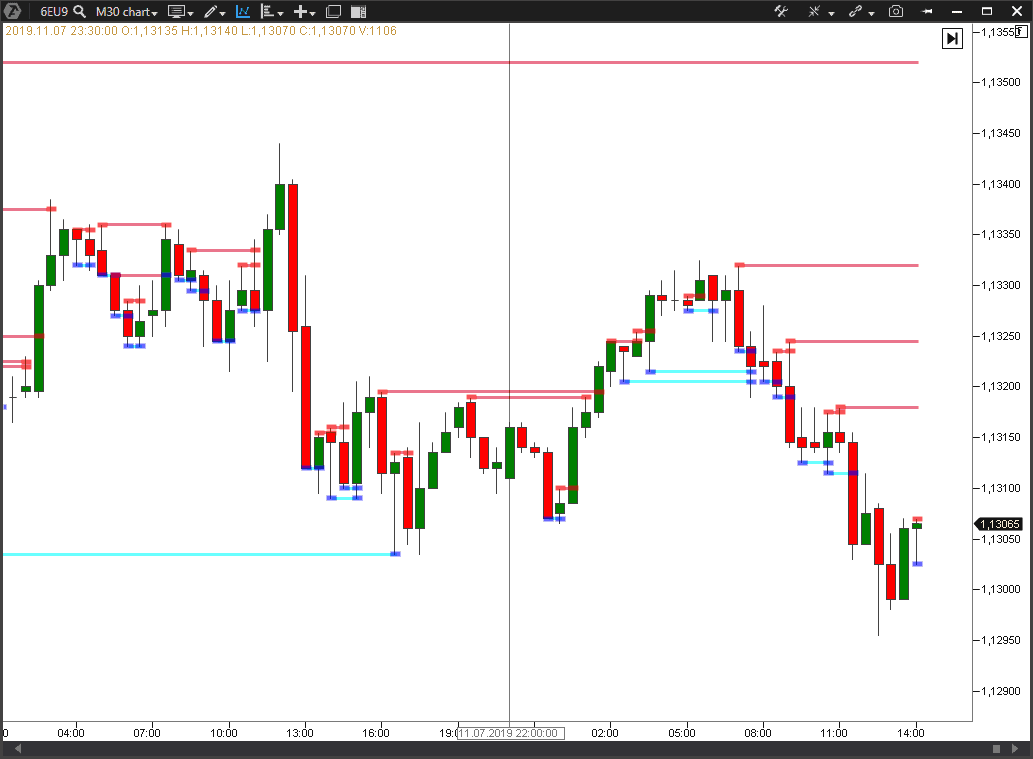
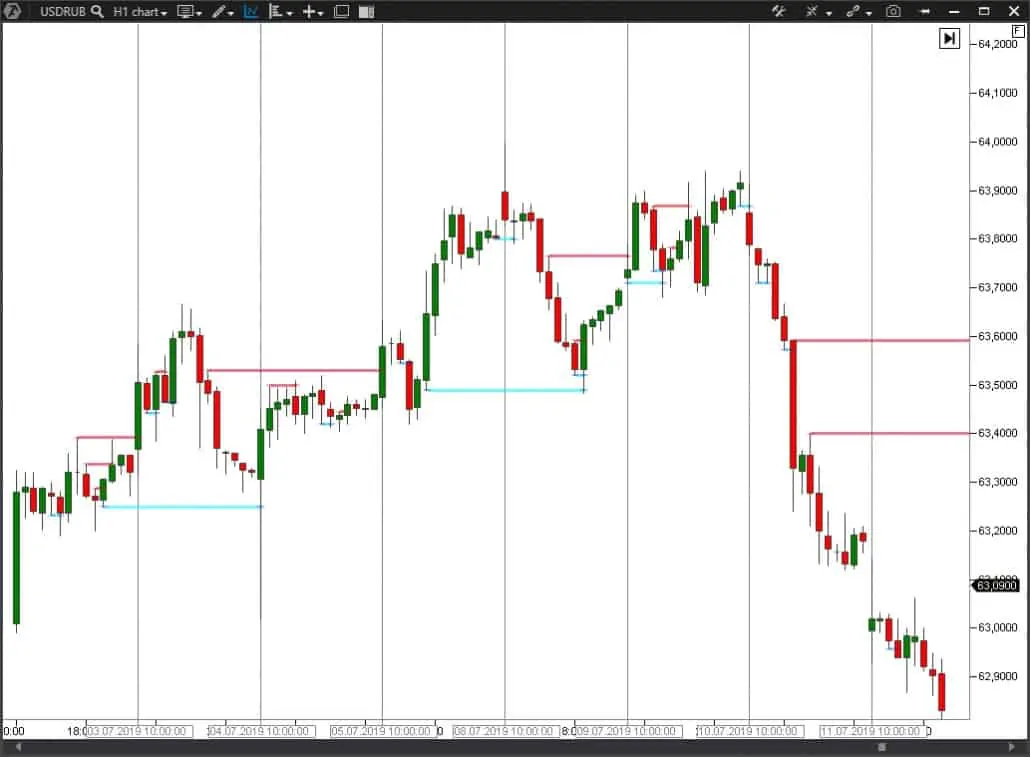
The Unfinished auction indicator of the ATAS platform finds such moments in a chart automatically. If this indicator is added to a chart, all unfinished auctions are marked with lines until the price comes back to this level again.
The indicator works on any timeframes and in different modes of the chart display. However, the longer the timeframe is, the less unfinished auctions would be displayed in a chart.
How to set the Unfinished auction indicator?
Download the free test version of the ATAS platform right now.
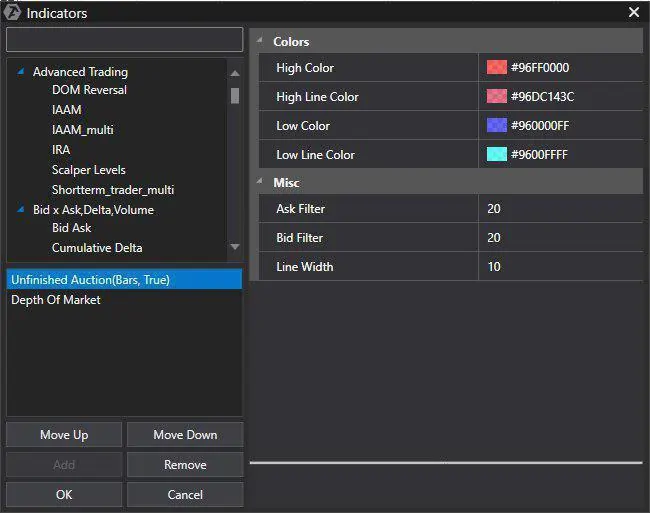
In order to add the indicator to the chart, you need to:
- press Ctrl+I;
- select Unfinished Auction in the section of technical indicators.
The indicator has the following settings:
- the volume filter sets the sizes of asks and bids, exceeding which the indicator will be displayed in the chart. Besides, the ask is displayed only for the bar’s high and bid is displayed only for the bar’s low. A change of the filter’s value allows to determine the strength of one or the other extreme point;
- thickness and colour of the displayed lines.
Examples of trading strategies with the use of the Unfinished Auction.
Let’s discuss how to make money on unfinished auctions.
If you monitor the indicator and price in different markets, you may note that:
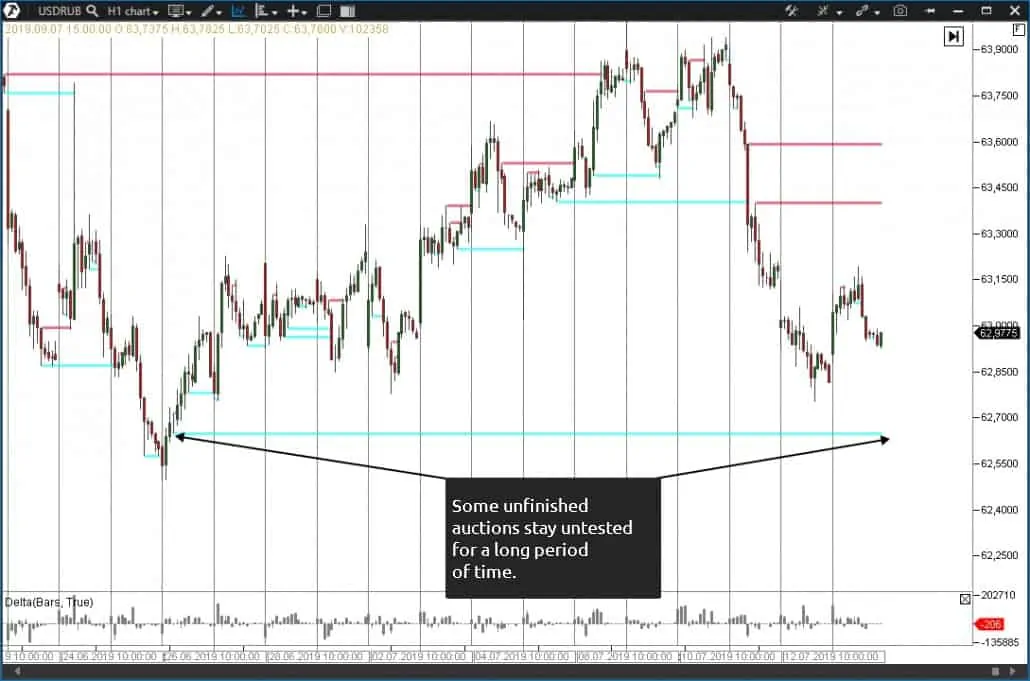
- the price comes back to the levels where the auction wasn’t finished;
- these levels could serve as support or resistance lines.
However, there is no 100% guarantee (and there couldn’t be) that the price will definitely come back to the levels to finish the auction. Unfinished auctions could be left without testing during long trend movements.
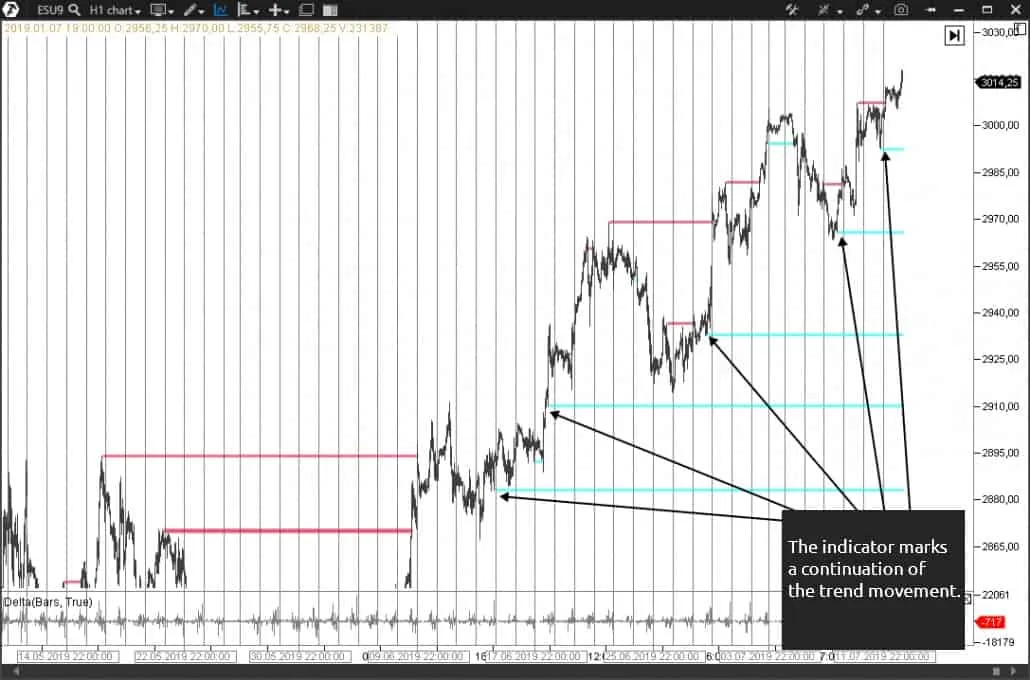
The Unfinished Auction indicator could be used as a confirmation for further trend movement in a combination of the trend strategies. One should expect that the price would continue its movement towards the main trend after the price is fixed above/below the unfinished auction.
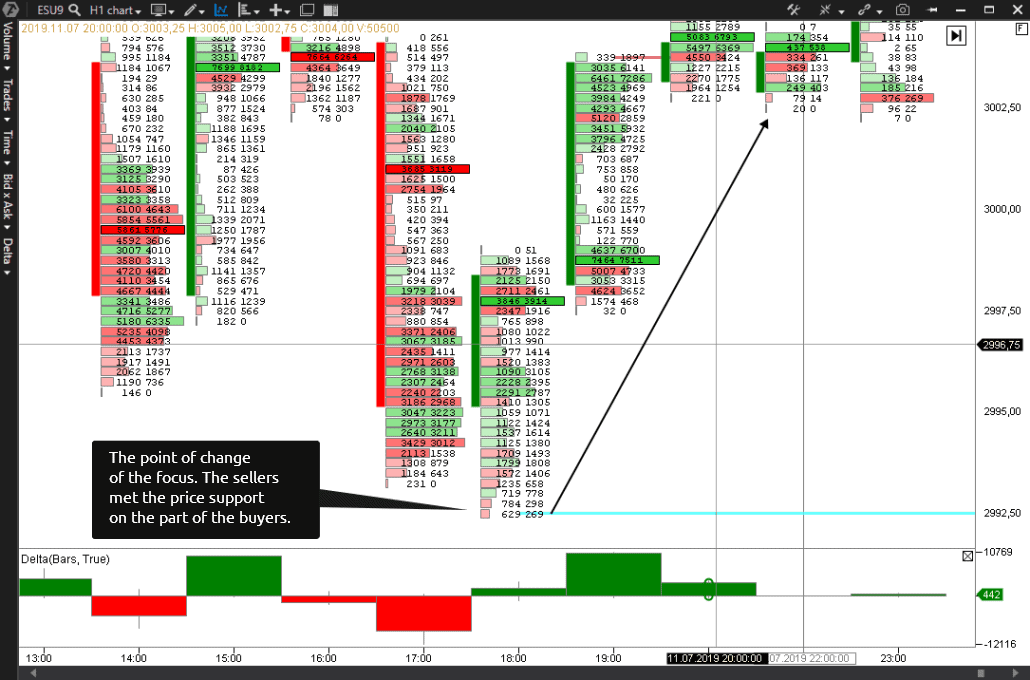
It is important to see who has the advantage at a certain moment when using short-term strategies. Let’s assume that the price moved down for some time and the indicator sent a signal about emergence of an unfinished auction at a certain moment.
The situation in this example tells us that the sellers retreat and the buyers start their advance. The cluster chart shows in this example that the selling volumes ‘dry out’ in the point of emergence of the unfinished auction and the price reverses in the opposite direction.
Summary.
In this article we’ve considered some situations connected with formation of an unfinished auction. Identification of such situations helps us to foresee the future price action. However, there is a nuance.
You can hardly consider the Unfinished Auction an independent instrument, sufficient for making a well-considered decision. It is necessary to understand, when you use this indicator, that the following factors exert the principal interest on the price: fundamental data, trend direction, accumulated volume, behaviour of the market participants and others. That is why, use the Unfinished Auction in the context of the general market or in relation to important levels, from which you want to open your positions. And let the chance be on your side.

