What is a difference between a sportsman and a trader? A sportsman asks why volumes decrease and weight stays the same. And a trader asks why volumes decrease and price stays the same.
This article contains all information required for understanding what a horizontal volume is and how it should be used for raising trading profitability:
- Volumes: horizontal and vertical
- History of introduction of horizontal volumes
- Horizontal volumes – indicators
- Terminology
- Horizontal volumes: strategy
- Advantages and disadvantages of horizontal volumes
- FAQ
- How to learn to conduct horizontal volume analysis in trading
Volumes. Horizontal and vertical
Professional traders use the volume indicator in their work practically without exceptions. They build their strategies of trading by volumes on the basis of analysis of its dynamics.
The volume indicator sums up trades executed at a stock exchange in terms of money, contracts, coins or shares.
The volume could be:
- vertical. It reflects the amount of trades executed during a certain period of time. The vertical volume is shown, as a rule, in the bottom part of a chart as a bar chart. For example, if you view a Apple stock chart on hourly timeframe, the volume would show the total cost of all shares, which were bought/sold during this hour.
- horizontal. It reflects the amount of trades executed at a certain price level. The horizontal volume or, as it is also called, volume profile could be located both in the left and right parts of a chart (and some profiles could be located even in the middle of a chart, as it will be shown in the examples below). For example, if you view a gold futures trading chart with the horizontal volume indicator, then each level in the indicator shows the total cost of all contracts, which were bought/sold at this level.
Vertical volumes were used by traders as early as in the beginning of 20th century.
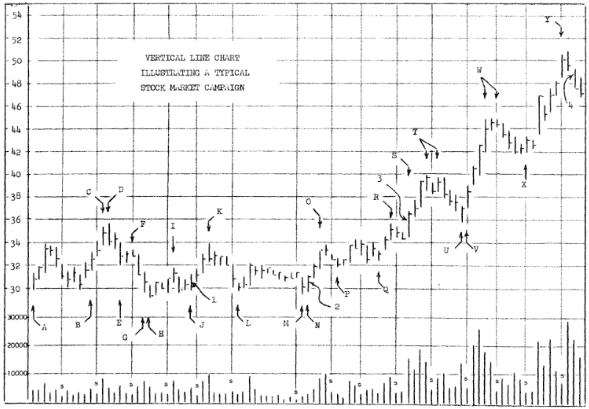
The Picture shows the Richard Wyckoff chart of the year 1931. There is a bar chart of day volumes in the bottom of it.
Horizontal volumes started to be used much later in trading.
History of introduction of horizontal volumes
Peter Steidlmayer introduced the Market Profile to the public in 1984 as a visual representation of the market movement by price levels over time. In principle, the Market Profile and horizontal volumes display the same essence – activity of traders at each price level.
How did Peter Steidlmayer build the Market Profile? Let us analyze the chart.
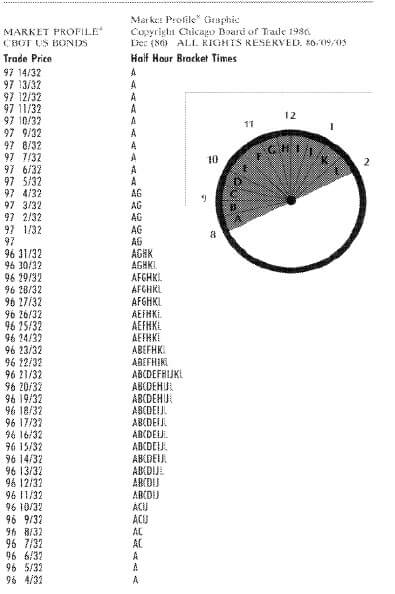
X-axis shows prices. Y-axis shows symbols that correspond with a time span (Steidlmayer offers to use 30-minute time spans), starting from the moment of opening of a trading session:
- Symbol A means a period of time from 8:00 until 8:30
- Symbol B means the next half an hour – from 8:30 until 9:00
- and so on until the symbol L
Each symbol is called TPO:
- Time;
- Price;
- Opportunity.
In the image above, the market opened at the 97 14/32 level (the price uses fractions, that is – “fourteen thirty-seconds”) and went down to 96 4/32 during the first 30 minutes. Sellers dominated the market and the price went down. The market turned around and went up from 96 11/32 to 96 23/32 during the B period and buyers started to resist the pressure of sellers. The price initially went down to 96 7/32 but then went up to the level of 96 21/32 during the C period. The market turned around again and the price went down to the level of 96 11/32 during the D period. The day session ends with the L period when the price turns around and goes down from 96 30/32 to 96 13/32.
For better understanding of the approach, have a look at Picture 5 where a bar chart with 30-minute period forms the market profile in the image below.
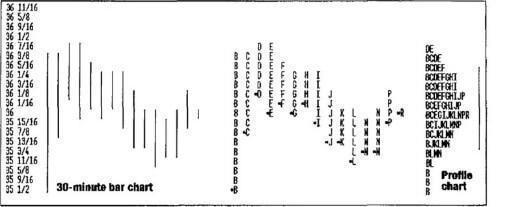
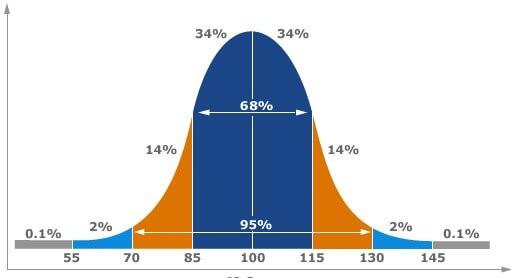
After observing the Market Profile development directly at the Chicago Board of Trade, Steidlmayer made a conclusion that the market tends to come to the final denominator – the state of balanced distribution. In this case, the Market Profile takes the shape of a bell curve.
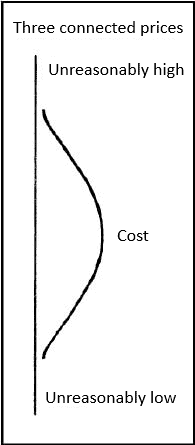
Bell center – area of high volume, which says that both buyers and sellers are satisfied, in general, with the price. This is a balance area with approximately equal numbers of buyers and sellers.
Correspondingly, the balanced market is a market, which found a fair price and trades are distributed around it.
Bell ends – areas of low volume, which say that the search for a fair price is going on.
Correspondingly, the imbalanced market is a market, which moves in a focused manner because it searches for a fair price. Steidlmayer calls this imbalance a vertical distribution.
According to Steidlmayer, every time the market is balanced (developed), it is ready for focused movement (distribution).
Steidlmayer had many followers who enhanced and interpreted his theory:
- James F. Dalton – the author of the “Mind Over Markets” book;
- Donald L. Jones – the author of the “Value-Based Power Trading” book;
- Tom Alexander – the author of the “Trading Without Crutches” book.
Development of information technologies boosted the use of the Market Profile theory.
Horizontal volumes – indicators:
Electronic trading and powerful market analysis tools have drastically changed how market profiles are represented. Thanks to the revolutionary advancements in computing power, computers now calculate horizontal volumes in real time with precision down to individual trades.
This is exactly how the trading and analytical platform ATAS operates. Among similar software products, ATAS offers the greatest freedom and flexibility for exploring horizontal volumes.
See for yourself. Download the free trial version of ATAS right now.
The main features of ATAS for working with horizontal volumes are:
- Histogram of horizontal volumes;
- Market Profile indicator;
- Profile drawing objects;
- Footprint. Horizontal volume within a candle.
Let’s take a closer look at these tools and then discuss Peter Steidlmayer’s theory.
Horizontal volume histogram
Horizontal volumes (also referred to as “market profile”) are depicted on the chart below in a semi-transparent blue color.
In the ATAS platform, this is represented by the Fixed Market Profile & TPO indicator. To add it to your chart, simply press Ctrl + F3. By default, the indicator will be displayed on the left side of the chart.
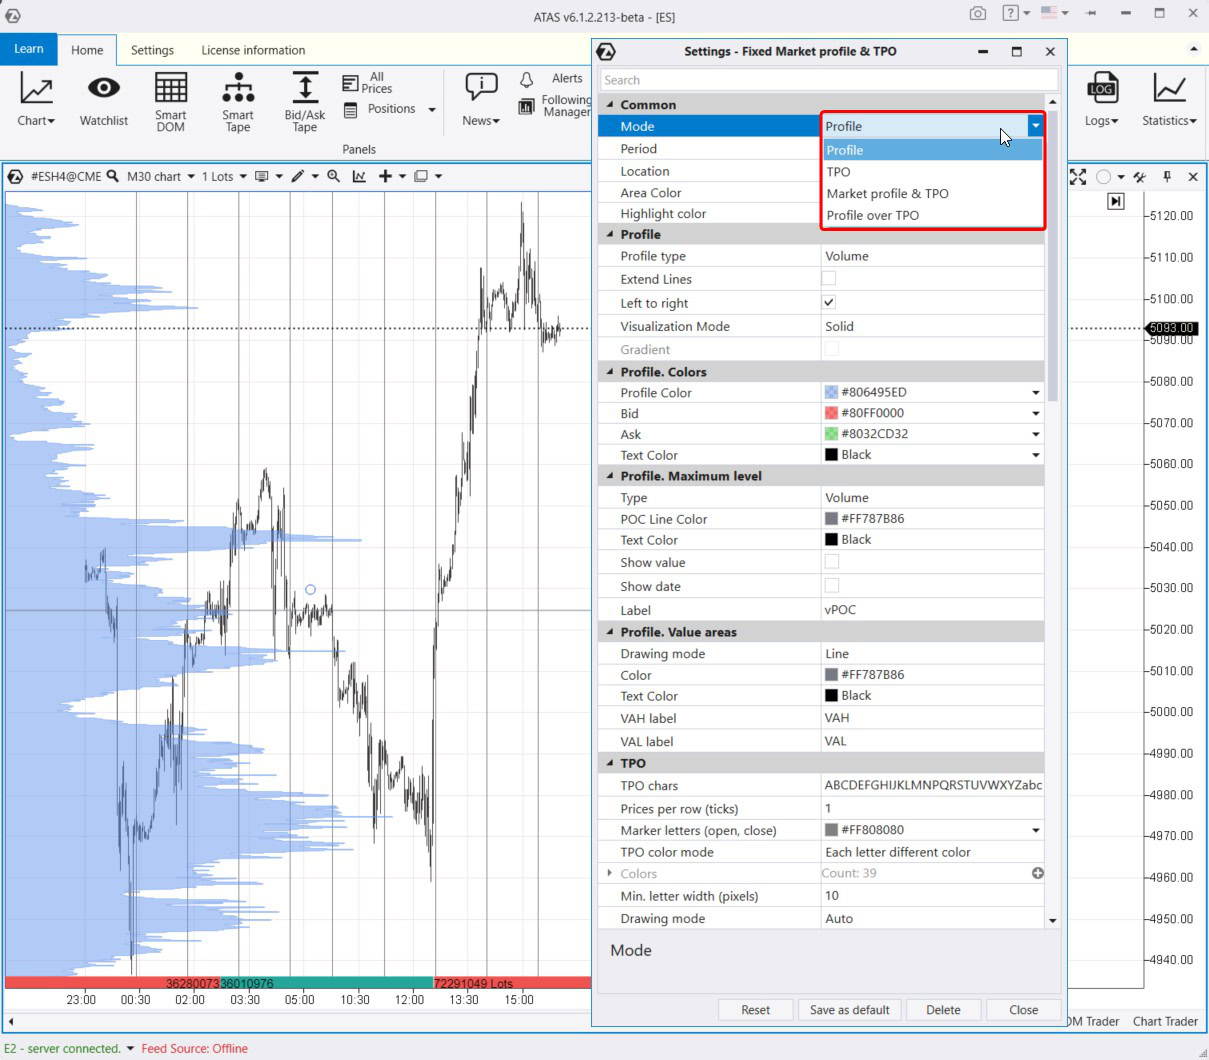
The Fixed Market Profile & TPO indicator has several settings. The first one is the Mode, which has 4 variations:
- Profile: the indicator is displayed in the most universal and commonly used form – as a profile.
- TPO: the indicator appears in the classic TPO format pioneered by Peter Steidlmayer.
- Market Profile & TPO: a combination of the two previous types.
- Market Profile Over TPO: overlaying the two previous types on each other.
In the ATAS trading platform, volume indicators (both horizontal and vertical) can be displayed not only as cumulative volumes but also in more detail – as bids/asks, delta, or trades. An example is shown in the screenshot below.
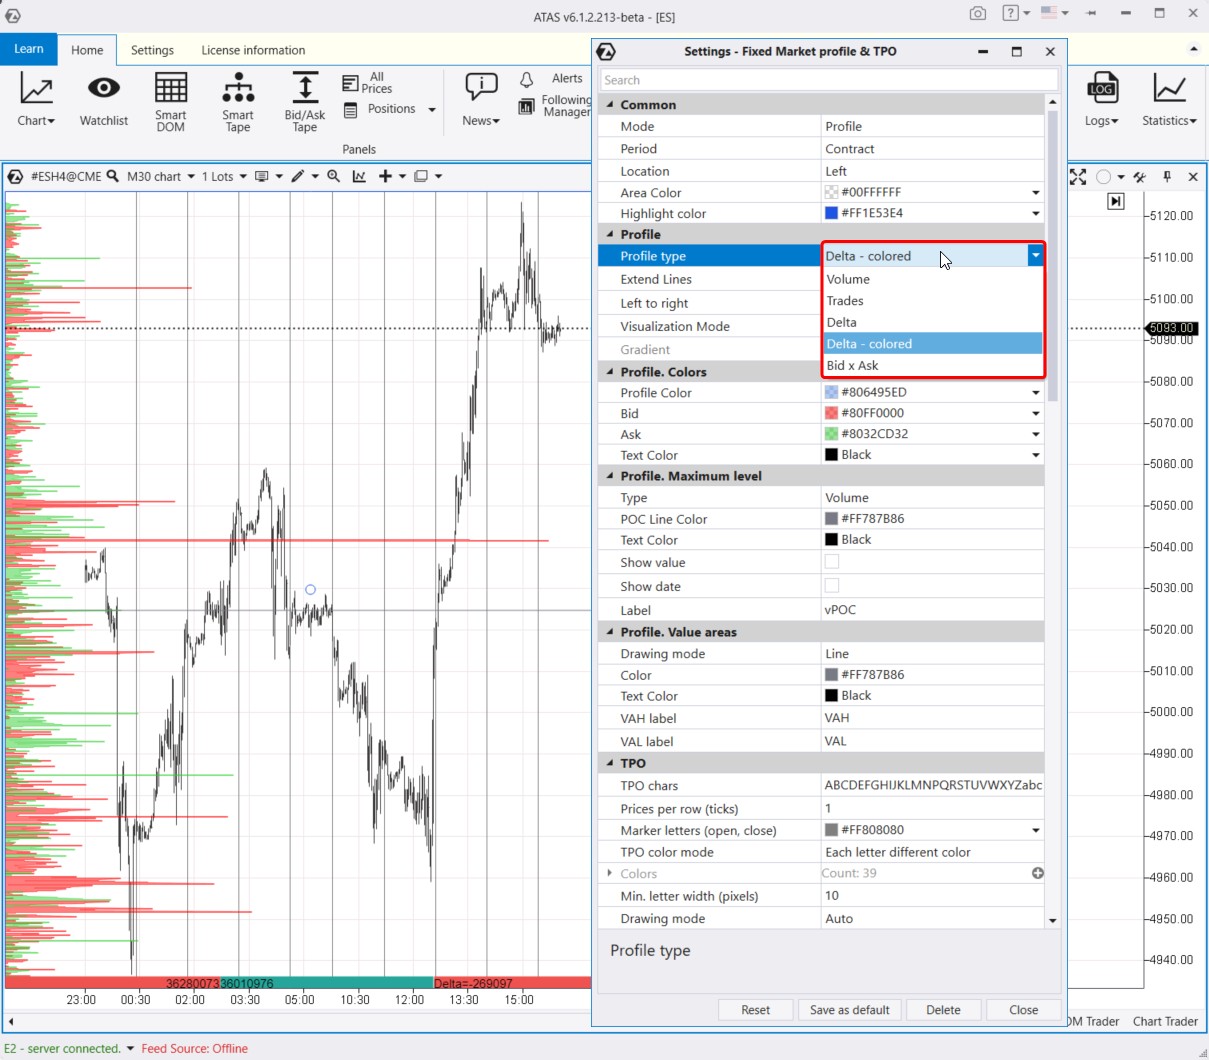
In this example, the Fixed Market Profile & TPO indicator shows delta at levels for the traded contract. To apply this configuration, select Profile Type – Delta Colored.
Horizontal volume indicator
To activate the horizontal volume indicator, press Ctrl + I (or click on the icon marked with the red arrow). Choose Market Profile & TPO from the list of available indicators.
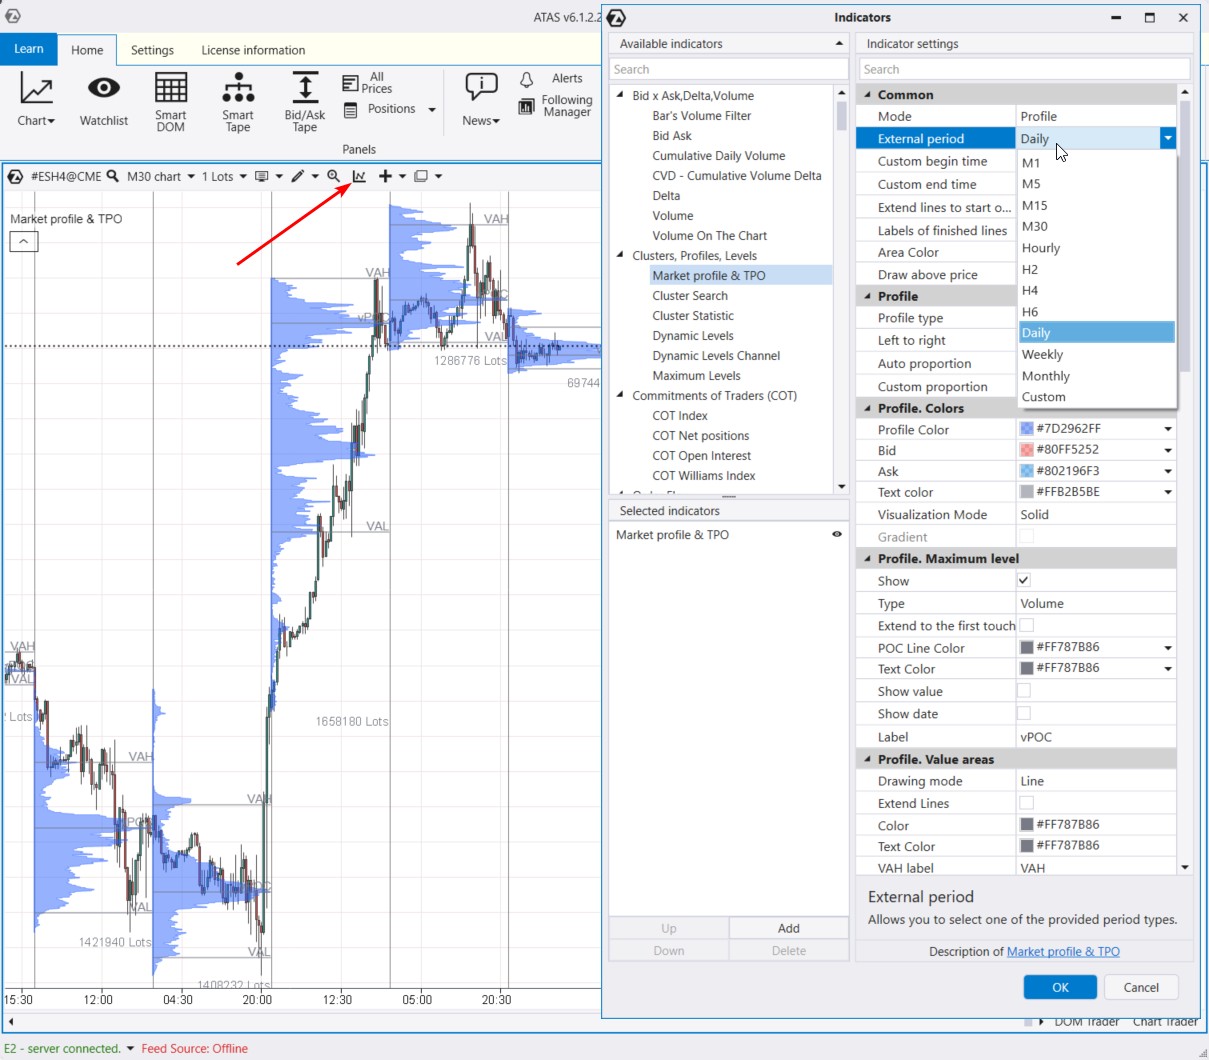
By default, the indicator is displayed for the daily period, but it is quite flexible. There are many possibilities for changing the period as well as adjusting the mode, profile type, colors, and other features.
More details about the indicator can be found in the Knowledge Base.
It is important to mention the Dynamic Levels Channel indicator is a derivative version of horizontal volumes, which appears as a channel, reflecting changes in POC, VAL, VAH lines over time.
Profile drawing objects
ATAS offers several tools for working with horizontal volumes, you can find them in the drawing menu.
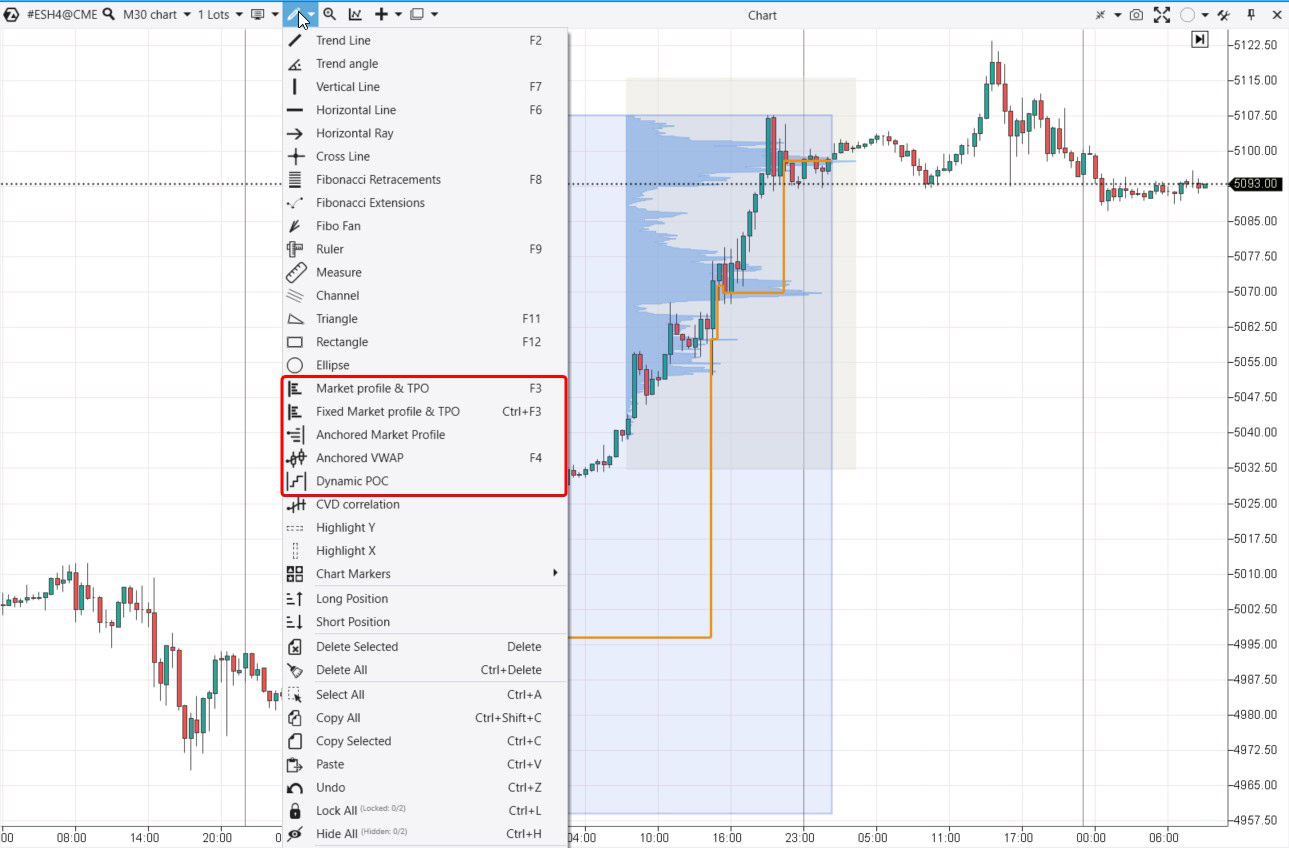
Market Profile & TPO
To access this tool, press the F3 key. Use your mouse to circle the area of interest on the price chart, and ATAS will generate a profile for that specific region. You can adjust the profile by moving it, changing its scales, and display settings. This flexibility makes it an invaluable tool for working with horizontal volumes.
Fixed Market Profile & TPO
This tool has been discussed earlier.
Anchored Market Profile
Another way to create an arbitrary profile is by using two vertical lines: these lines mark the beginning and end of the period for which ATAS will create the profile.
Dynamic POC
A drawing object that shows the changes in the Point Of Control (POC) level over time for a selected area of the chart as a broken line.
Footprint. Horizontal volume within a candle
The Footprint is a chart mode that enables ATAS users to analyze horizontal volumes. To switch from classic candlestick charts to the more advanced Footprint mode, press Shift+K or extend the chart using the time scale.
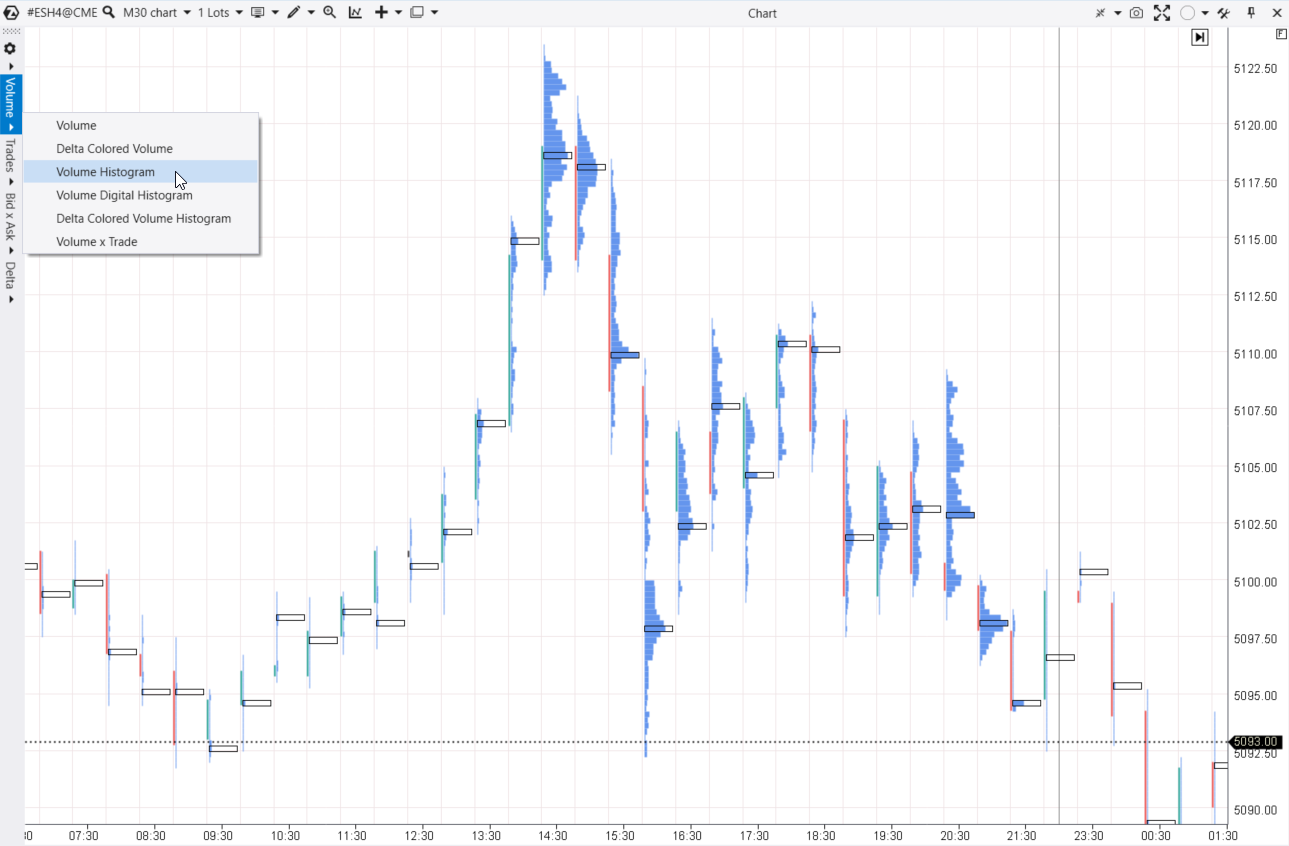
You will see a menu on the left where you can choose how to display horizontal volumes. For instance, in the chart above, we have the Footprint Volume Histogram, which lets you look inside each candle and observe the horizontal volumes within. The levels of maximum volumes are marked by default with black horizontal rectangles.
Horizontal volumes: terminology
Let’s clear up what VAL, VAH, and POC mean in horizontal volumes. These terms relate to the value area. To understand the core idea of the value area, let’s look at the diagram below:
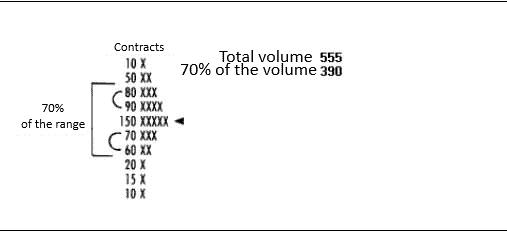
The value area represents a price range where 68% of the volume of completed transactions occurs. Why 68%? This figure is mathematically derived using the Gaussian normal distribution (for further details, consult math textbooks or Wikipedia).
Applying standard deviations to the market profile, we obtain the values of VAL and VAH, while the POC level is determined by the market itself:
- VAL (value area low) is the lower boundary of the value area. It is a key level within the price range, acting as support. As the price approaches this level, horizontal volume traders focus on market behavior — whether the price will break through VAL or reverse upwards.
- VAH (value area high) is the upper boundary of the value area. It is another key level within the price range, serving as resistance. When the price approaches VAL, horizontal volume traders focus on market behavior — whether the price will break through this VAH level or reverse downwards.
- POC (point of control). is the highest value on the market profile.
One of the core concepts in Peter Steidlmayer’s market profile theory is the “Initial Balance,” which refers to the trading range during the first hour of trading.
Steidlmayer categorizes days into five types based on how horizontal volume behaves relative to this initial balance.
- Trend day – horizontal volume predominantly moves in one direction, and the initial balance expands by more than double. An important feature of a trend day is closing near the extreme of the expanded range.
- Non-trend day – 85% of the day’s range is formed in the first hour, and there is minimal expansion of the range. The initial balance is narrow.
- Normal variation day — the initial balance expands by less than twice, and the closing is not far from the maximum expansion of the initial balance.
- Neutral day – the range expands in both directions, with expansion in one direction balancing expansion in the other direction.
- Normal day – there may be slight expansion of the initial balance.
Using this information, Steidlmayer attempted to forecast the potential development of the following day. However, further research by Donald Jones did not confirm any influence of the current day’s distribution shape of horizontal volumes on the subsequent day.
Horizontal volumes: strategy
Based on the positions of the three key levels (VAL, VAH, and POC), traders can use the following basic strategies for trading with horizontal volumes:
Reversal trades:
- from the middle of the value area up to VAH;
- from the middle of the value area down to VAL;
- from VAH down to the middle of the value area;
- from VAL up to the middle of the value area.
Breakout trades:
- upward on a breakout above VAH;
- downward on a breakout below VAL;
- as an alternative to breakouts – tests of the breakout levels.
The diagram below illustrates basic trading strategies with horizontal volumes (including stop-loss positions).
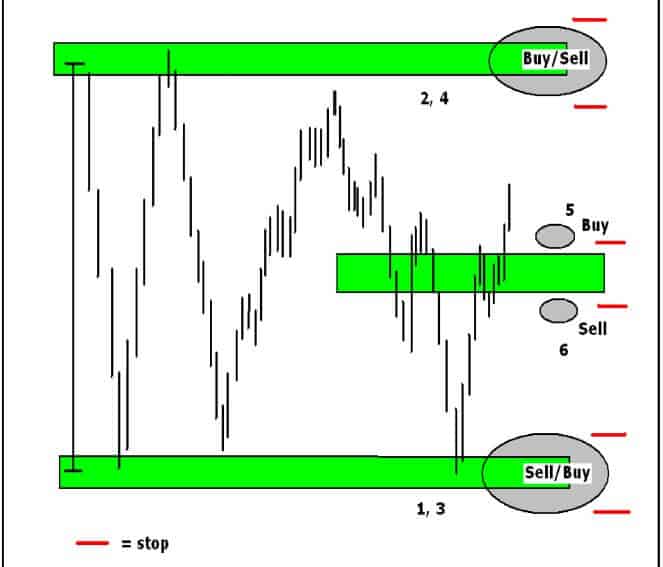
The strategies mentioned above are from classic trading literature. In real, “live” trading, you can use them as a foundation to develop your own strategy, tailored to the market specifics, personal preferences, and experience.
Example 1
The chart below shows a calm Monday morning in the ES futures market (E-mini S&P-500). The red arrows indicate the balance boundaries within which 90% of trades were made.
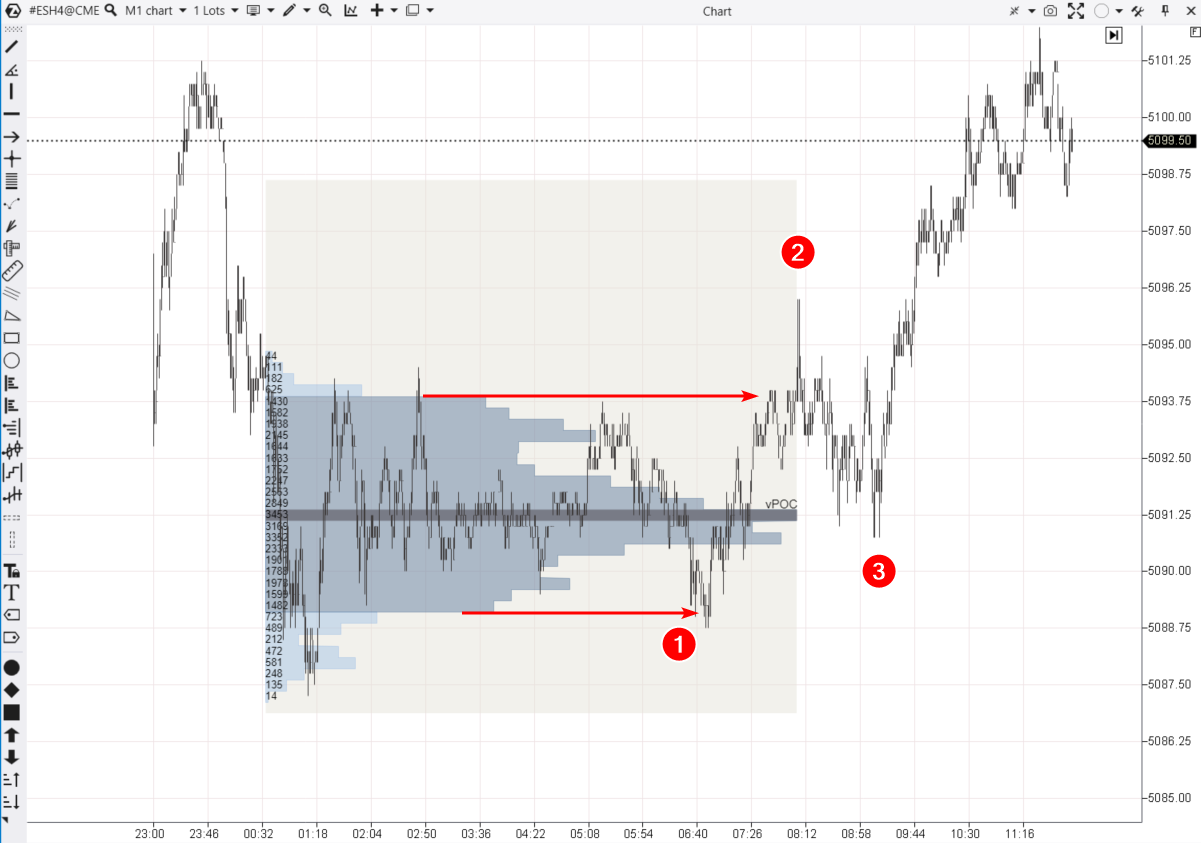
While the market, having formed a balance, was trading within the low volatility Asian session, a trader could decide to buy a contract (1) from the lower boundary of the value area (VAL) aiming for a return to the middle of the POC balance.
As the market became more active with the opening of European exchanges, the trader could adjust their strategy. The formation of a peak (2) well above the VAH indicated buyer activity. Therefore, the trader might decide to open a long position on a pullback from the POC (3) with the first target near the VAH and the second target around the Asian session high near 5105.
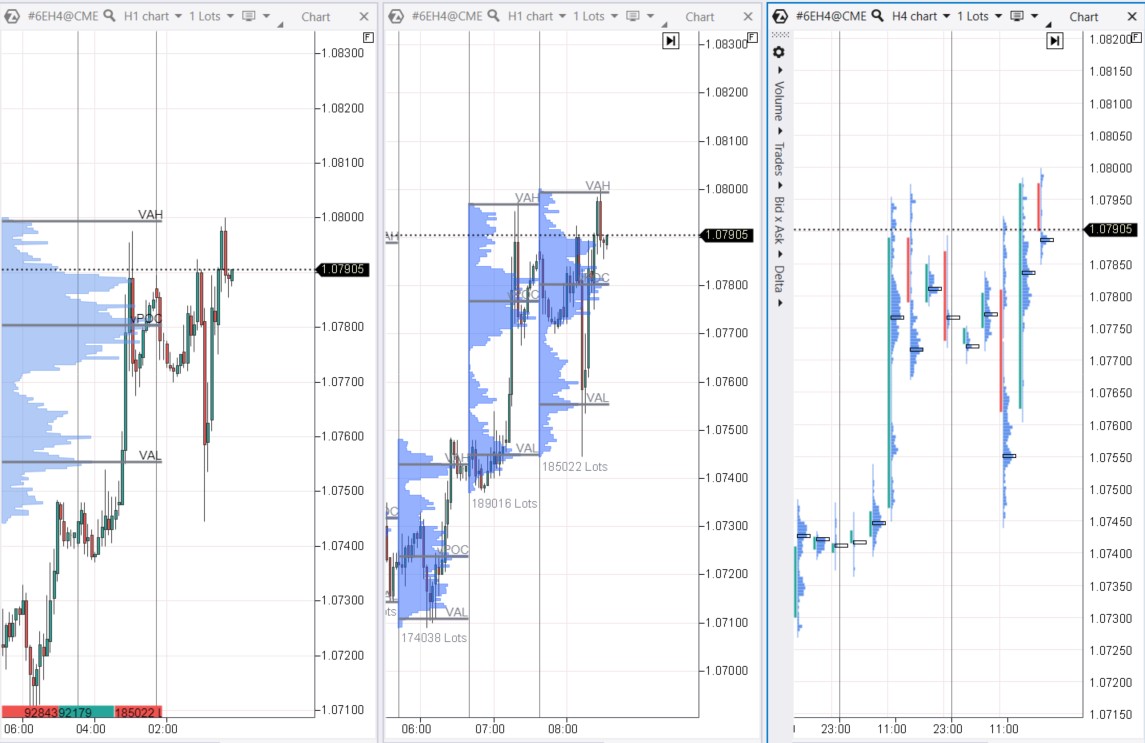
Example 2
Analyzing profiles over several days helps identify daily balances and imbalances. This gives a better understanding of market dynamics, suggesting where the price might move and pinpointing levels where opening positions can be done with lower risk.
The screenshot below shows a 30-minute chart of the Euro futures compared to the USD, using data from the CME exchange.
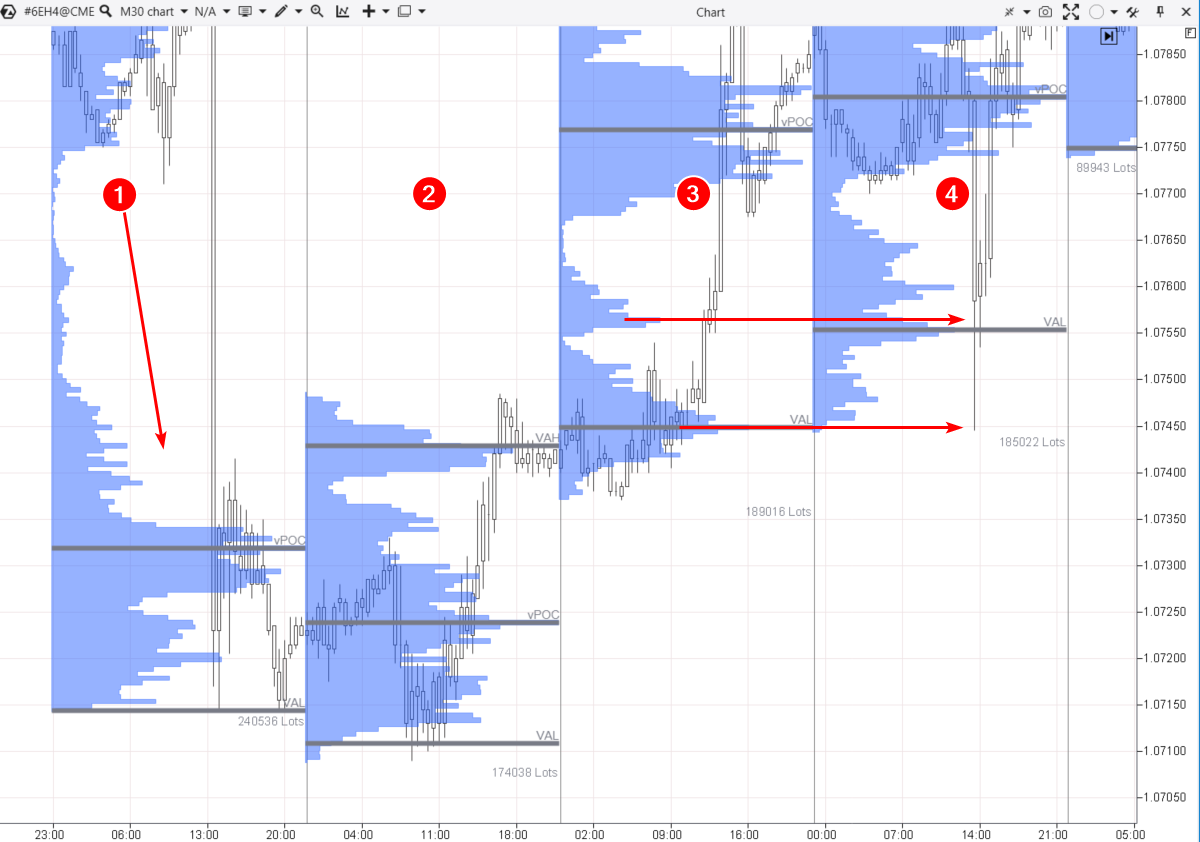
On the first day, the Euro experienced a sharp decline due to the strengthening of the USD following news about inflation in the US.
However, on the second day, the market closed above the POC levels of both the first and second days, which is a bullish sign. It suggests that the initial reaction to the inflation news was overly emotional.
The market activity on the third day confirmed these bullish signals.
Suppose we are at the beginning of the fourth day. What should the plan be for the day? If considering direction, long seems more probable. And if we are looking for entry points, there could be two notable volume levels from the third day (with the lower one tracing back to the second day). They are marked by arrows, suggesting a strategy based on rebounding from local POC levels.
The chart indicates that the lower arrow indicated the minimum of the fourth day, with accuracy down to a few ticks.
Example 3
This is the Bitcoin futures market, data from Binance exchange. Cryptocurrencies are an extremely volatile tool, and using horizontal volumes has its nuances. Traders should consider price spikes that are common for crypto.
The 5-minute chart below illustrates the formation of a balance (consolidation zone), where horizontal volumes have developed convexity. Additionally, the chart includes the Dynamic Levels Channel indicator, which displays only one POC line (in blue).
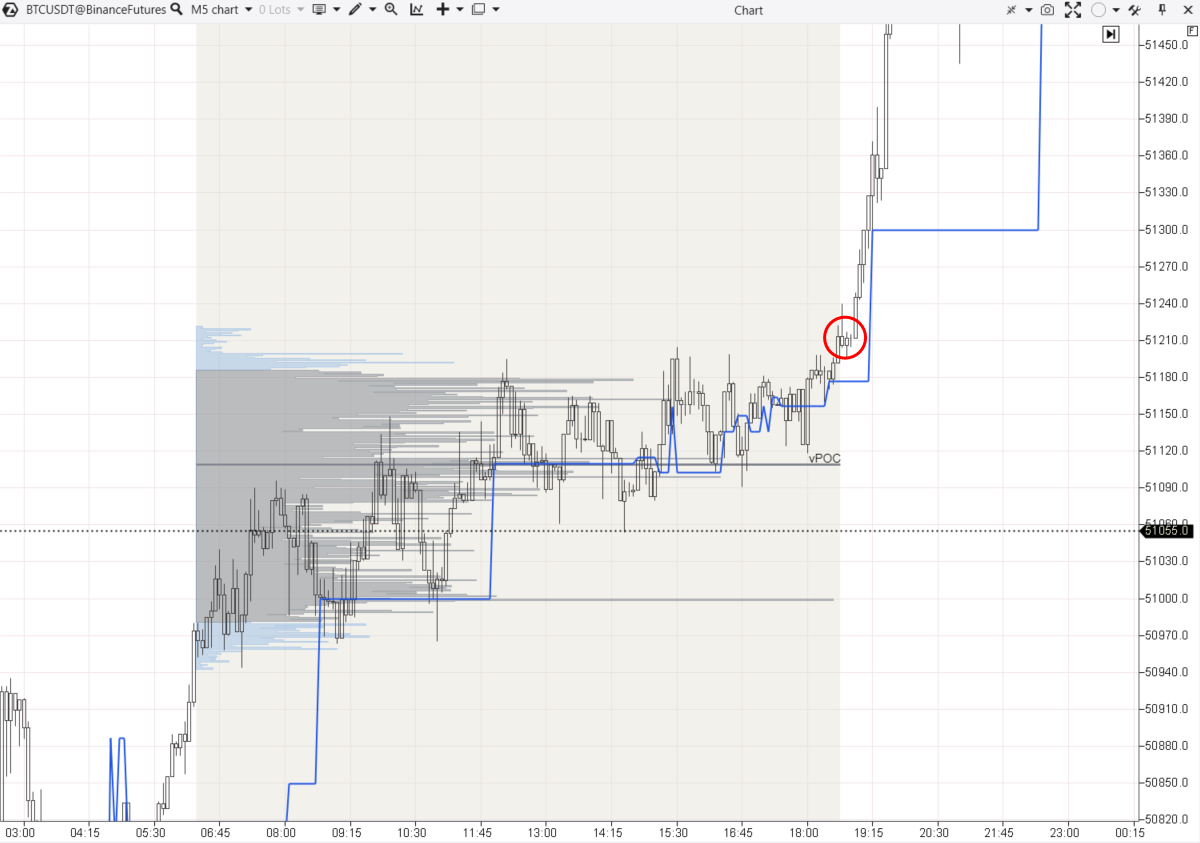
The blue line is gradually rising, indicating that trades within the value area are occurring at increasingly higher prices – a sign of a bullish market. Therefore, focusing on finding a long position on a breakout of the VAH was a justified decision.
Three candles could have served as the trigger for entering the trade as they closed above the VAH (circled in red), with a stop-loss placed below the point of control (POC) level.
Advantages of the use of horizontal volumes
- Better understanding and visual market state assessment;
- Efficient determination of the levels of support and resistance;
- Preliminary risk estimation for each trade and accurate determination of stops – immediately outside the Value Area boundaries;
- Forecasted profitability/risk relation. If we divide the Value Area into 8 parts (octants), the risk would be 1 octant and profitability – 3 octants;
- Well-reasoned point of entry into the market by a limit order;
- Availability of a simple and clear trading system (rules) and objective identification of own competitive advantages;
- Reduction of the number of trades and, consequently, reduction of commission fees.
Disadvantages of the use of horizontal volumes
- Wide stops when trading from POC (maximum volume areas);
- The price does not always reach the control levels;
- Waiting for trades, off-board location – the positional trading is not good for all.
FAQ
How to read horizontal volumes in trading?
When horizontal volumes form a growing convexity, it is a sign that the market is in equilibrium. Trades are executed without significant price changes because buyers and sellers agree that the current price level is fair.
If the horizontal volume (profile) is narrow, it indicates market imbalance. Convexity does not form on the profile because the price keeps moving, as one side (buyers or sellers) dominates, causing price changes, which is typical of trending markets.
Horizontal volume analysis enables you to observe where and how balances and imbalances are formed. Using this information, you can hypothesize how prices will change in the future (for example, when testing significant levels of horizontal volume).
What are POC, VAL, VAH, and the value area?
POC (Point of Control) – the highest level on the horizontal volume histogram.
Value Area – the zone where 68% of all transactions occurred. The value of 68% is considered academic, but it is better to adjust this parameter for different markets and personal preferences. To do this: in the main ATAS window, go to the Settings tab → Common Settings → Value Area Percent parameter.
VAH (Value Area High) – the upper boundary of the value area.
VAL (Value Area Low) – the lower boundary of the value area.
Horizontal volumes, where can you find them?
They show up wherever they are configured to appear. For instance, in the ATAS platform, these could be (examples shown in the screenshots below):
- horizontal volumes on the left side of the chart;
- horizontal volumes overlaying candles;
- or even replacing candles if the chart is in footprint mode.
How to learn to conduct horizontal volume analysis in trading
To improve your skills in market profile analysis, the following services and tools can be helpful:
Try Market Replay – a built-in simulator for traders. It assists in analyzing horizontal profiles, POC, VAL, VAH levels more accurately, and finding trade ideas as if you were trading in real time, all without risking your capital.
Additional tools. To reduce risks and enhance trading performance, combine horizontal volume analysis with:
- indicators below the price area: Bid Ask, Delta, Speed of Tape;
- footprint (cluster charts);
- Cluster Search, Big Trades, Stacked Imbalances indicators;
Smart Tape, DOM Levels (large levels indicator in the order book), and other ATAS platform advantages.
Download ATAS, professional software for working with exchange volumes. It is free. During the trial period, you will have full access to the platform’s tools. Experiment with horizontal and other volumes! Moreover, you can continue using the program for free even after the 14-day trial period is over, whether it is for cryptocurrency trading and/or learning, conducting market analysis.
Do not miss the next article on our blog. Subscribe to our YouTube channel, follow us on Facebook, Instagram, Telegram or X, where we publish the latest ATAS news. Share life hacks and seek advice from other traders in the Telegram group @ATAS_Discussions.
Information in this article cannot be perceived as a call for investing or buying/selling of any asset on the exchange. All situations, discussed in the article, are provided with the purpose of getting acquainted with the functionality and advantages of the ATAS platform.