Every trader wants to find 1 setup he can rely on. We give 7 of such setups!
You can rely on them since we will discuss only those setups for intraday trading, which have the risk-reward ratio > 1:3. Setups for trading are based on real patterns of behaviour of buyers and sellers, which you can identify with the help of the powerful set of instruments of the ATAS platform.
Trading these setups in Smart DOM is most efficient, but you can also use the Footprint on short time or range charts.
If you haven’t worked with the Smart DOM or Footprint before, select just one setup and be sure to:
- practice to be able to identify it;
- analyze the frequency of its emergence;
- try to trade it in your head or on paper;
- practice trading on the simulator;
- start real trading only after that, beginning with small lots.
These setups are not a magic Grail, just the market behaves more frequent this way.
Markets are different. They could be:
- slow, with a big traded volume at each price level – like Treasury Notes;
- or wild and fast, with a much less volume at each price level – as Crude Oil or Nasdaq.
Select the market depending on your temper and skills. In those markets, where you can make a big profit, the price could sharply move against you, bringing huge losses.
It has been a parenthetical remark in the form of a disclaimer. Now we will speak about the practice of efficient trading.
Which setups work?
Let us think about what makes a setup profitable:
- consistency and frequency – the more often we identify it and trade it, the higher profit we get;
- understanding under what conditions it works better – for example, high volatility. If something that worked before stops to work, look for the reasons in changing the market conditions;
- understanding why the price would move. For example, actuation of stops at certain price levels. The more stops there are, the sharper the movement is;
- possibility to clearly understand when a setup works and when it doesn’t. If a setup works, you are in a trade, using protective strategies. If a setup does not work, you exit immediately and minimize losses;
- a close stop and far take, that is the risk-reward ratio is > 1:3. Only when this condition is met, the number of profitable trades could be less than the number of loss-making trades, that is the Winrate could be < 50%. Check the calculation.
Interaction of the risk-reward ratio and low winrate.
| Winrate – 20%, R:R – 1:4 | Number of trades | Profit in ticks | Loss in ticks |
| Loss-making trades | 8 | – | 8=1*8 |
| Profit-making trades | 2 | 10=4*2 | – |
| Winrate – 60%, R:R – 8:4 | Number of trades | Profit in ticks | Loss in ticks |
| Loss-making trades | 4 | – | 32=8*4 |
| Profit-making trades | 6 | 24=4*6 | – |
That is why you can afford a bigger number of loss-making trades without any stress for the trading account at the risk-reward ratio > 1:3.
A list of setups for trading, which we would consider in this article:
- pullback to the range;
- pullback to the iceberg;
- pullback with the pressure fading;
- pullback with the correlating markets;
- trading in the range;
- false breakout;
- pure impulse.
We will consider the price growth in our setups for convenience and time saving. You can apply these setups the wrong way round for entering the sells.
First setup - pullback to the range (step).
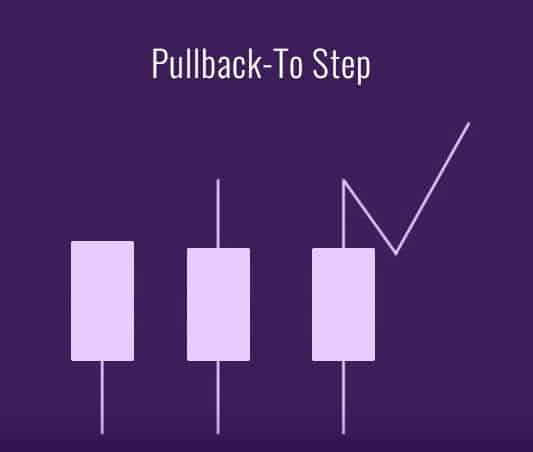
The price breaks the range and comes back to its upper boundary and pulls back upward with renewed force. The range could be a day or a narrow one, which takes a short period of time.
- When it works – in the trend market.
- Why it works – the stops are triggered and traders close loss-making positions. Traders do not sell when the price comes back to the same level again, because it is psychologically difficult after losses.
- What confirms – kicking stops when the range is broken, which means a sharp focused movement. Emergence of new buy orders when coming back to the range’s boundary and a new sharp price movement.
- What happens if the setup works – a sharp price movement after a pullback above the previous high.
- What happens if the setup doesn’t work – a return to the range. If stops were not kicked out during the range breakout, the setup, most probably, wouldn’t work.
- Rist – several ticks inside a range.
- Profit – above the previous high.
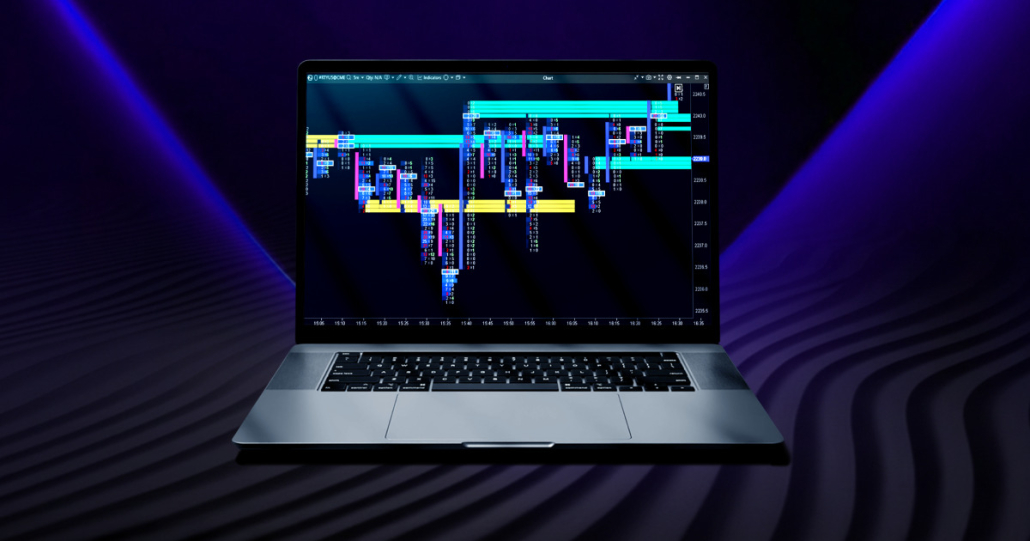
Let’s consider an example of a mini Russell 2000 futures (RTYU9) in Smart Dom.
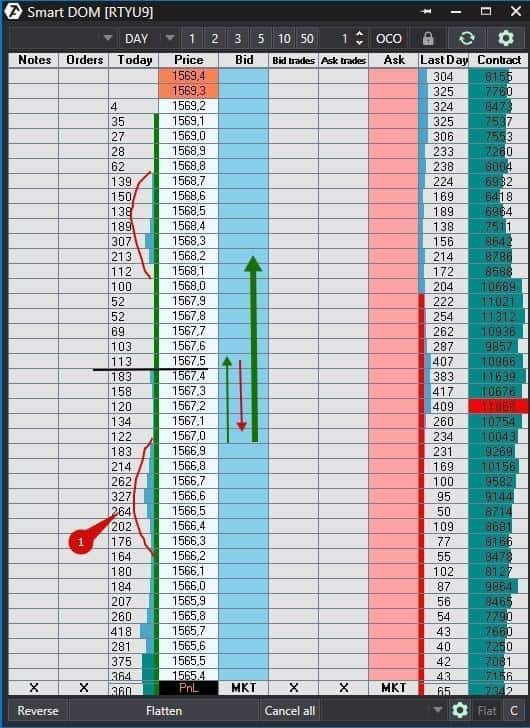
We marked the first narrow range with point 1. The price broke it approximately to the level of 1,567.5, marked with a black horizontal line and then pulled back to the upper boundary of the range. We marked the first breakout with a narrow green arrow and the pullback with a red arrow. The price reversed again after the pullback to the upper range’s boundary and moved much higher – a thick green arrow.
Second setup - pullback to the iceberg.

All pullbacks look similar, but there is an additional trigger in this setup for entering into a position. The market grows with a breakout and slightly opens and we see a huge volume at the end of the pullback. This volume could be formed at 1 or 2-3 price levels in a row. The sellers sell but the price doesn’t move lower since it bears against the limit orders. Absorption takes place. Iceberg is a partially hidden limit order. Managed money does not want to show its intentions and frighten inexperienced traders. Iceberg formation takes several minutes. It is a very obvious setup. Everyone, who monitors the market attentively, can see it.
- When it works – on usual days with the range extension. Works perfectly with S&P 500.
- Why it works – because the sellers get into a trap at the iceberg level and hurry to close loss-making positions. They buy and push the price up.
- What confirms – iceberg and absorption. Spread Tape with Delta will help to see that the price doesn’t move when the Delta changes significantly.
- What happens if the setup works – we should see kicking out the stops when moving up from the iceberg, since loss-making positions will be closed. And new buy orders should join.
- What happens if the setup doesn’t work – movement below the iceberg makes this setup ineffective. The price may move below the iceberg by several ticks in some markets but without the pressure of sellers.
- Risk – several ticks below the iceberg.
- Profit – above the previous high. If the price cannot move above this high, it makes sense to exit from the trade.
We already showed you example in Smart Dom for a Moscow Exchange index futures in the article about the Smart DOM trading. But it is so evident that we will show it again.
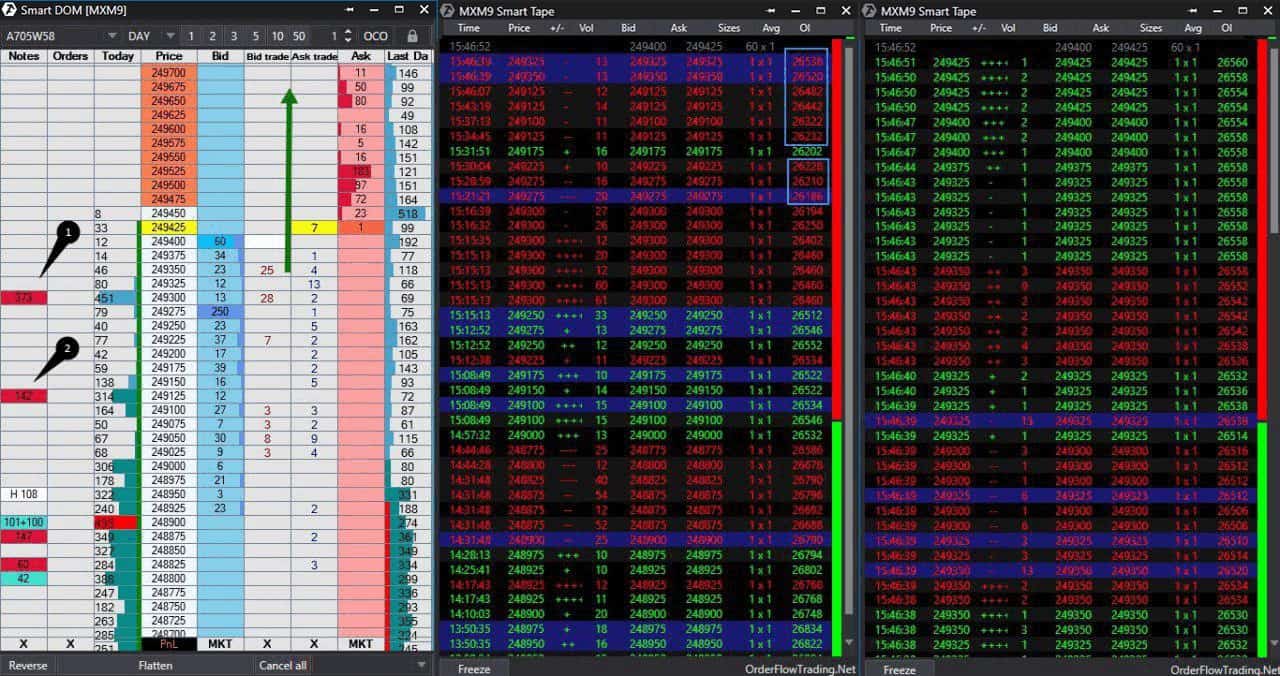
The price broke the range and pulled back to the level of 249,125, at which sellers entered. These new sell orders absorbed limit buy orders and the price didn’t fall, it went up. Sellers entered again at the level of 249,300 and buyers again absorbed them! The Open Interest grows, which means that new orders got into a trap. We marked these orders on tape with blue rectangles. And the price broke the ceiling and flew into space.
The index grew on that day due to the wild ascent of Gazprom stock. Attentive traders could use this setup twice and significantly increase long positions with the risk of several ticks only.
Third setup - pullback with the pressure fading.

The situation opposite to the iceberg takes place in this setup. The sell orders reduce here during the pullback and cannot push the price down. The sellers are not interested. This setup is not evident, that is why it gives big competitive advantages to those traders who can identify it and act respectively.
- When it works – on usual days with the range extension.
- Why it works – because there are no more sellers.
- What confirms – gradual emergence of buyers.
- What happens if the setup works – the price reverses and buyers emerge.
- What happens if the setup doesn’t work – sellers emerge and a big volume of sells pushes the price down.
- Risk – several ticks.
- Profit – above the previous high. Acceleration of buys and emergence of new orders should take place at the high level.
Setup example. We will see this example in Footprint and in Smart Dom of a silver futures (SILVERU9).
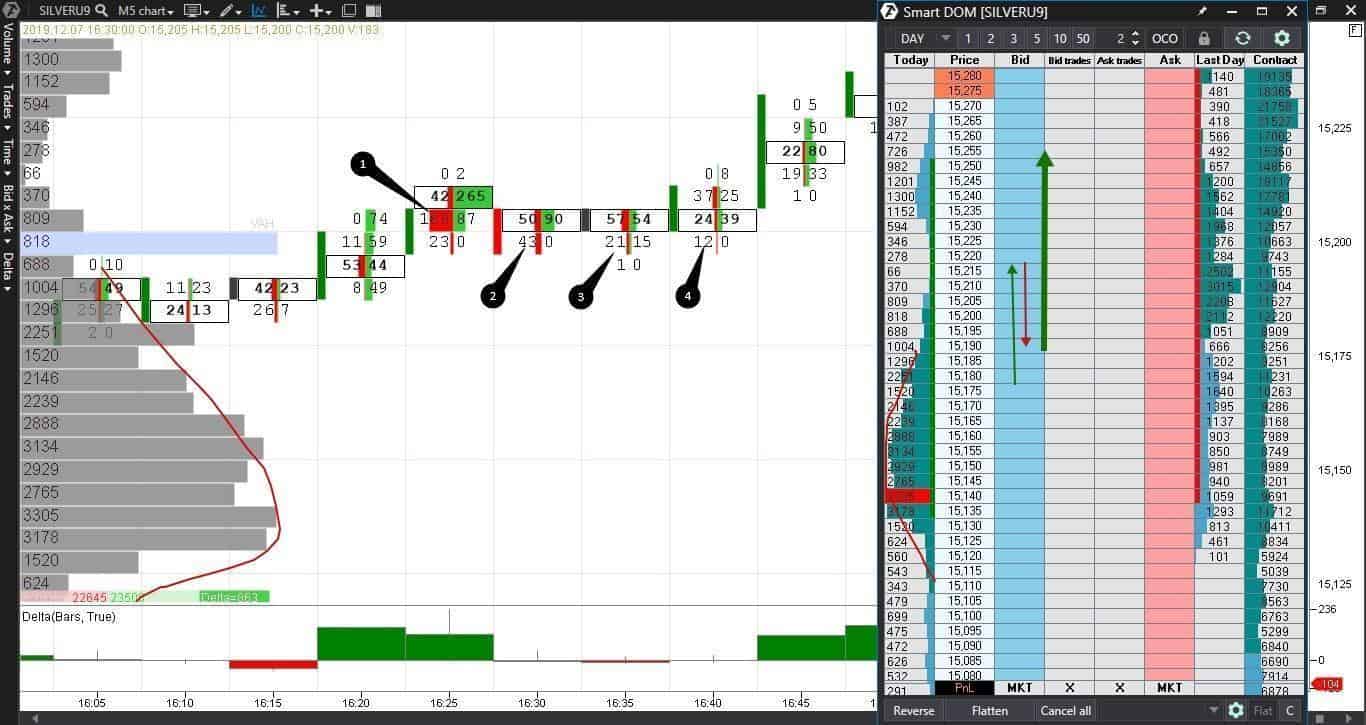
The price broke the range and grew to point 1 where sellers entered. We showed this movement in the Smart DOM with a thin green arrow. The sellers pressure didn’t last for long – sells are consequently reduced in points 2, 3 and 4. We showed this movement in Smart DOM with a red arrow. As soon as the buyers realized that there are no sellers any more, they became active again and increased the price – a thick green arrow. The price moved up and a new range was formed.
Fourth setup - pullback with the correlating markets.

Experience of monitoring the correlating markets is required for using this setup. For example, S&P 500 and Nasdaq or 5-, 10- or 30-year Treasury Notes. You shouldn’t try to work there if you do not know how these markets move ‘in gear’. You trade a slower market but look at the faster one. When the faster market starts to move after a pullback, you join at the lower market. The rate of movement is different due to liquidity. As well as on all pullbacks, the movement should accelerate and new buy orders should emerge at the previous high.
- When it works – in the correlating markets upon availability of a trend movement.
- Why it works – due to arbitrage trades when major players make money on spreads.
- What confirms – joint consequent movement of the markets in one direction.
- What happens if the setup works – buyers come to both markets. But we will see the price movement on Nasdaq faster and only then on S&P. 1 S&P tick is approximately 4-5 Nasdaq ticks. You will not notice 1 S&P tick but 4-5 Nasdaq ticks is a notable movement.
- What happens if the setup doesn’t work – the correlating market reverses down below the previous low.
- Risk – several ticks. You may close in profit even in the reversal, since you work in the slower market.
- Profit – higher than the previous high.
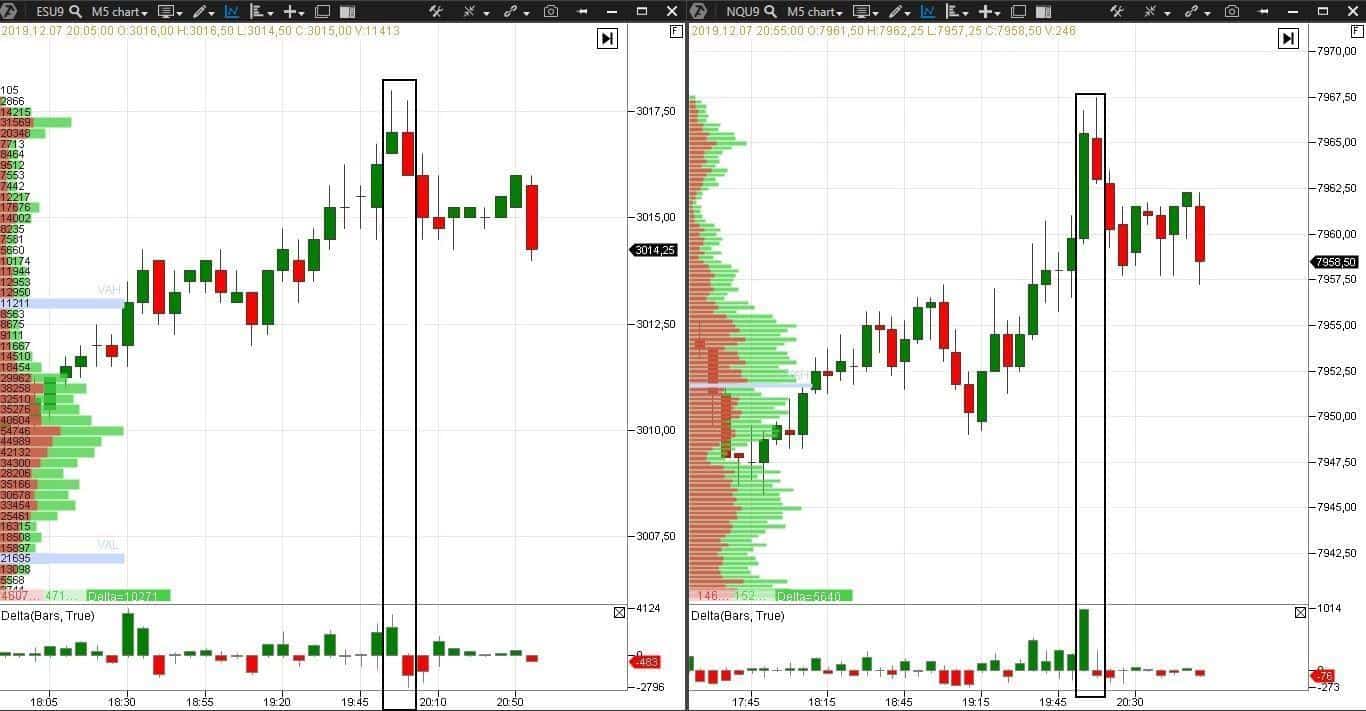
We will show you the correlation of E-mini S&P 500 (ESU9) and E-mini Nasdaq 100 (NQU9) futures as a clear example. It is impossible to say which of these markets moves faster by a candle chart, that is why it is so important to analyze the Smart DOM. But initially it is simpler to see the correlation in charts.
Fifth setup - trading in the range.
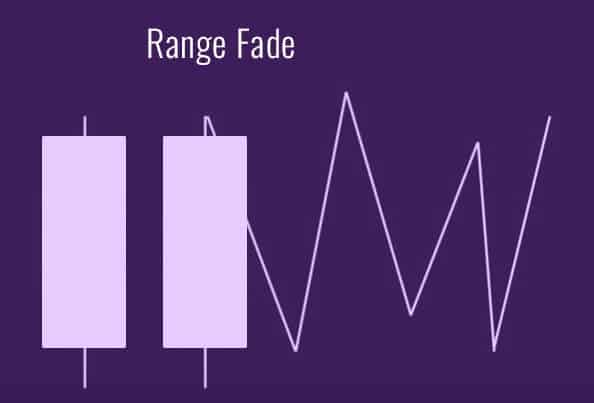
Ranges are different. They could be:
- short-term during a trend. Usually they are rather narrow and it is more efficient to trade them on a breakout;
- intraday in slow and inactive markets. You can trade here from the range’s low to high and in the opposite direction. But it is rather difficult psychologically to sell on top of a range.
In order to trade profitably in the range, it should be rather wide, otherwise the risk-reward ratio would be < 1:3. Do not trade this setup in narrow ranges. Sometimes, there are evident absorptions at the range extreme points and it will help to identify levels, from which to open trades. Use correlating markets for analysis of a trading situation. Pay attention to POC (Point of Control – the term is from the Market Profile theory) – if the price cannot overpass the POC, it will move in the opposite direction, where resistance is lower.
- When it works – during reduction of volatility and activity. For example, in summer time or on the eve of holidays or important news.
- Why it works – because traders do not have a clear understanding of the fair or unfair price. Noone is ready to initiate the price movement. And the managed money took a rest.
- What confirms – decrease of volume and rate when approaching the range boundaries. Increase of volume and rate near the POC.
- What happens if the setup works – a reversal near the range boundaries. Sometimes there could be absorption at extreme points.
- What happens if the setup doesn’t work – the price breaks the range.
- Risk – several ticks outside the range.
- Profit – ideally, the whole range, but ideal situations are rare, that is why from ¾ to ½ of the range.
Example of a wheat futures (ZWU9) in the Smart Dom.
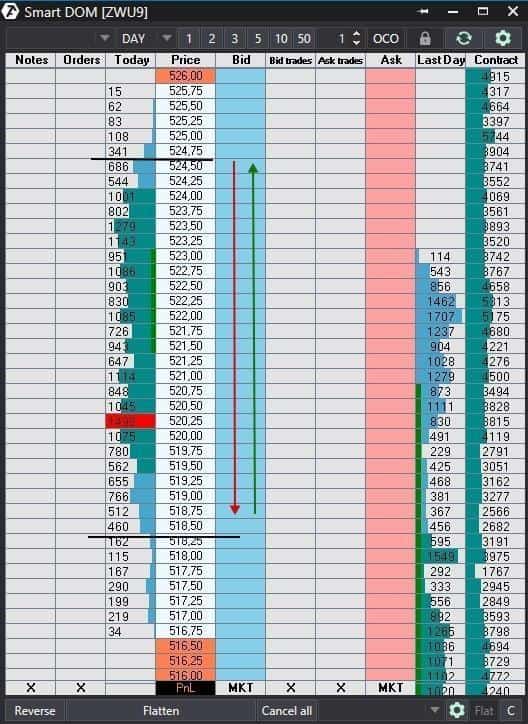
It is an intraday range and it was formed gradually. It is more efficient to trade from the levels, where the profile increment significantly changes. The profile increment is the difference in the number of traded contracts at the neighbouring price levels. We marked these places near extreme points with black horizontal lines.
- You buy from the bottom level; the price moves up and we marked this movement with a green arrow.
- You sell from the top level; the price moves down and we marked this movement with a red arrow.
The range is not symmetrical in our example and POC is in its lower part, that is why it is quite possible that the price is not inclined to fall significantly below the POC.
Sixth setup - false breakout.
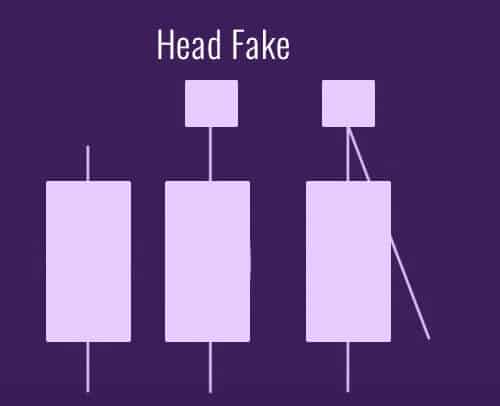
Wild breakout of the range boundaries. The sharper the movement is, the better, since more traders think that the breakout is real. The market stops with a big volume, could be an iceberg, after a cascade kicking of stops. The price sharply falls to the bottom of the previous range. A symmetrical trade from the other side of the range takes place quite often.
- When it works – in slow and non-trend markets after the extreme point of the range was tested several times. In summer time and on the eve of news and holidays.
- Why it works – managed money manipulations or traps for beginners.
- What confirms – breakout, stops and absorption.
- What happens if the setup works – the buys stop, price reverses and reaches the lower boundary of the range.
- What happens if the setup doesn’t work – the price goes above the absorption or doesn’t come back to the range.
- Risk – several ticks outside the absorption.
- Profit – the lower boundary of the range.
Example. Let’s check again the Footprint and Smart Dom of an E-mini S&P 500 futures (ESU9).
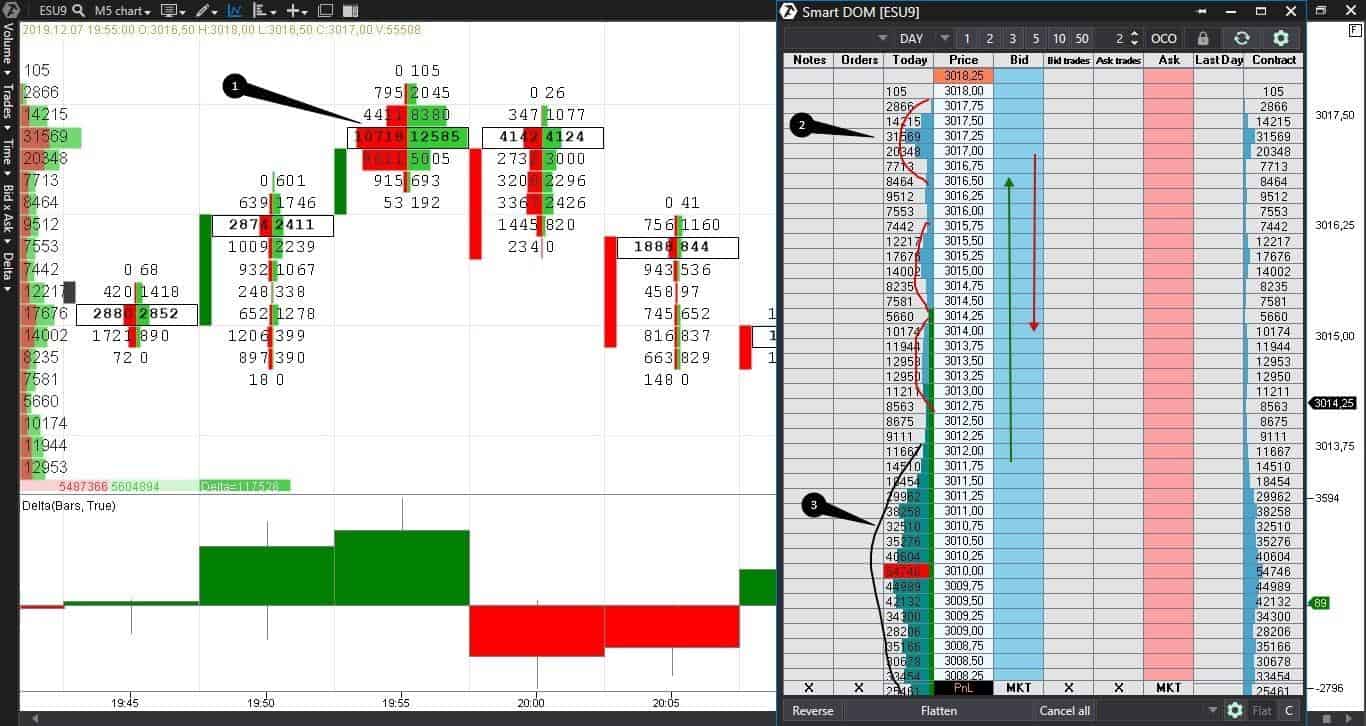
We marked the most significant day range with number 3. We can see several mini ranges in the Smart DOM after breaking this range. We marked obvious absorption with point 1 – a huge volume without an important price movement. The delta is positive in this bar but with an upper shadow, which doesn’t look good for buyers, especially after absorption. Sellers emerge in the next bar and the price pulls back outside the boundaries of the previous mini range. We marked the level of absorption in the Smart DOM with point 2 and the price movement – with green and red arrows.
Seventh setup - pure impulse.
The market starts to move very fast without evident reasons – this is a pure impulse. This is ‘bread and butter’ of traders. A profit could be much higher on such days than on regular ones. A position could be increased in the course of the price movement.
- When it works – under the influence of news, Trump tweets and trade wars.
- Why it works – because the market is inefficient and all traders are human beings and subject to emotions.
- What confirms – news or macro-economic events.
- What happens if the setup works – movement continues without pullbacks and formation of big key areas.
- What happens if the setup doesn’t work – the price forms a range or reverses.
- Risk – if you stand against the impulse, you can lose a lot. If you go with the impulse, you make a profit immediately.
- Profit – much higher than the risk.
Example of a Moscow Exchange index futures in the Smart Dom (a small exception here since this setup is for selling).
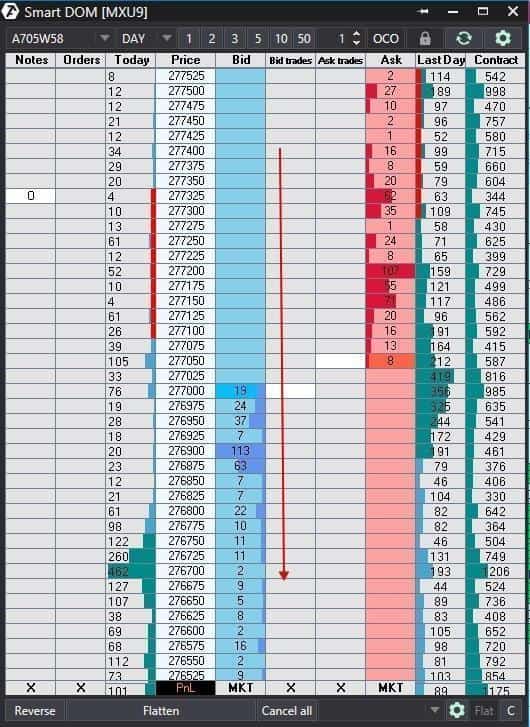
We marked the opening of a trading session with letter O. The price started to plummet practically immediately after the opening. We do not see significant volumes down to the level of 276,700. This is a pure impulse, when the price just falls or rises without any resistance. Ideally, the impulse lasts longer and the price falls/rises much more materially by 2-5% depending on the market.
Summary.
We told you about 7 setups with the risk-reward ratio > 1:3. If you have other working examples, share them with us. Which of the setups did you like better? Write in the comments.
We are sure that this article and the modern trading ATAS platform will help you to improve your results in trading. Launch ATAS and monitor how your favourite setup works in your market.
Did you like the article? Press the like button anyway!