
In the first part of the article we discussed volume trading strategies for flat markets. After reading it, you may get ideas on how to buy and sell on an exchange if the price moves within a corridor or in a “flat manner”.
So, we considered:
- strategy No. 1 for trading on reversals;
- strategy No. 2 for trading on false breakouts.
And stopped our discussion speaking about differences between a reversal formation and false breakouts. Let’s note this difference in the following chart, which refers to the strategy of trading against a trend.
Read today:
- strategy No. 3 for trading against a trend;
- strategy No. 4 for trading on rollbacks;
- strategy No. 5 for trading on breakouts.
Watch out! Very many letters are ahead of you!
No. 3. Volume trading strategy. Trading against a trend.
Logic. Trading against a trend envisages correction. Why does correction emerge?There is a saying “too much of anything is good for nothing”. As regards exchange trading we remember it when the existing trend accelerates and the market enters a so-called area of ‘overbuying’ or ‘overselling’. The price as if outruns itself in these areas and:
- an effect of panic selling emerges in the market under the conditions of a descending trend;
- an effect of euphoric boom emerges in the market under the conditions of an ascending trend.
A trader feels that the market is ‘overheated’, emotions are over the reason and the current price doesn’t adequately correspond with the real value of the asset. In other words, a corrective move, on which he can make money, is about to happen.
How to accurately identify the moment when correction starts? Only the market knows. But if you monitor the course of trading attentively, you may select a setup with high chances for success and the ATAS platform instruments will help you in it.
Example. Selling an oil futures.
On June 26, 2019, the price of a July oil futures (BRN9) reached the level of USD 66.80 per barrel, which was +3.8% of the previous day’s low. Impressive run.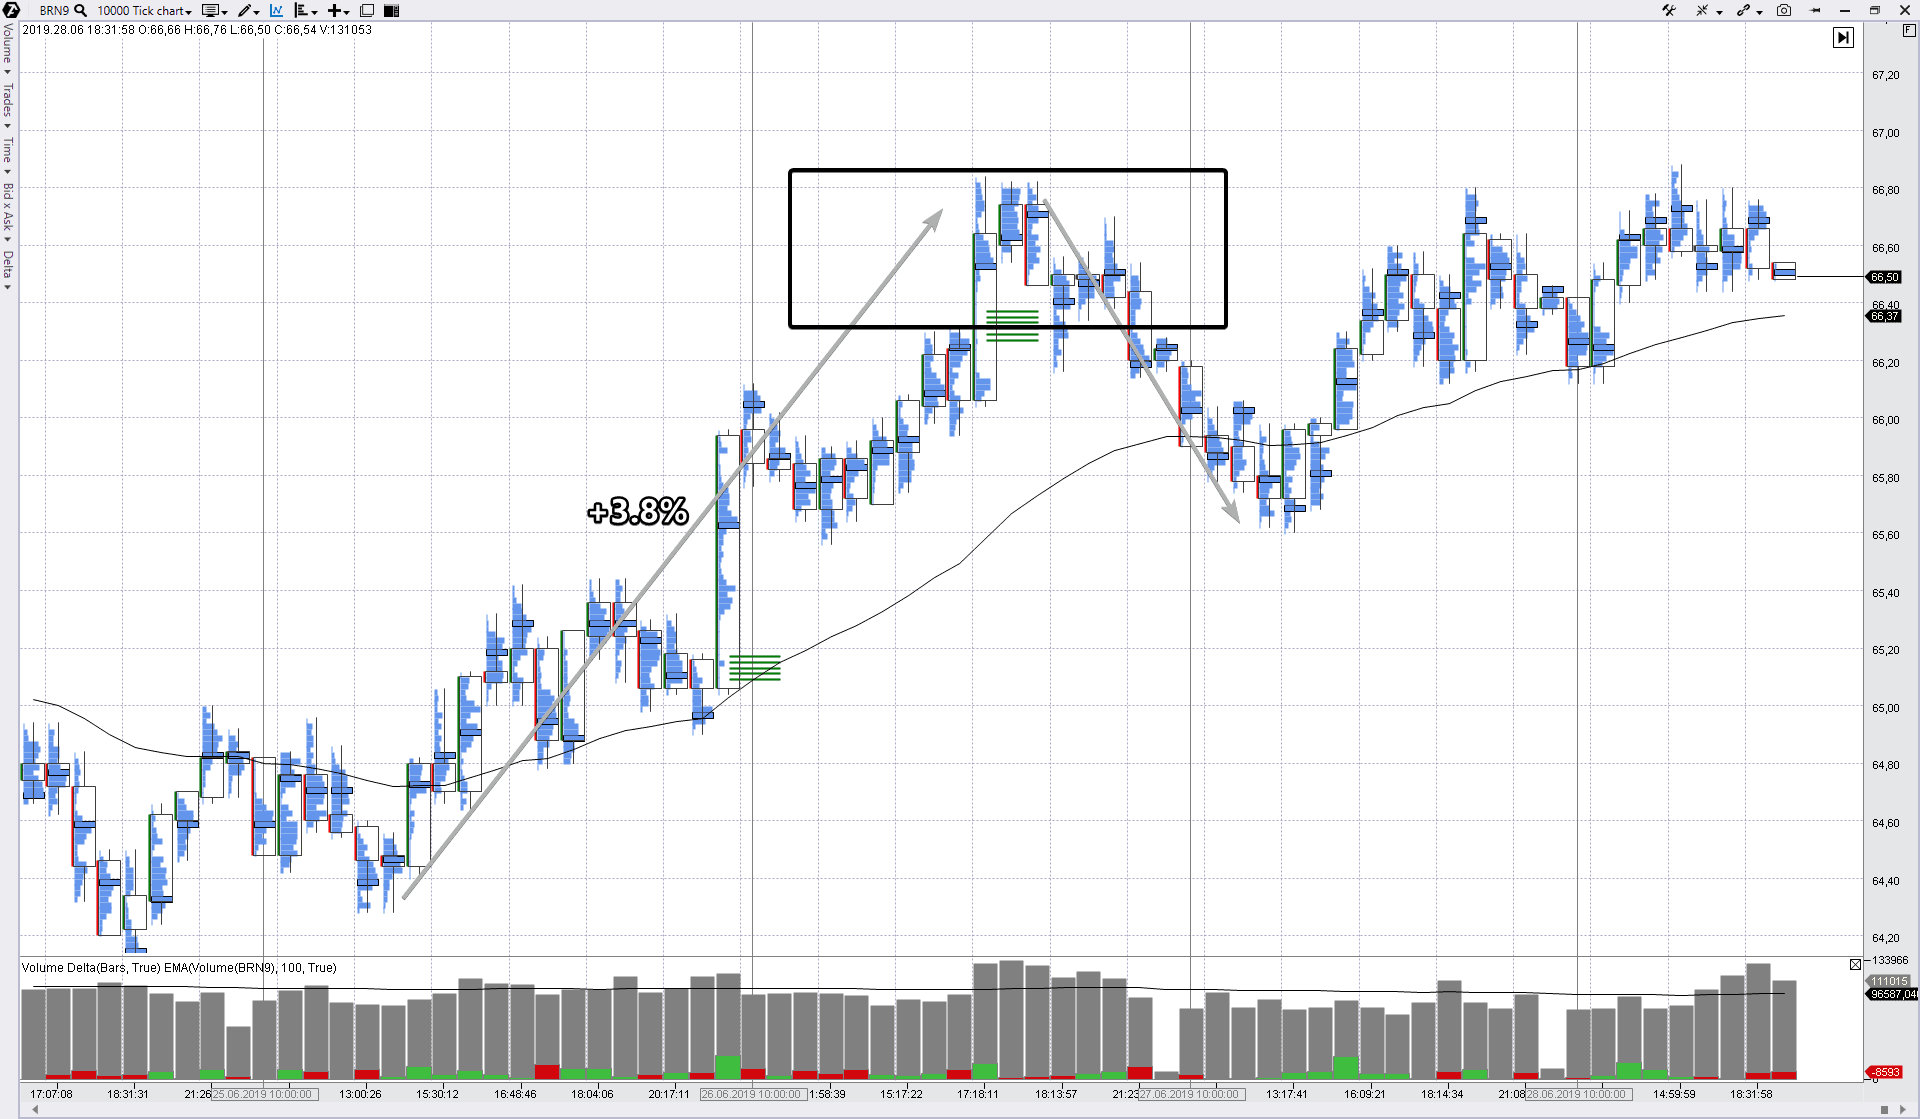
This abnormal activity of bulls is much too evident. While beginners entered into longs expecting fast and big profits, experienced traders, who are able to trade against a trend, prepared to open shorts against the background of obvious growth.
Where could be a moment of an entry against a trend?
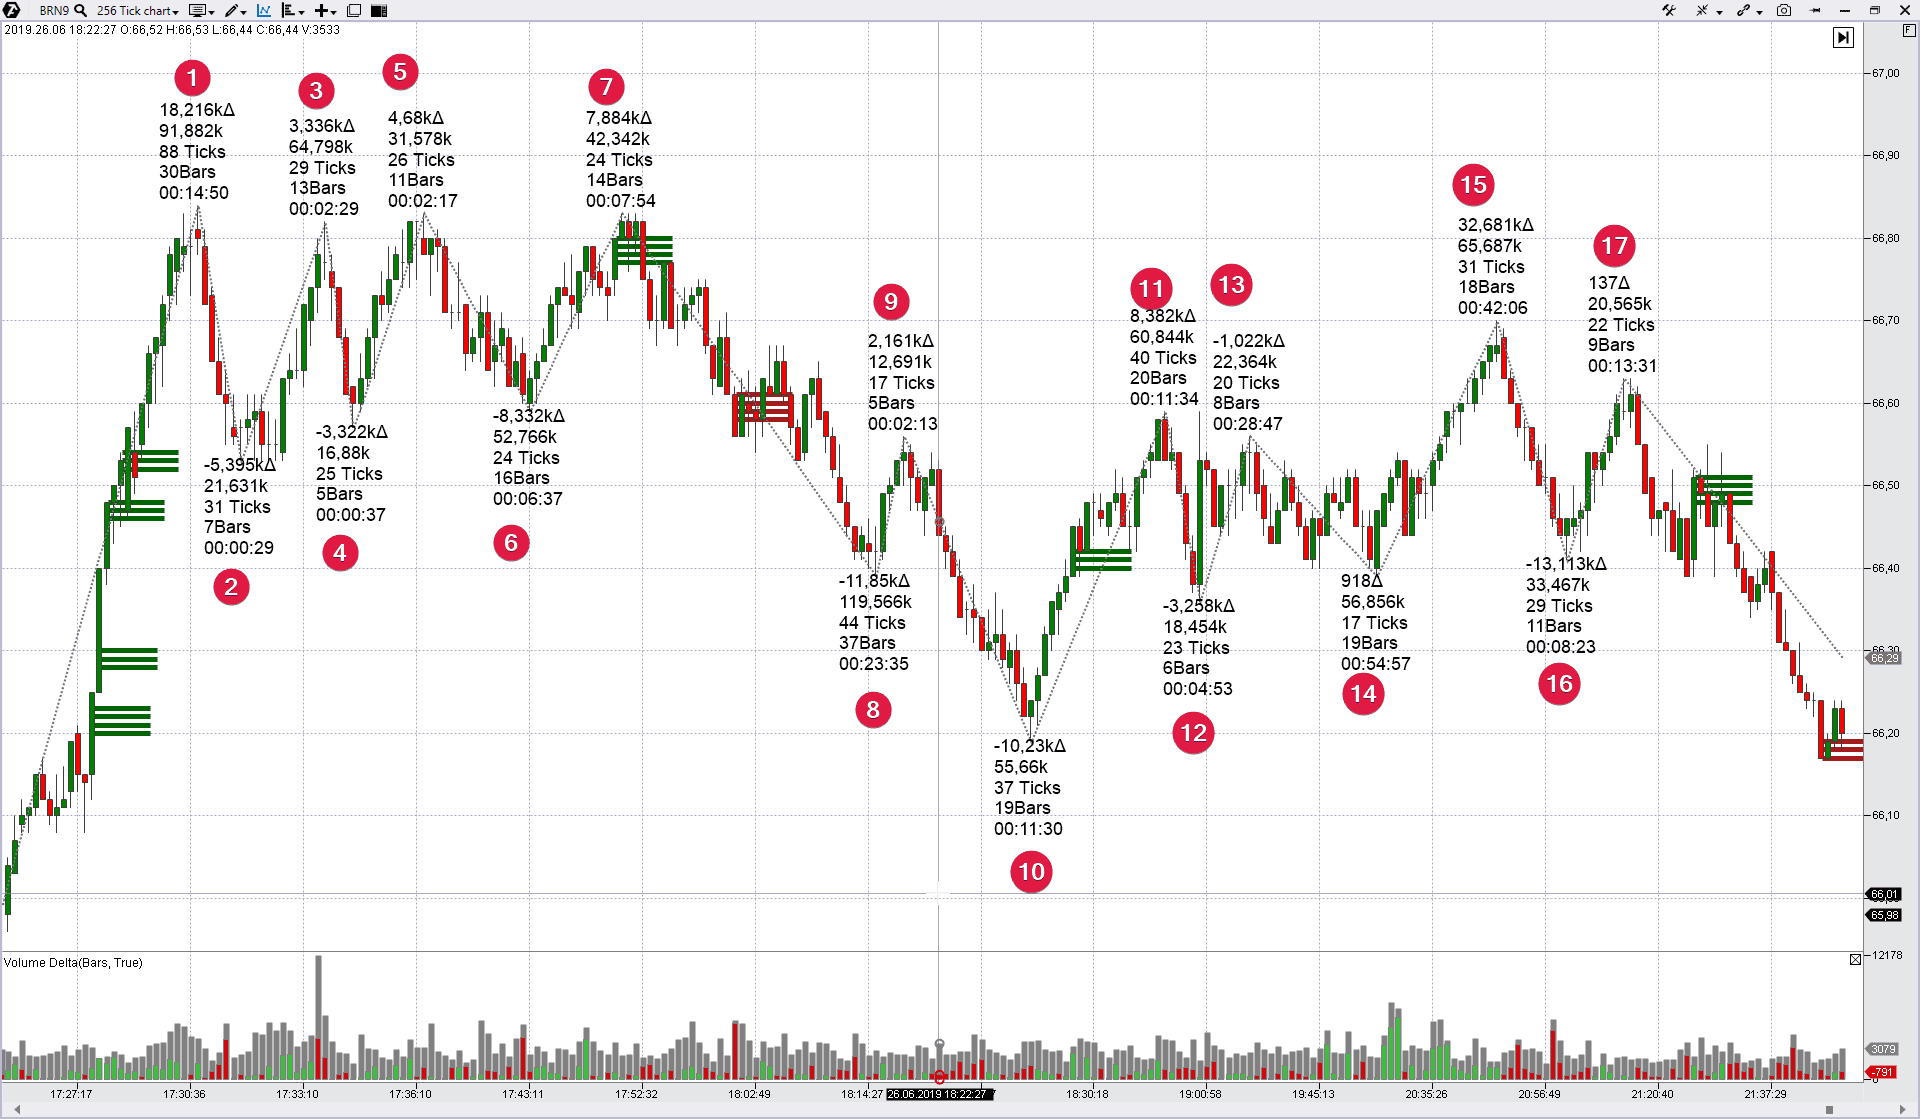
Let’s again apply analysis of traders’ activity on waves with the help of the ZigZag pro indicator of the ATAS platform.
- wave 1 accumulated a cumulative volume of 91 thousand contracts. Figuratively speaking it is a boiling water, which bubbles over;
- wave 2 rolled back to the levels, where Imbalances sent an extreme signal. The volume is 21 thousand. It is a normal reaction;
- we notice a reduction of the volume on growing waves 3 and 5. It is a sign of drying out of the buying activity. The fire under the kettle with boiling water was turned off;
- descending wave 6 accumulated 52 thousand traded contracts. This increase of the wave scale is a vivid sign of the market nature change for the sellers confirmed their presence. At the same time, the plot thickens – what wave 7 would look like;
- wave 7 is not strong. Its volume exceeds the volume of the previous upward wave insignificantly. And it took place on its very top, giving the green light to the Imbalances indicator signal. However, in case this splash of buys is a true effort of strong players to break through the tops in the left, why did the price immediately reversed down, leaving the levels, where the signal worked out, above itself? A false bullish signal is a bearish signal. One more coin into a bank of ideas for trading against a trend and the bank already seems to be rather solid to start a game.
Beginning of wave 8 is a chance to enter the beginning of a rollback. The statistical level of 50% of the previous upward wave on a longer period could be the goal.
Let’s assume that we:
– opened sells at 66.70;
– posted a stop at 66.95 (above tops 1-3-5 and trap 7); – the goal is at 65.57. Why? We already mentioned in the paragraph before the chart that the price made a run of 3.8% of the previous day’s low. So, 65.57 is just a middle of the rally from its beginning at 64.31 (is not seen in the chart) to the high of 66.84 (is seen in the chart).
The reward to risk ratio in this case is 1.13 : 0.25 = 4.5. Let’s note that the price didn’t reach the goal, being short of 5 cents only and forming the local low of 65.62 at lunch time the next day.
And before we analyze the strategy of trading against a trend let’s finish the topic of a difference between a false breakout and reversal structure. The chart above just shows the difference – a reversal is a more complex formation, while a false breakout is of a smaller scale.
- Reversal. Waves 1-8 formed a reversal structure with drying out of the buying pressure, which can be seen from the volume reduction on growing waves 1-3-5. And there is a final trap in point 7.
- Breakout. Movement to point 15 exceeded local highs 9-11-13, but quickly reversed back. The movement character discloses its manipulative nature. Its goal is to entrap bulls and ‘kick out’ stops of the sellers.
It is more difficult to conceive reversals when they emerge in the chart. But they give more justified signals.
Example. Buying AAPL against a trend.
Let’s consider buying the Apple stock after falling during a day.The stock price set the high of several weeks at the opening of a trading session on July 1, which strongly impressed the public. However, the market started to go down soon and enthusiasm was replaced by negative emotions, since the price fell from the opening high of 204.48 by nearly 2%, breaking the level of USD 201 per share.
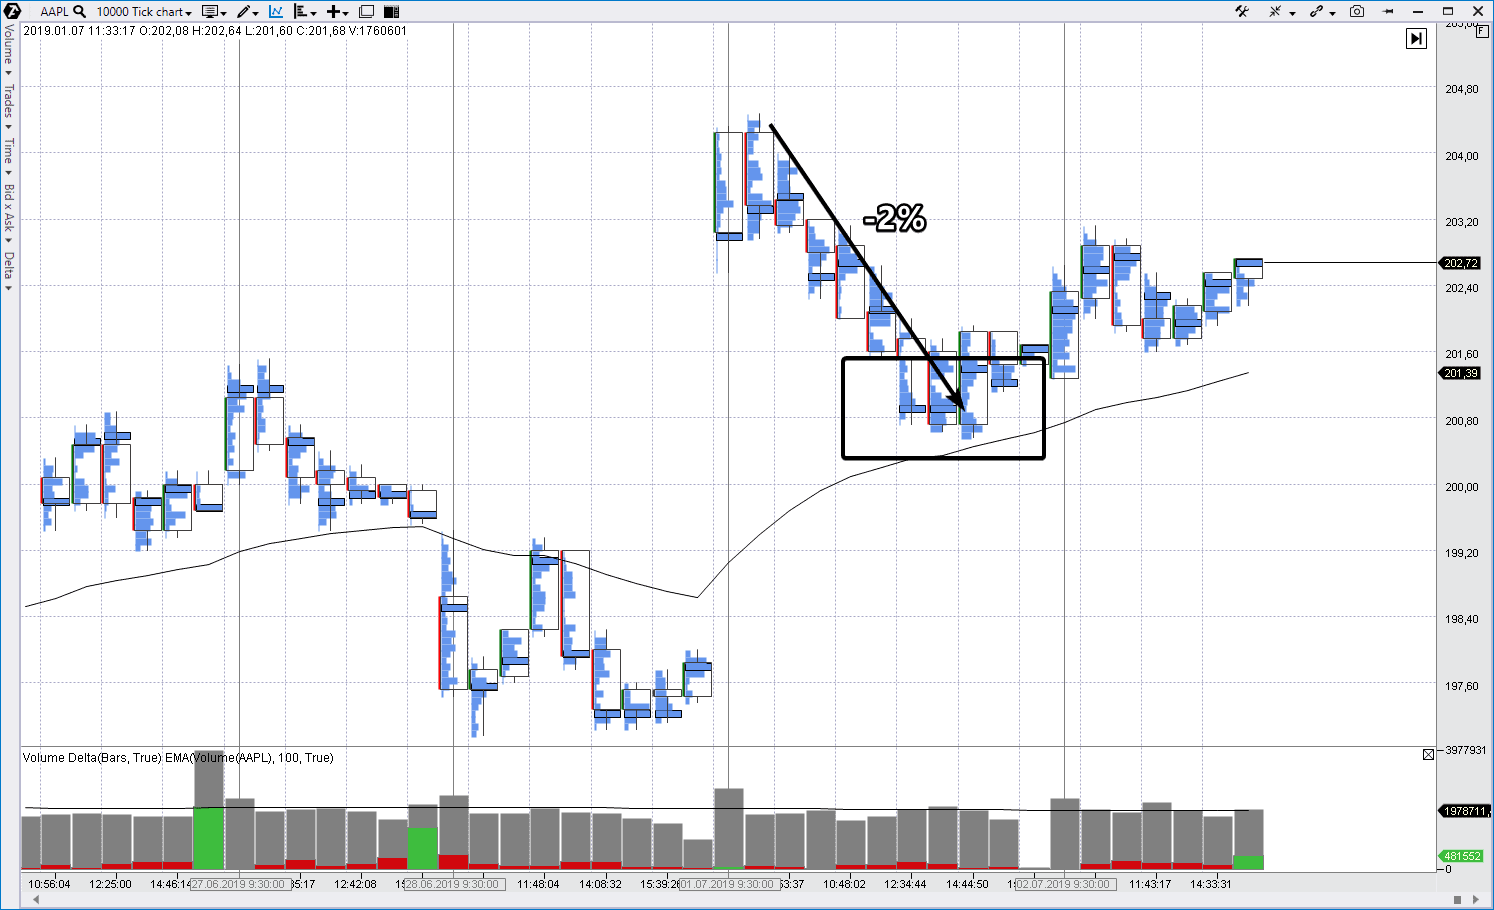
Numbers in the below chart form descending tops and bottoms. In other words, technically speaking, the trend is directed downwards.
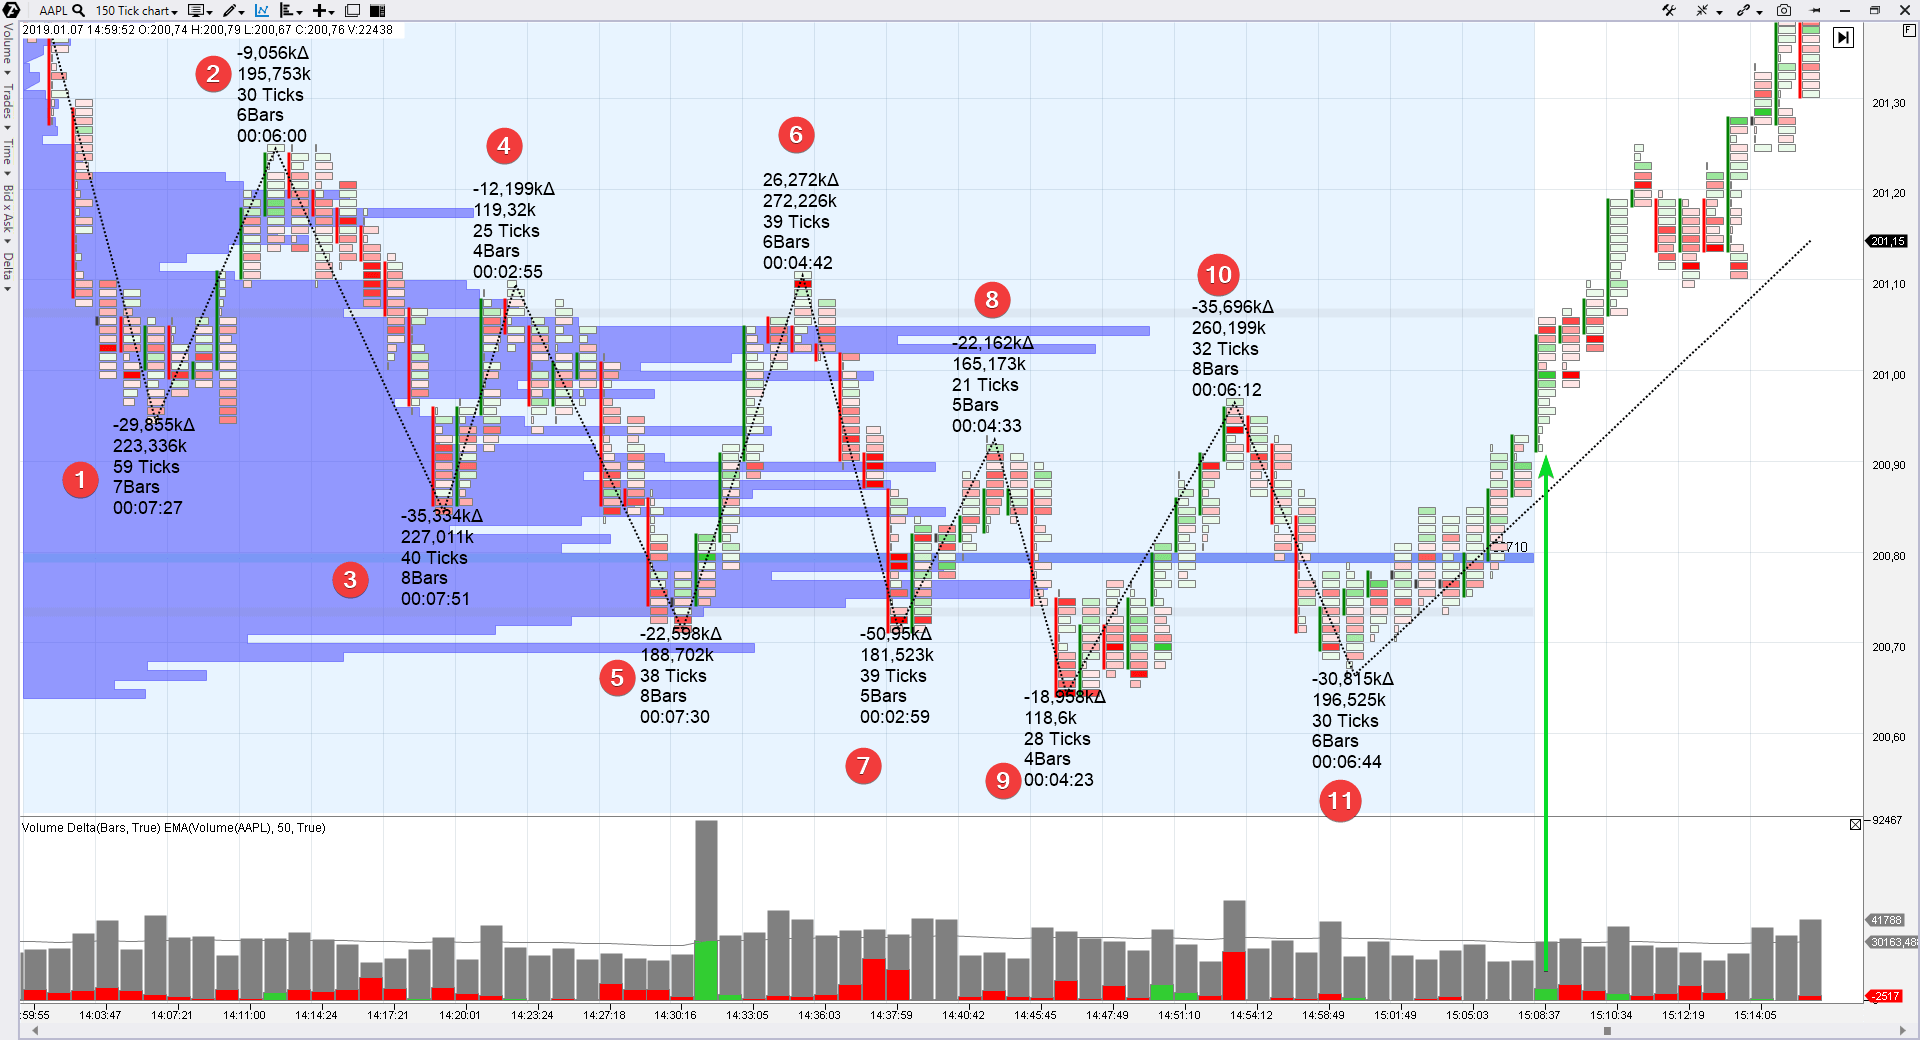
- Wave 1 stretched for 59 ticks down. Such a long falling with breaking the level of 201 made the public sell.
- However, look at the volumes of the consequent descending waves 3-5-7-9. They consequently reduce from 227 thousand to 118 thousand. This is drying out (exhaustion) of the selling pressure. And we know why.
- Decrease of the bearish progress is also an early sign of strength. We speak here about a distance, by which the market goes down after the breakout of the previous low. In other words, wave 5 went down under wave 3 deeper than wave 9 under low 5.
- Wave 11 failed to renew the low. This fact provides a trader with a ground, against the background of exhaustion of sells, to enter into a long when the price crosses the POC (Point Of Control) level of 200.80.
- The splash of buys (green arrow) means that a strong player showed his cards. If you draw a conventional line of resistance through the highs of waves 2-4-6-8-10, then the bright green cluster at the breakout of this resistance, which coincides with crossing the round level of 201, is a sign of the fact that a reversal has already taken place.
Let’s assume that we: – bought at about 200.80; – posted a stop at 200.65 (15 ticks); – What is the goal? We will sell at the end of the session.
The market closed at about 201.71. We are on the positive side (91 ticks).
Summary for the strategy of trading against a trend.
The most important thing in trading against a trend is the ability to take risks. A decision to go against a crowd often means to be crushed by the crowd. It is not without reason that the Where to Find Trades diagram of David Weiss (from his book Trades About to Happen: A Modern Adaptation of the Wyckoff Method) contains all types of trades (flat and trend ones), except for the ones that are against a trend.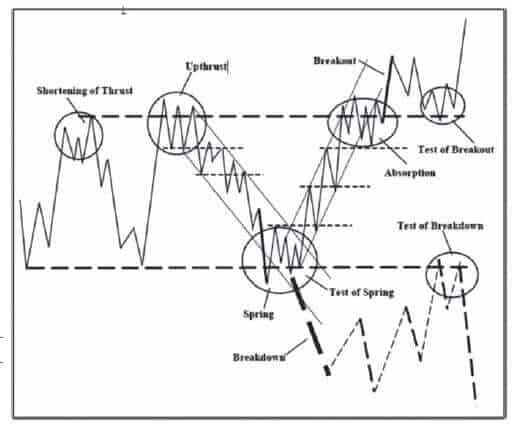
- The previous price action means a strongly pronounced trend. The price is on a tear and goes into the sky or falls into the ocean bottom. A trader assumes that the price moved from the real asset value too far and a ‘sobering’ rollback would emerge very soon;
- Upward waves start to lose strength and downward waves start to gain strength when a rollback starts in the current up-trend. The opposite is also true: downward waves start to lose strength and upward waves start to gain strength after a long fall;
- Monitor the profile. A profile, which looks like the letter ‘p’, is formed before a downward rollback more often than on average. A profile, which looks like letter the letter ‘b’, is formed before an upward rollback;
- An entry signal could be sent by the indicator data (for example, a colour change at the delta) or by the price/cluster action (for example, a breakout of the extreme point of the previous bar or breakout of the POC level);
- Analyze the situation on the basis of facts in order to catch the beginning of a fluctuation which has prospects to develop into a significant wave;
- Keep the reward to risk ratio in your favour – not less than 2:1.
In the chart above, we considered the price and volume action in the AAPL stock market with the aim to find an entry by the strategy against an intraday trend.
But let’s look at this chart from a different side.
- buying on the bar with the green arrow is an action by the strategy of a bullish breakout for overcoming the resistance, which was formed by tops 2-4-6-8-10;
- if we assess the situation on a longer timeframe, we use the same trade to buy the stock by the strategy of trading on rollbacks within an ascending up-trend, which took place during the previous month.
It is the same multi-level market matrix. Let’s continue discussing it and we consider now the just stated strategies: on a breakout and rollback.
No. 4. Volume trading strategy. Trading on breakouts.
Logic. We mentioned in our publications (article 1 and article 2) about Peter Steidlmayer, the founder of the market analysis with the help of a profile (horizontal volumes), that the market alternates its states of the balance and disbalance, moving from one state into the other an endless number of times.The price, in the state of balance, mainly moves in a flat range, since the demand and supply balance each other. However, when new factors of influence on the price appear (news broadcast, for example), traders rush to find a new balance, which means that the market enters into the trend phase.
So, the trend is not an ideally focused movement. There are insignificant downward waves within each ascending trend and there are insignificant upward waves within each descending trend. Namely these insignificant waves are rollbacks or corrections (the reasons for their emergence were discussed in the analysis of the strategy of trading against a trend).
Rollbacks, as a rule, constitute 50% of the previous impulse and Fibonacci levels are often used for measuring rollbacks.
Trading by the strategy on rollbacks envisages:
- buying assets at an assumed ending of the correction decrease within the acting up-trend;
- selling assets at an assumed ending of the correction increase within the acting down-trend.
It is not a rare case when the correction movement stops at the level of the previous breakout. The so-called test of breakout takes place. This phenomenon is also known as “the former resistance works as support” and “the former support works as resistance”.
We believe that the test of breakout is a particular case of a more general trading on rollbacks, when the price rolls back quite close to the breakout level. That is why, if you are looking for a strategy of testing breakouts, it is included into the strategy of trading on rollbacks.
Example. Buying an ESU9 futures on a rollback.
Events of June 17, 2019, gave a trader a possibility to enter into buying on a rollback after a bullish breakout of the time balance. Let’s consider this situation in a 10-minute chart.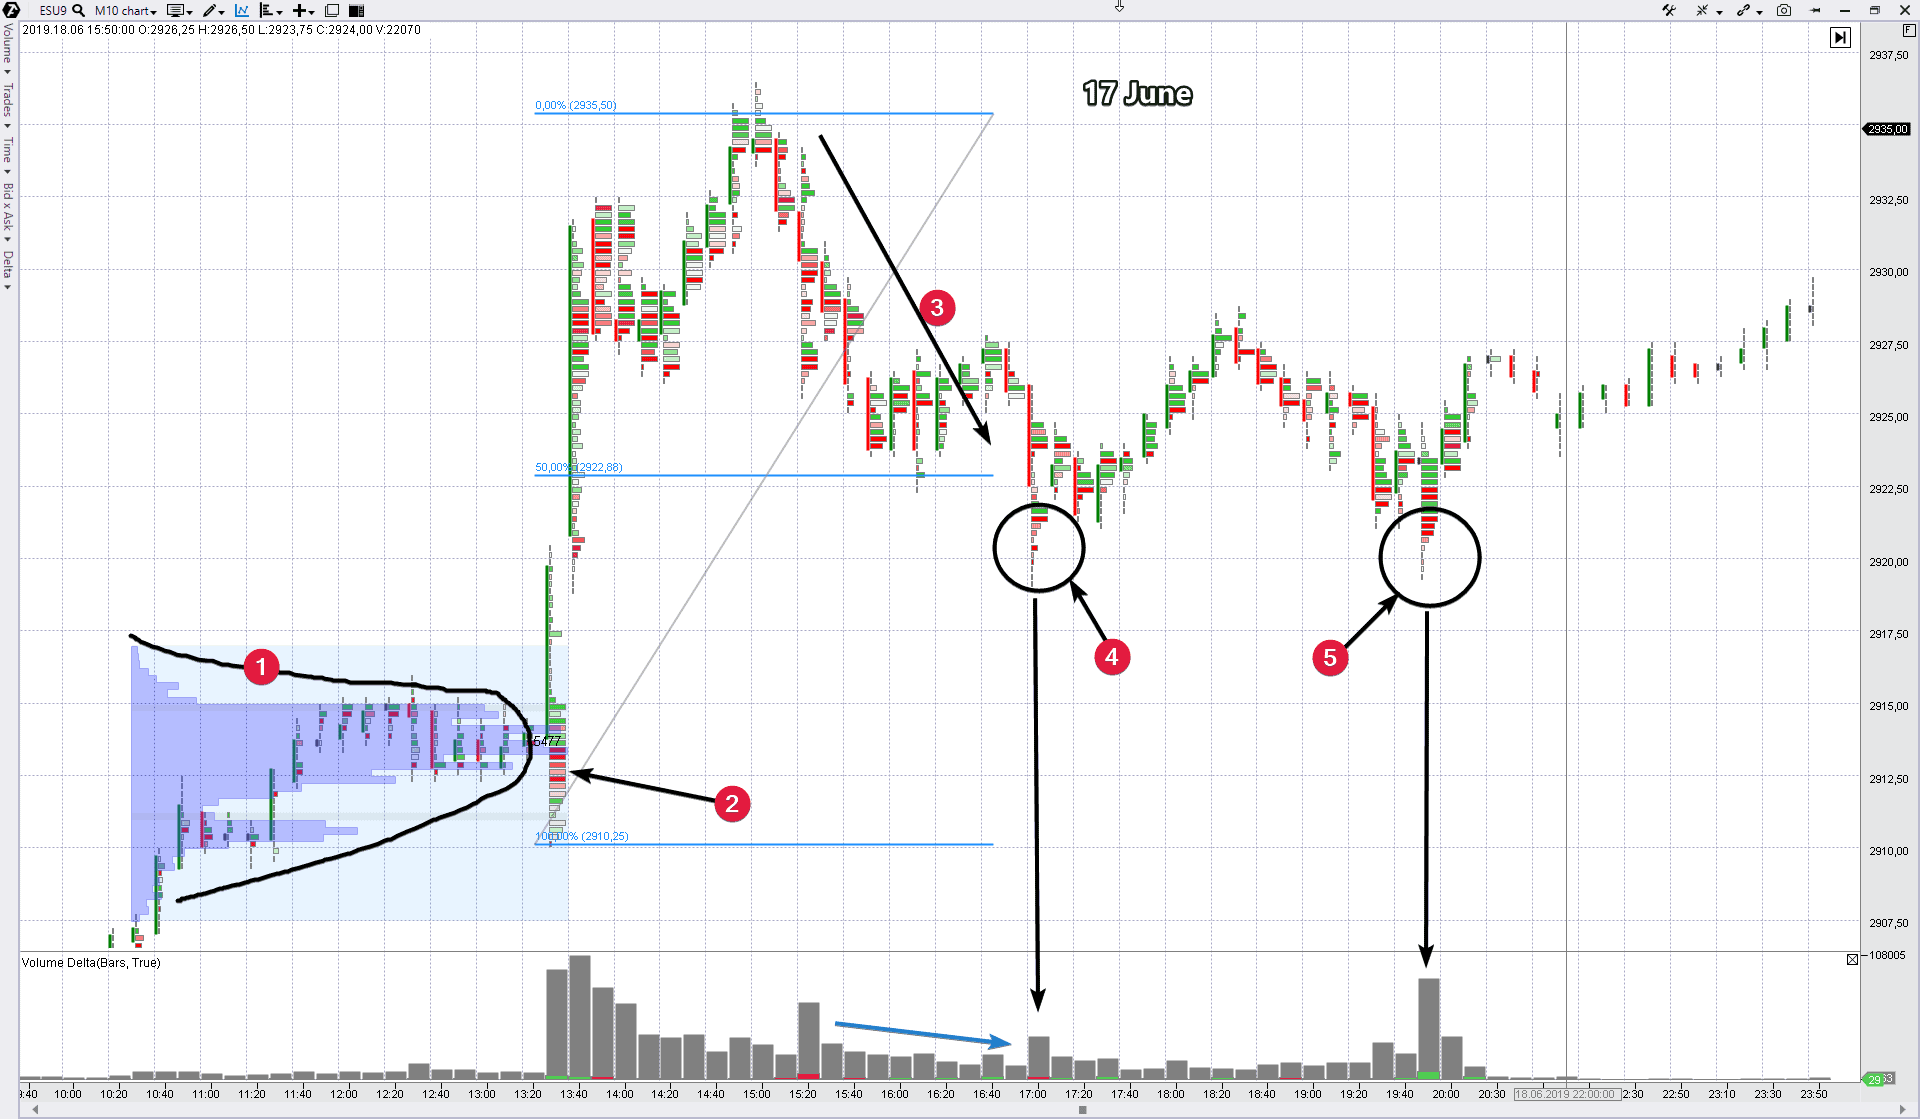
- Number 1 marks a short-term balance, from which the price moved up to look for a new balance, where the demand would balance the supply. It means that traders arrived at a conclusion that the price does not reflect the inner value of the asset in the balance area (1). In fact, the contract is more expensive.
- Note the trap for bears (red clusters). This ‘false trick’ confirms the genuineness of the upward breakout.
- The price moved down after finding resistance at the level of about 2,935. This rollback (correction) includes increased attention of traders who enter into buying on rollbacks. A normal downward rollback constitutes about 50% of the previous ascending impulse. If the price renews its movement towards the impulse, without reaching the level of 50%, it tells us about a real strength of the market. If a rollback is deep (70-80%) it should be interpreted as an alleged strength of the market.
- A significant moment of reduction of the volume on a rollback (marked with the blue arrow) is a confirmation of the fact that the rollback has a technical temporary nature.
- The correction low was registered, in our case, below the level of 50% (blue Fibonacci arrows). But not much. Let’s note important signs of the rollback culmination: a) a splash of the general volume with a negative delta (local selling climax), and b) profile thinning.
- Similar signs manifested themselves at the repeated test of breakout at the end of the session.
How to enter by the strategy on rollbacks?
Technically, to increase accuracy, you should look for an entry into a long on shorter periods. Say, you can use a green splash on a delta and/or breakout of a high of minute bars for buying.Where to post a stop loss?
As a variant, it could be posted in the area of your former balance (1), for example under POC. In principle, the market shouldn’t come back there, since everybody already realized that it was ‘too cheap’ there. Take profit is for renewal of the highs.Where to post a take?
A good trick in capital management is to use the trailing tactics, because we deal with a probable trend. In other words, a trader assumes that a trend would continue because a new balance is even higher. And the most rational way to catch a significant part of a trend is simply to move a stop loss up without a registered goal with respect to the profit.But if you are used to trade with take profits, where could the goals be in the considered chart? We offer to aim the take profit as a low at the level of the top of the rollback beginning (3). Yes, a trend may continue as well as the process of balancing may start.
The approximate reward to risk ratio would be 1.5:1 in the case under consideration when a take is posted at the level of new highs. The ratio is not very profitable since the rollback is not deep and the stop is wide. And the decision whether to take this trade or wait/look for another variant is yours.
Moreover:
- the price moved up to 2,962 on June 20;
- the market then formed a similar signal, however for selling (the chart is below).
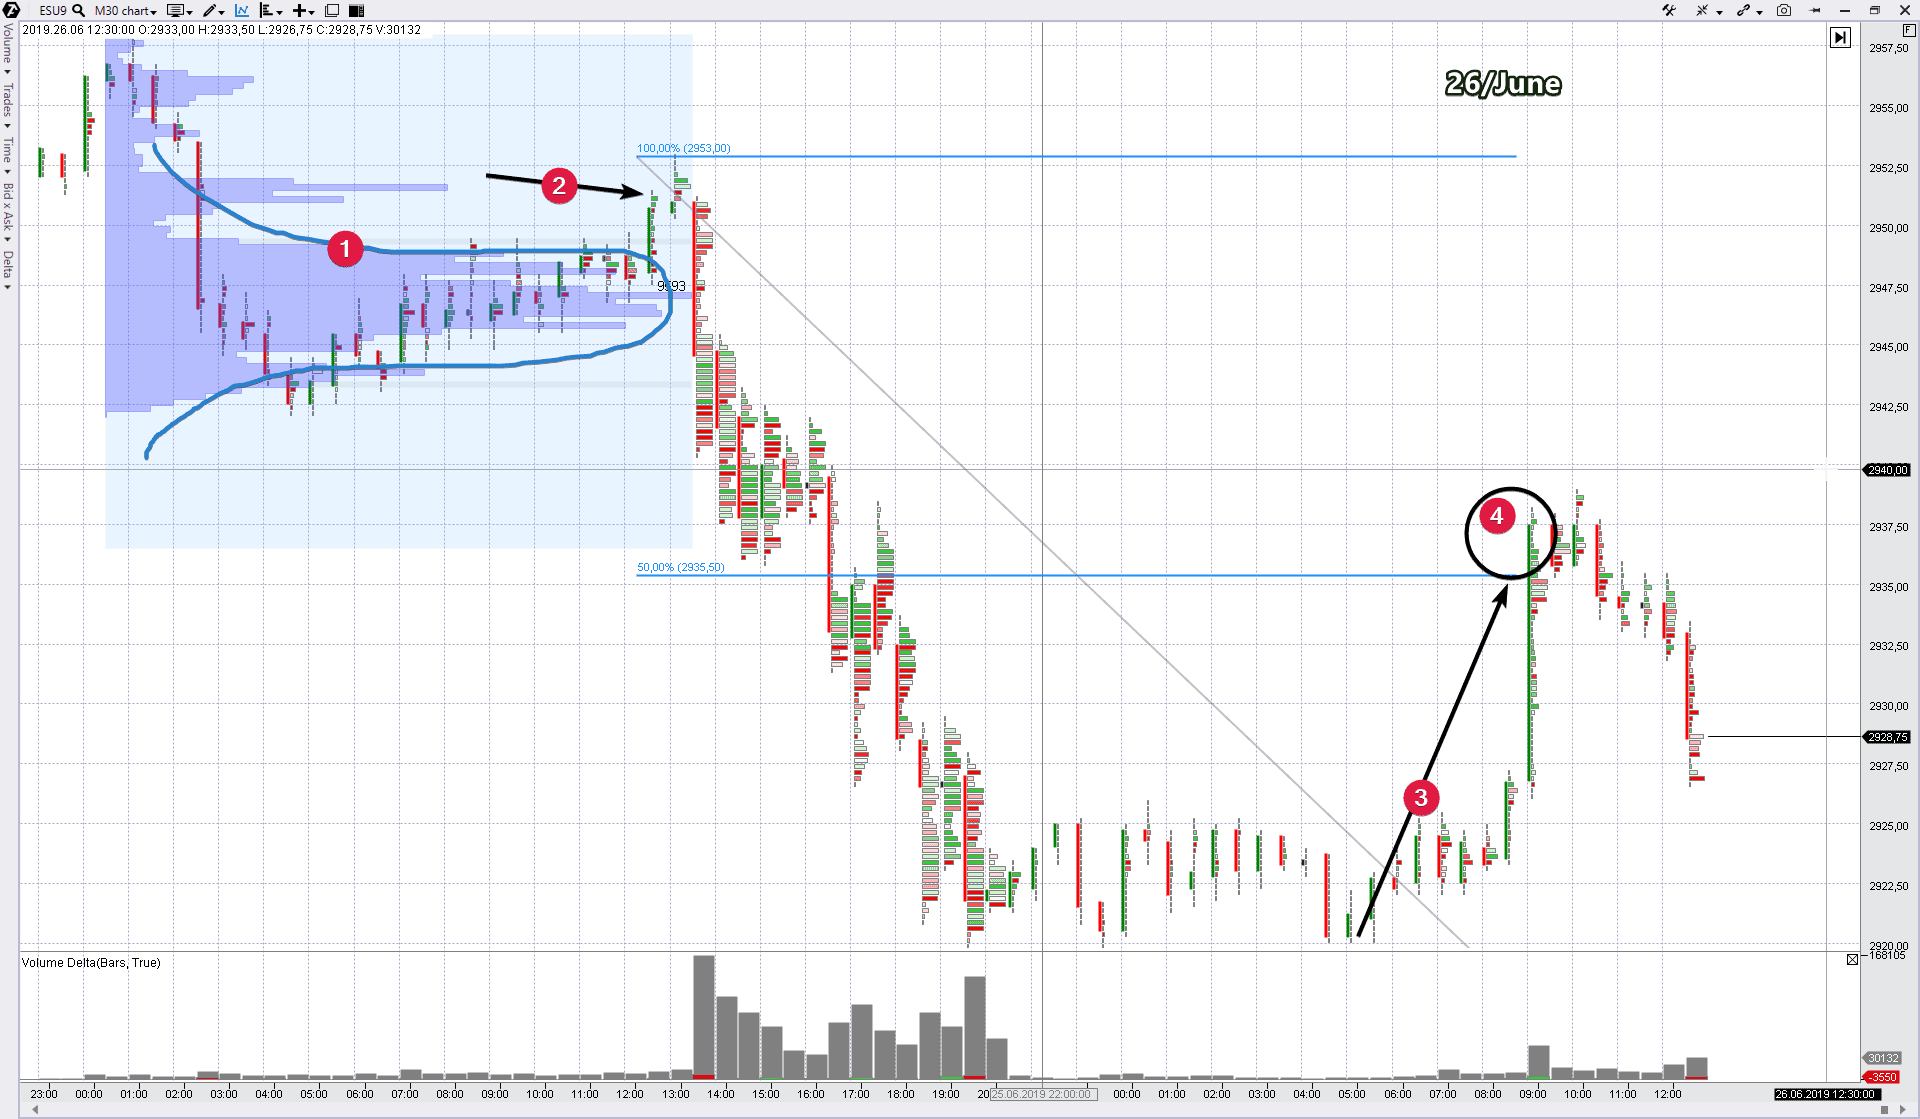
Example. Selling AAPL stock during a day.
This example is for active traders. It shows the course of trading on June 26, 2019, on a fast 30-second period and a setup for entering into shorts by the strategy on a rollback was fast in coming.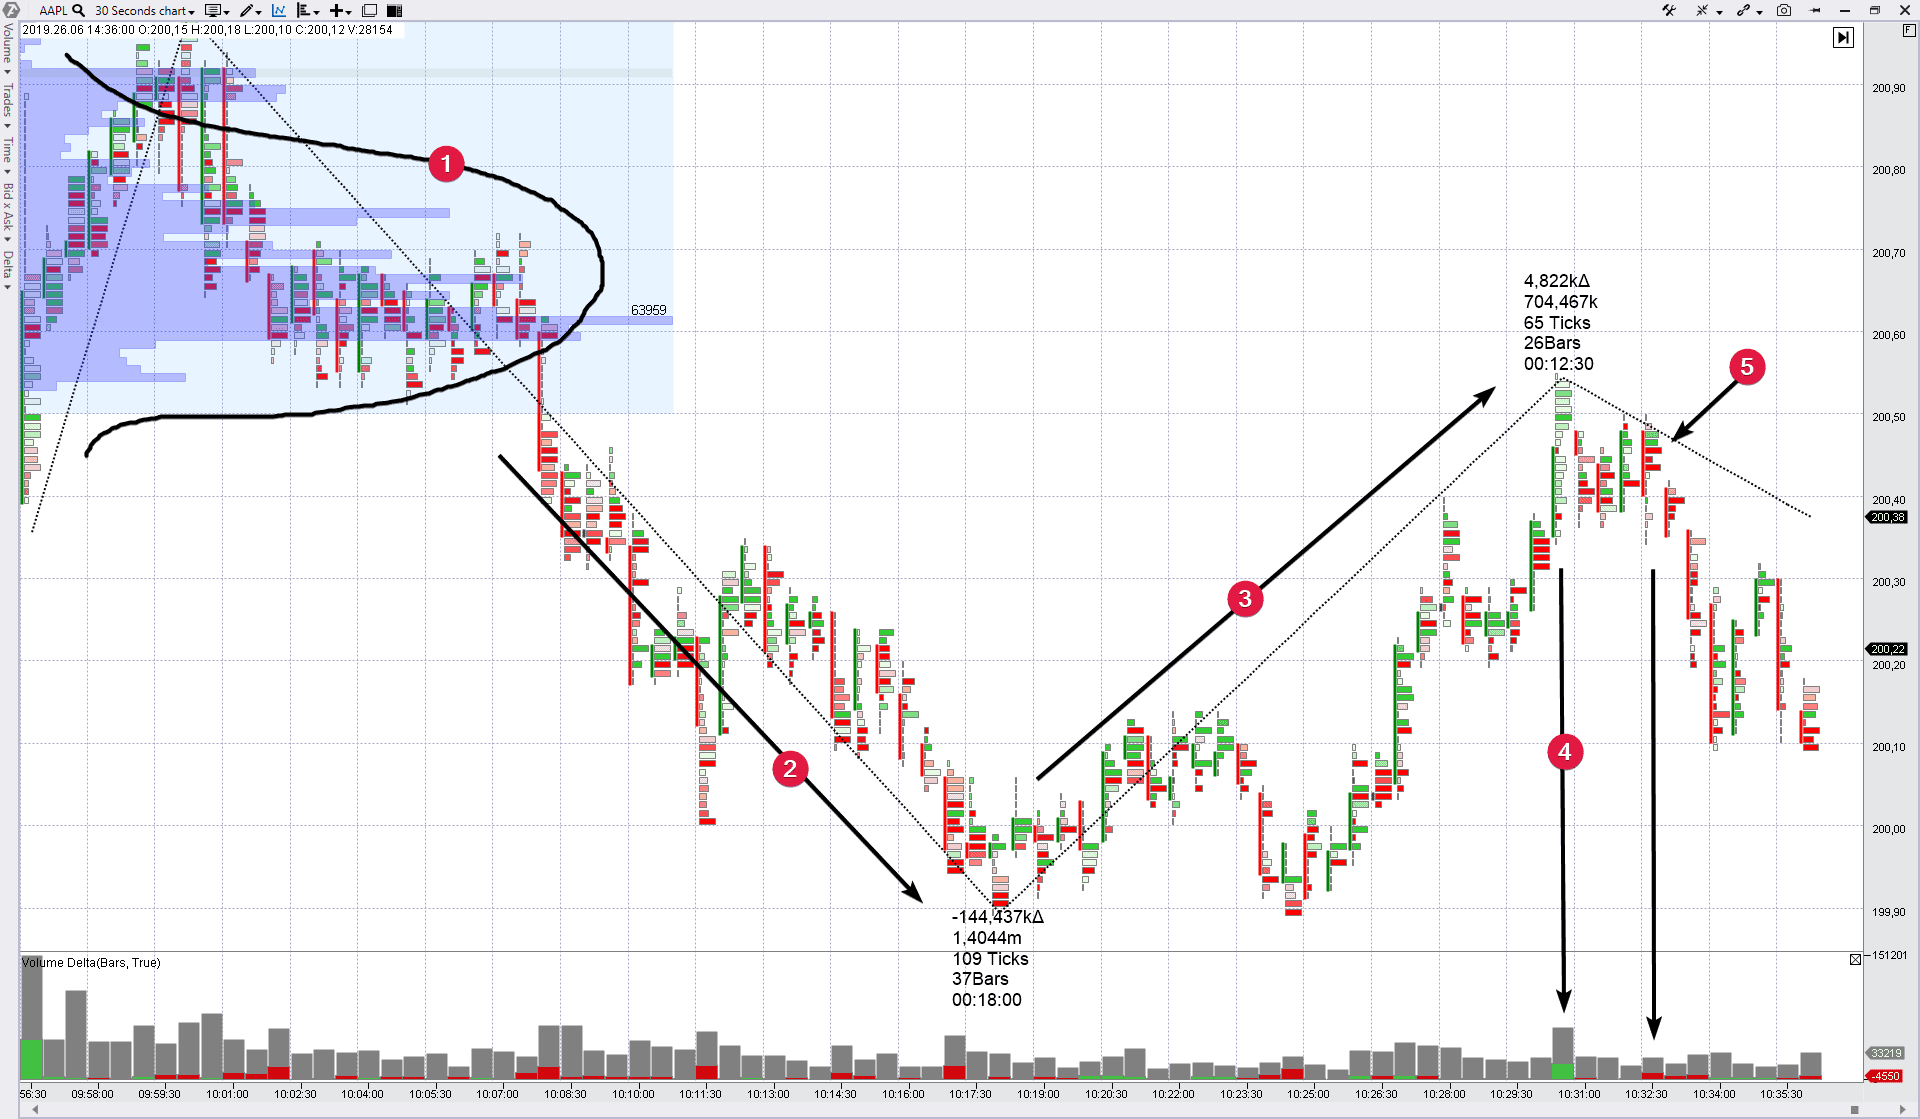
- We marked the initial balance, which was formed immediately after opening the session, with number 1.
- Wave 2 is confirmation of the fact that the traders arrived to an agreement that the price is too high and the real value of the stock is somewhere lower at the moment.
- It was already ‘oversold’ at the bottom of wave 2 (under the round level of 200).
- That is why the correction movement number 3 was started.
- The bar marked with arrow 4 sends a signal about a probable end of the correction. Why? First, a splash of volume with a bright positive delta. Second, the supposed correction wave 3 length (65 ticks) is not much longer than 50% of the impulse wave 2 (109 ticks). Third, the volume of the supposed correction wave 3 (704 thousand) equals 50% of the impulse wave 2 volume (1.4 million).
- Taking the above facts into account, bar 5 looks like a signal for a well-thought-out action. The delta turns red, marking the beginning of the perspective downward wave.
Let’s assume that we:
- sold at 200.40;
- posted a stop behind the POC of balance 1 – 200.70;
- posted a take at the renewal of the low of wave 2 – 199.90.
Reward to risk ratio is 80 : 30 = 2.6.
Everything worked dynamically. A setup was formed during 1 hour after trading started. The take was activated 45 minutes after the entry.
Summary for the strategy of trading on rollbacks.
Let’s draw some conclusions for the strategy of opening trades on rollbacks:- The previous impulse action of the price means breakout of a range (balance) and probable beginning of a positive trend. In order to join the trend at the best price a trader takes the waiting tactics for entering on a rollback.
- The size of a normal rollback is, as a rule, 50% of the previous impulse movement. This refers both to the wave height (in terms of the price) and wave volume (the cumulative wave volume).
- Excessive activity (local climaxes) at the level of 50% of the ‘way back’, as a rule, means the end of a rollback and beginning of the reversal towards the initial impulse.
- The entry signal could be received through the indicator data (for example, the delta colour change) or price/cluster action (for example, a breakout of the previous bar extreme point).
- Analyze things on the basis of facts in order to catch the beginning of a fluctuation, which has a perspective to develop into a significant wave.
- Keep the reward to risk ratio in your favour – not less than 2:1.
No. 5. Volume trading strategy. Trading on breakouts.
Logic. Trading on a breakout is a strategy of trading in the trend markets.- Either the market starts a supposed trend leaving a range;
- or it is already in a confirmed trend, …
… a trader buys bullish breakouts and sells bearish breakouts. He believes that the trend will continue. As a rule, the price behaves very fast at breakouts and if you enter a breakout in time and in a correct direction, this trade would soon start making profit, which could be significantly increased later.
Buying breakouts is applied in volatile and unstable markets where the asset price has a tendency to change in one direction during a long period of time.
- What are the signs of a trend market?
- How to work in the market by the strategy of trading on breakouts?
- How to identify a breakout entry point?
Let’s consider some examples.
Example. Buying AMZN stock by the breakout strategy.
Let’s consider a trend market of the Amazon stock. It is a day period. The coverage is March-April 2019. As we can see from the moving average dynamics, the trading is going on with the ascending tendency.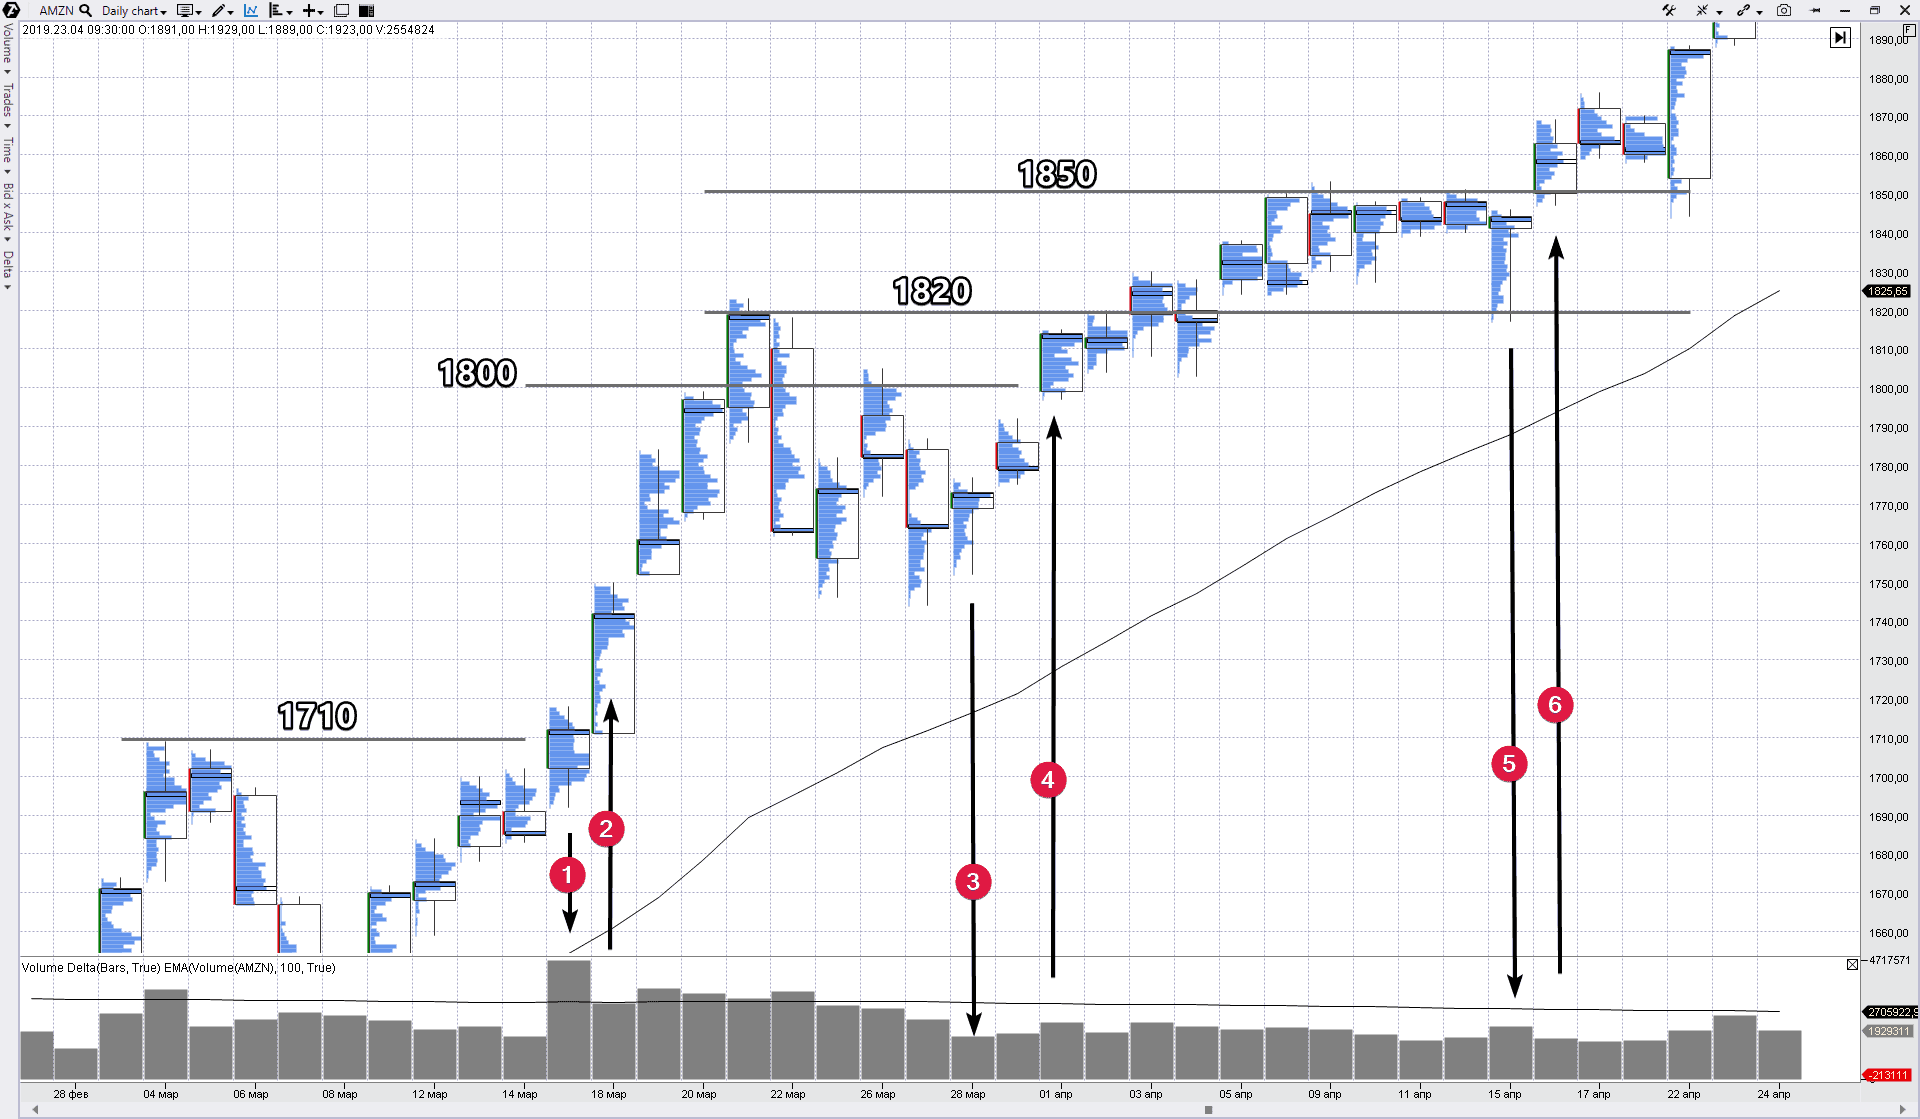
- The trading volume increased significantly on March 15 (1) after extremely low activity on March 14. An idea arises that the market might move out of the range, limited by the resistance of 1,710. According to this idea, the market was inactive on March 14 due to absence of sellers and the ‘bellied’ profile on March 15 meant efforts of the buyers to overcome resistance of 1,710.
- Taking into account the arguments of the previous paragraph, the fast growth after opening on March 18 (2) provided a ground for entering into buys by the breakout strategy. As we can see post factum, the cost of the stock grew during several sessions up to 1,800.
- Overcoming the round level of 1,800 produced an effect of emotional euphoria and the market entered the state of overbuying. The peak of March 21 is an example of a short-term trend against a growing trend. The price rolled back ‘pushing away’ from the level of 1,820.
- Note the candle of March 28 (3) – a long downward tail, the profile narrows down to the bottom and the general volume is not big. This tells us that the rollback, most probably, has finished and there are no traders who wish to sell the stock near 1,750. The price increase with the general increase of the volume on the next day on March 29 (4) confirms this idea. That day broke the highs of the previous two days and may serve as a setup. April 1 is another strong day with an upward gap and general increase of the volume. This behaviour, most probably, represents the market action before the breakout of the previous peak. That is why, the buy on April 3 by the strategy “on breakout of 1,850” looks justified in the general context.
- One more setup “on breakout of 1,850” was on April 16 (6). Note the action on April 15 (5). The cunning market threw away all the buyers, who posted stops near already well-known level of 1,820 and higher, by a long ‘downward tail’. This manipulatory downward movement was a method to confirm the genuineness of the upward breakout.
Tom Williams, the founder of the VSA trading system (we told you his story in the beginning of the series of articles about VSA and cluster analysis), preferred to enter the market on the price growth (with or without a breakout) after the day of ‘testing the supply’. He looked for a bar in a day’s chart, which went down but closed above with a small general volume. It is the test of supply on March 28 in our chart. The further price growth with the volume increase (a splash of buys) confirm the market strength.
Where to post stops?
It seems reasonable to post stops in the ‘no supply’ area. In principle, a strong market does not have a tendency to come back to that point where a deficit of sellers has already been confirmed, if we exclude manipulatory movements in the ‘stops kick off’ style, which we observe on April 15.Where to post takes?
Hold your position as long as possible while the market shows by its behaviour that it is strong. Move stops upward, but watch out manipulations. Register the profit when the market would show obvious signs of a reversal.Trends last longer than you can imagine. Tom Williams
Example 2. Selling bitcoin on the support breakout.
The article turns out to be very big, that is why the next chart will be accompanied with minimal comments.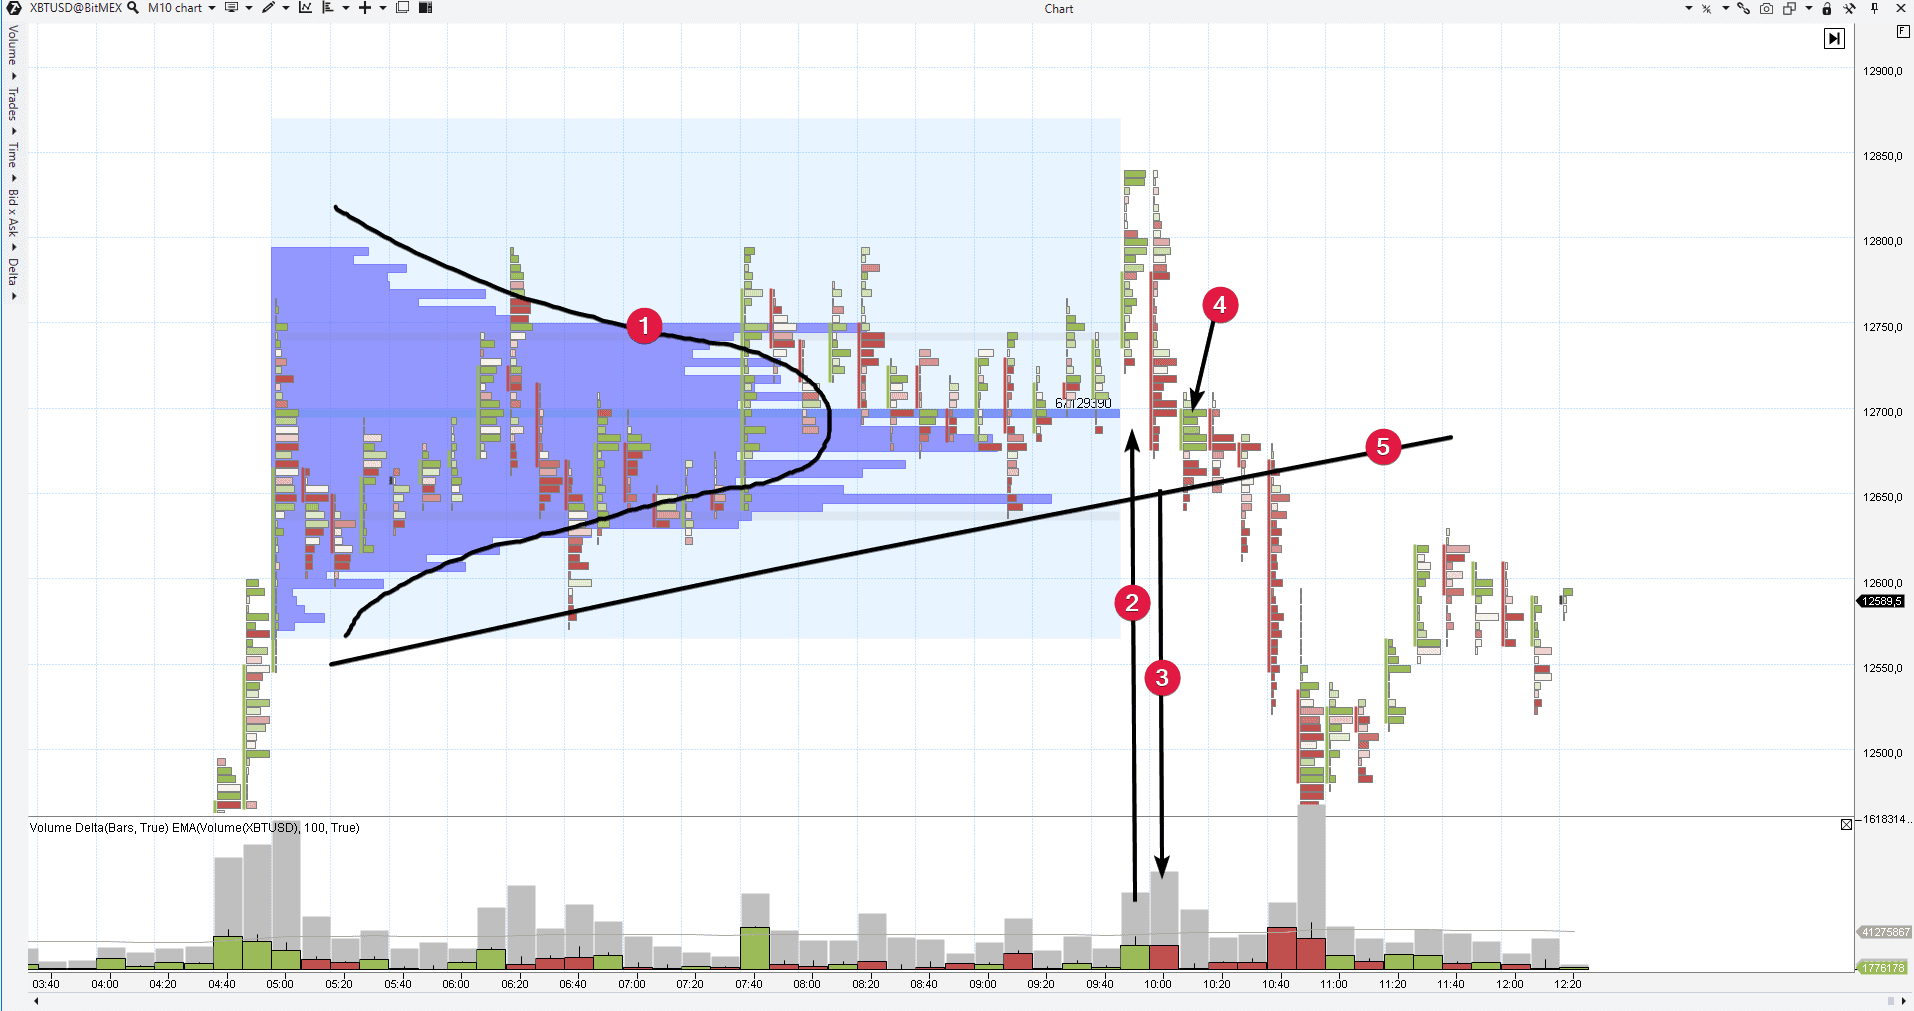
- The balance of demand and supply formed some range with a bell-shaped profile and POC = 12,700.
- It looks like an effort of the buyers to push the price even higher (growth of the volume on a positive delta), but what did it result in?
- The sellers reversed the price immediately. We received the information that the market “does not want to move up” from the balance. So, we get an idea for selling short.
- This splash of buys didn’t result in growth. It means that the sellers are locked in bad positions, which is one more coin into the bank of a game on a ‘bearish breakout’.
- We post a sell order under support level 5.
Where to post a stop and take?
Look at the market action before it entered balance 1. There was some growth there and the buyers proved their predominance at the level of 12,000 and higher. This fact determines the tactics of a fast take profit, since the recent growth, most probably, hindered the development of a descending wave.Let’s assume that we:
- sold at 12,630;
- posted a stop at 12,730 (above the POC and weakness point 4) – 200 ticks (the price increment on BitMEX is USD 0.5);
- posted a take on 400 ticks – just 2 times more than the risk – at 12,430.
As you can see, our tactics worked and we took a fast profit.
Summary for the strategy of trading on breakouts.
Let’s draw some conclusions on the strategy of opening trades “on a breakout”:- The previous price action means either preparation for a trend or an already formed trend (accumulation is preparation for increase and distribution is preparation for decrease).
- The delta is obviously positive during an upward breakout – it shows an effort of the buyers to break resistance. The opposite is true. The delta is obviously negative during a downward breakout – it shows an effort of the sellers to break support.
- Before a breakout in a real direction, false breakouts take place in the opposite direction (traps) more often than on average.
- Limit orders are often used for entering a breakout, since the impulse develops fast on a breakout and traders may arrive too late for entering at a good price.
- Analyze things on the basis of facts in order to catch the beginning of a fluctuation, which has a perspective to develop into a significant wave. Keep the reward to risk ratio in your favour – not less than 2:1.
General summary for 5 volume trading strategies.
We agree that the article turned out to be long and rather difficult for perception. But we hope it will be useful for readers. We didn’t consider the context, commission payments and other things in our examples. We wanted to show the logic of decision making by traders by different strategies.Let’s consider one more (the last one in this article) chart as a conclusion. It is the Facebook stock market with a very fast period. 1 bar with clusters is equal to 75 ticks.
The chart below shows a local peak in the FB market on Wednesday, May 29, 2019, trades.
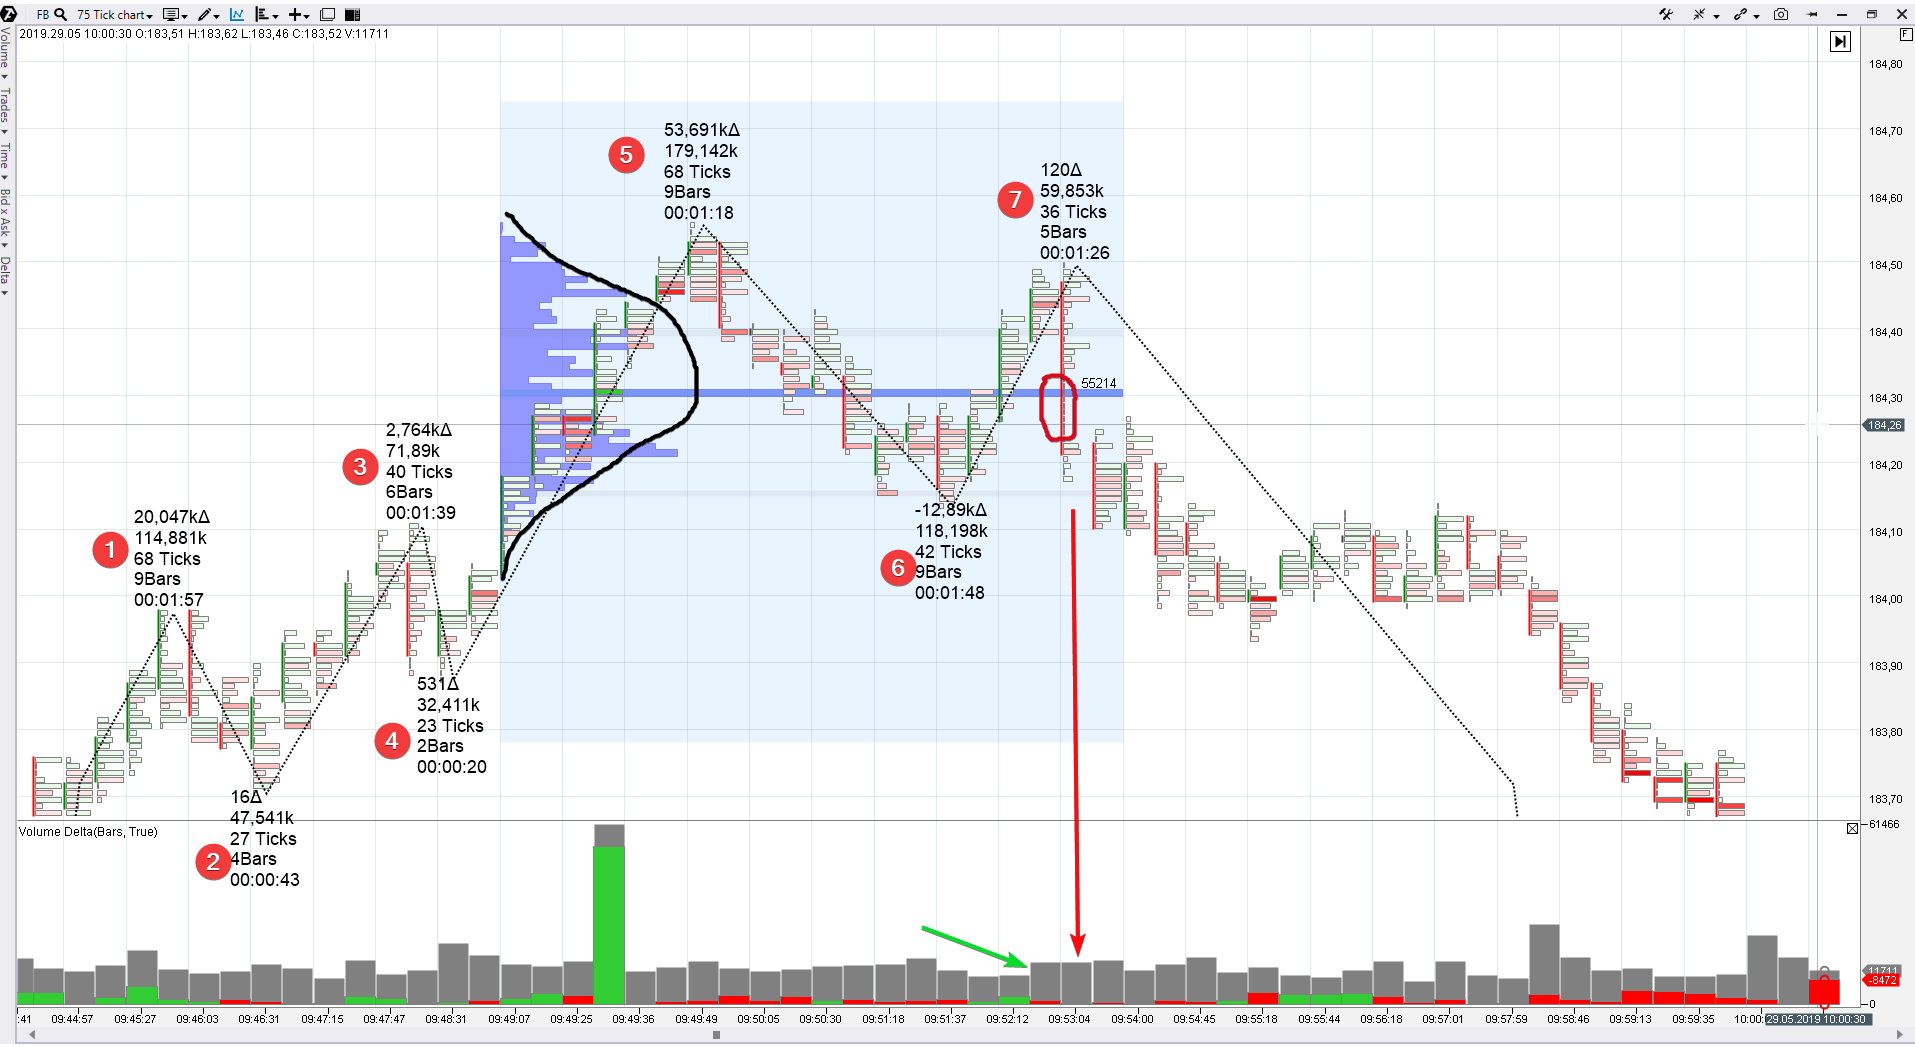
- The growing wave 5 has an extremely high volume (even if we exclude one major buy, which resulted in an abnormally high bar in the bar chart).
- Wave 6 accumulated the volume of 118 thousand, which is two-three times more than on 2 previous descending waves 2 and 4. It tells us about the selling pressure, which enters the market.
- The next up-wave 7 (the volume is only 59K) tells us about weakening of the buyers’ pressure. Note the green arrow. The demand ‘exits’.
The bar, which is marked with a red arrow, starts a new downward wave, which has a perspective to develop into significant sizes and reach local lows of the previous day at about USD 183. This bar is the place for opening sells by the strategy of trading against a trend, noticeable by points 1-2-3-4-5-6.
Note a crooked red oval. It shows as if there is absence of trades at several levels. A sharp movement with ‘empty’ clusters could be explained as a method to ‘lock’ the traders, who were waiting for an upward breakout and whose buying activity formed an implicit bell-shaped profile (a crooked black curve), in loss-making positions. The profile often forms the ‘p’ shape during reversals, but everything happened too fast in this case. The downward movement should ‘squeeze all juices’ from the buyers of peaks – emotional and financial.
Let’s assume that, if trading against a trend, we …:
- enter into a short at 184.20;
- post a stop behind peak 5 – for example, at 184.70;
- post a take at the level of the local low of the previous day 183 (the chart above doesn’t show activity of the previous day),
… then the reward to risk ratio would be 2.4:1. We should note that the goal was reached within 15 minutes and the market set the day’s low at the level of 181.50 in 3 hours after the selling point.
Conclusion.
We’ve just described the logic, by which an intraday trader, who works against a trend, would open a short.But if we look at the previous session on May 28, we would notice that the price formed three local peaks during a day (not shown in the chart): 184.70, 184.66 and 184.54. Thus, the resistance level of 184.65 was marked. The trader, who works by the strategy of reversal from the level of the previous day’s resistance, can increase the selling pressure together with the counter-trend seller (whose logic we described above).
The seller of bearish breakouts will join them a bit later (when crossing the support, which was drawn through lows 2-4-6).
As you can see, different traders, who work by different strategies and on different periods, may enter the market nearly simultaneously. And all of them will enter into shorts. They can enter in opposite directions in a different situation.
In reality, thousands of strategies with a multitude of periods produce an endless flow of signals for buying-selling.
One of the funny things about the stock market is that every time one person buys, another sells, and both think they are astute. William Feather
The main conclusion of this article, which we would like to make, lies in the following.
Whatever strategy you use in trading – act on the basis of facts. Justify your moves using the price (price waves) and volume analysis, progressive instruments (deltas and profiles) and different types of charts. Practice and improve your skills. You will notice after some time (it does take time) that “this is it! it will break now!” – you will see it all. You will enter a perspective trend without any doubt why you do it, while a beginner trader will be in doubt.
Best of luck and do not forget to press the like button!


