ATAS indicators & Forex strategies.
In our previous articles, which you can read here and here, we already conducted several experiments on application of a rich arsenal of the ATAS platform in order to increase profitability of trading by standard Forex strategies. Let’s continue this topic.
In this article we decided to analyze only one Forex strategy. It is called Impulsive/Corrective Wave Retracement (ICWR).
The strategy developers write that it works equally successful both on intraday and longer timeframes.
Read in this article:
- Rules of the trading strategy;
- Analysis of a trading situation in 5-minute E-micro EUR/USD futures (M6EM9) charts;
- Analysis of a trading situation in 4-hour E-micro EUR/USD futures (M6EM9) charts.
Rules of the trading strategy.
The strategy uses Fibonacci retracement levels and RSI indicator. The main idea is to:
- enter into the current trend movement on retracement;
- enter into a new trend movement after reversal.
Algorithm of the strategy application. First, we look for a major wave in the chart. The wave should be more than 40 points for 5-minute charts and more than 150 points for 4-hour charts. From the mathematical point of view, the wave length is a difference between its high and low. These points should be local highs and lows. As soon as the wave has been detected, we build Fibonacci retracement levels:
- 0.000 – bottom level of the wave;
- 0.250 – bottom level of confirmation;
- 0.382 – bottom boundary of the corrective channel;
- 0.618 – upper boundary of the corrective channel;
- 0.750 – upper level of confirmation;
- 1.000 – upper level of the wave.
Fibonacci retracement levels are symmetrical in our case, that is why it makes no difference for us in what direction to build them and where 0 and 100% would be.
As soon as a new wave of the required length emerges, the old one becomes invalid. We build Fibonacci retracement levels again and trade by the new wave signals.
We buy if:
- RSI (14) is more than 50 in a day chart. We use this indicator to filter out buying or selling signals and reduce the number of loss-making trades. The strategy developers tested different variants of filter-indicators CCI, MA and RSI with various periods. And they selected RSI(14) after testing.
- Any candle closed within the corrective channel of 0.382-0.618 and the price moved back in the direction of the upper confirmation level of 0.750.
- The whole candle closed above the upper confirmation level of 0.750.
- A strict stop is 50 points. This strategy doesn’t envisage stop movement to the breakeven level and further trailing. The strategy developers selected this stop size also after testing.
- Take profit – receipt of the opposite signal or actuation of a stop signal.
We sell if:
- RSI (14) is less than 50 in a day chart.
- Any candle closed within the corrective channel of 0.382-0.618 and the price moved back to the bottom confirmation level of 0.250.
- The whole candle closed under the bottom confirmation level of 0.250.
- A strict stop is 50 points. This strategy doesn’t envisage stop movement to the breakeven level and further trailing.
- Take profit – receipt of the opposite signal or actuation of a stop signal.
We will use the ruler instrument in the course of our experiment with this strategy in the trading and analytical ATAS platform. It is a convenient instrument for measuring wave characteristics. Just two screen touches and we have complete information – ticks, volume, delta, time and a number of bars in the selected fragment. You can activate the ruler in the upper menu or pressing the F9 key.
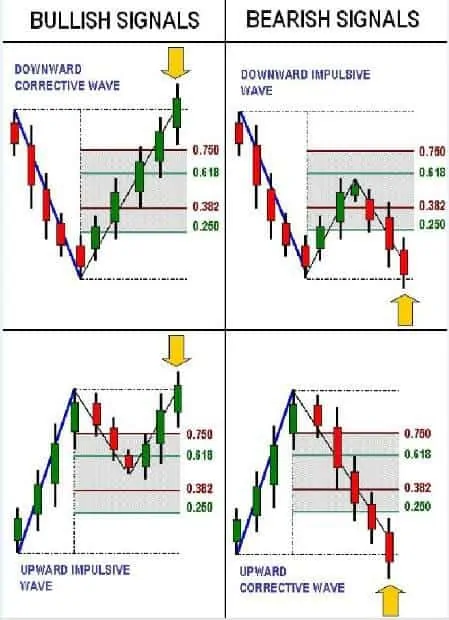
If you find the above rather difficult, look at the picture.
The trading strategy developers distinguish impulsive and corrective waves. The yellow arrow points at the candle, after closing which we open a trade.
Buying signals in the left column:
- we buy when the demand wave overpasses the high of the previous buying wave;
- we buy after completion of downward retracement in the area of 0.5 Fibo.
Selling signals in the right column:
- we sell after completion of the upward retracement in the area of 0.5 Fibo
- we sell when the selling wave overpasses the low of the previous buying wave.
Let’s have a look how the strategy works in real charts.
Analysis of a trading situation in 5-minute E-micro EUR/USD futures (M6EM9) charts.
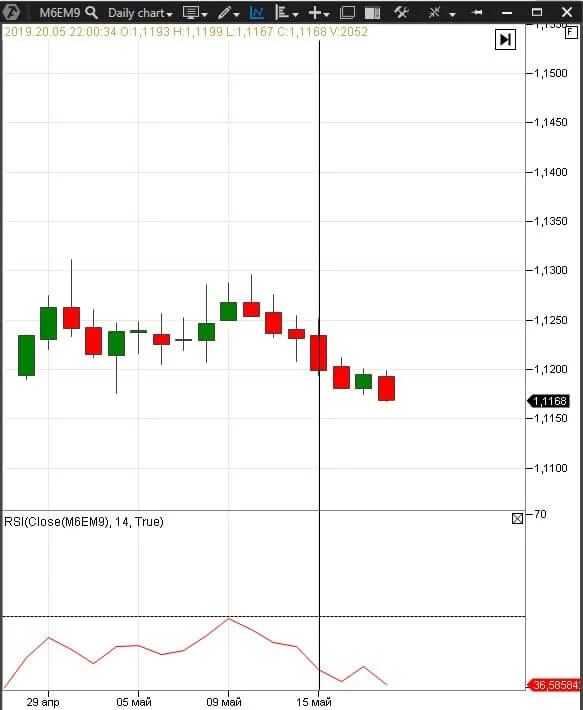
First, we determine what trades we will trade. The black vertical line marks the moment when RSI(14) takes on a value below 50, which means that, further on, we will operate with sells only.
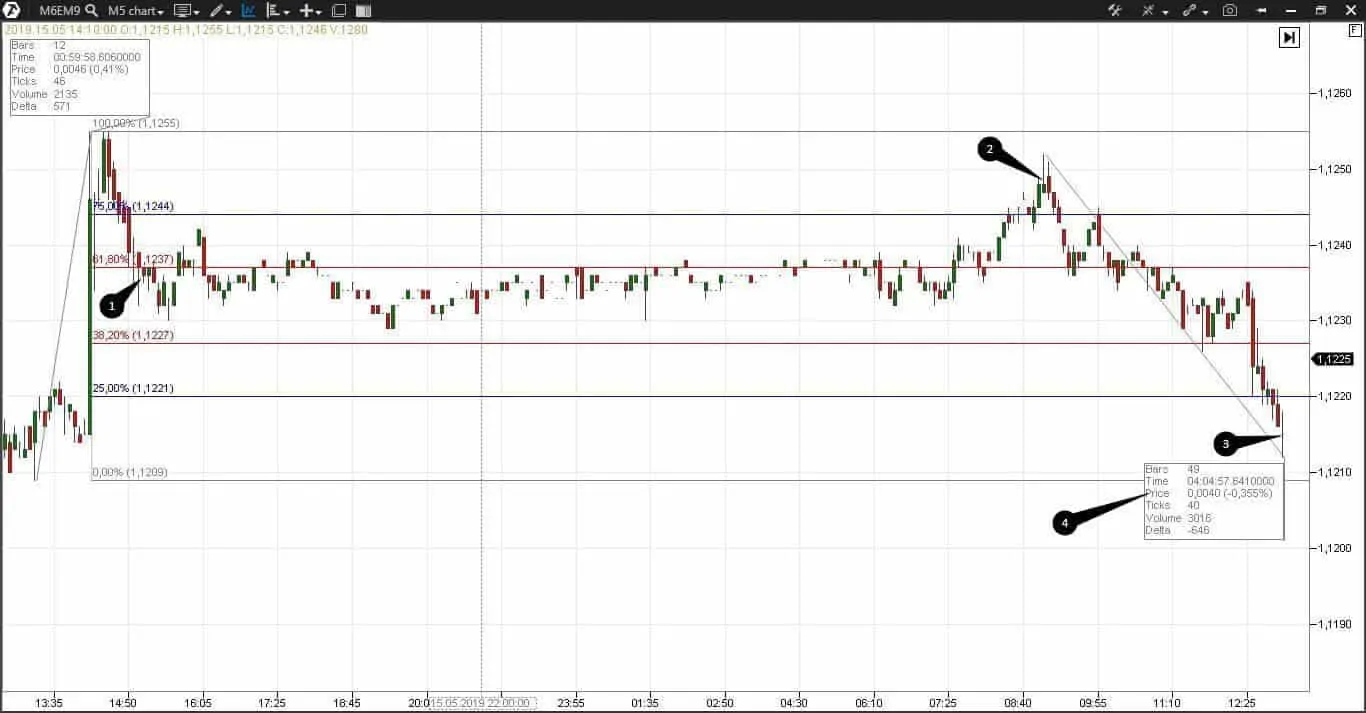
Our next step – we move to the 5-minute chart and look for a proper wave.
The candle closes in the corrective channel in point 1. But later the price consolidates within the limits of the bottom and upper confirmation levels. In accordance with the rules of the trading system we should ‘sit on our hands’ to avoid making thoughtless trades and wait patiently. If we could have made buys, we should have opened a trade in point 2. But we continue to wait and receive a selling signal in point 3. Everything seems fine, but we notice that a new wave of more than 40 points has formed while we were waiting. And we have to start from the beginning! And the trading signal in point 3 is invalid since it doesn’t coincide with the bottom point of the new wave. We narrowed the chart in order to assess how inefficient our trading strategy was in this situation.
The price didn’t retrace to the corrective channel even once after the new wave 2. Of course, a trader vision of the chart has a certain freedom in rendering the situation and we could afford opening a short, but this is the issue of discipline of each individual trader.
And now we will transform a disappointing trading situation into a profitable one.
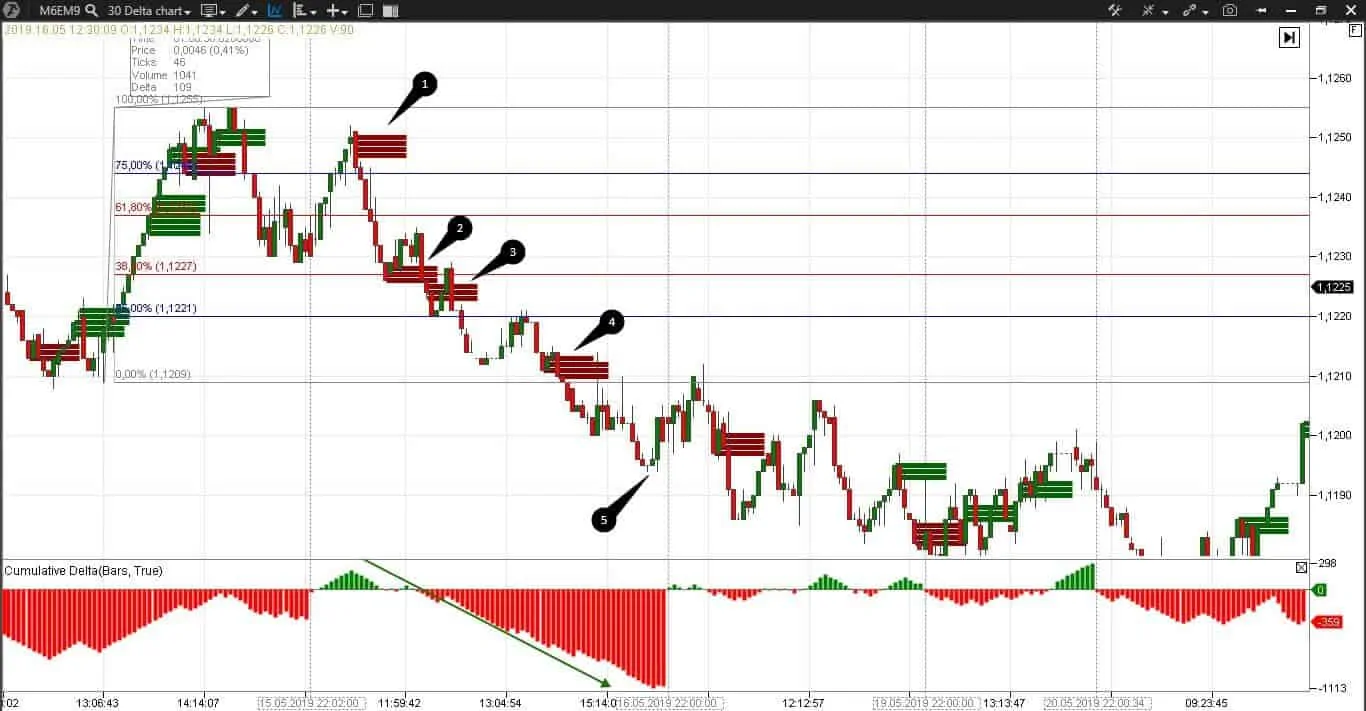
First, we will replace the time chart with the delta type chart with the period of 30. It means that a new bar will be formed only after the difference between buys and sells would be more than +30 or less than -30 contracts. Such a chart clearly shows overweights of buyers and sellers. If the bars are formed quickly, it means that there is no fight and one side has a clear advantage. Let’s add cumulative delta and stacked imbalance indicators. It might seem strange that we want to add the cumulative delta to the delta type chart – much of a muchness. But, in fact, it is not so. The cumulative delta indicator will help us to see the general dynamics of sells and buys from the beginning of the trading session. The stacked imbalance indicator will highlight levels where aggressive buyers or sellers were in much bigger numbers. We adjusted overbalance in 300%, which means that there should be not just more buyers or sellers, but 3 times more. All these ATAS tricks not just help us to see the levels, where the buyers’ or sellers’ pressure is something special, but burst upon our eyes. We want to warn our readers that we do not build a clear trading strategy with the help of ATAS indicators. We studied the battlefield, digged a fire trench and prepare a grenade launcher.
We can see multiple green imbalances of buyers and multiple red imbalances of sellers.
How to act with this setup. We will open short sells at the seller imbalance levels and move the stop along the local price highs. We were late to sell in point 1, because the price passed this level very fast and didn’t come back to it. We sell with limit orders confidently and without haste in points 2-4 and can accumulate the position, because the price stops at these levels and tries to retrace but fails. The accumulated negative delta (marked with a green arrow) increases, which means that we go with the market. We close all trades in point 5 in the end of the trading session, since we do intraday trading.
Our result is 3 profitable trades. We will not calculate potential income and comparison, since we didn’t open a single trade by the Forex strategy.
Analysis of a trading situation in 4-hour E-micro EUR/USD futures (M6EM9) charts.
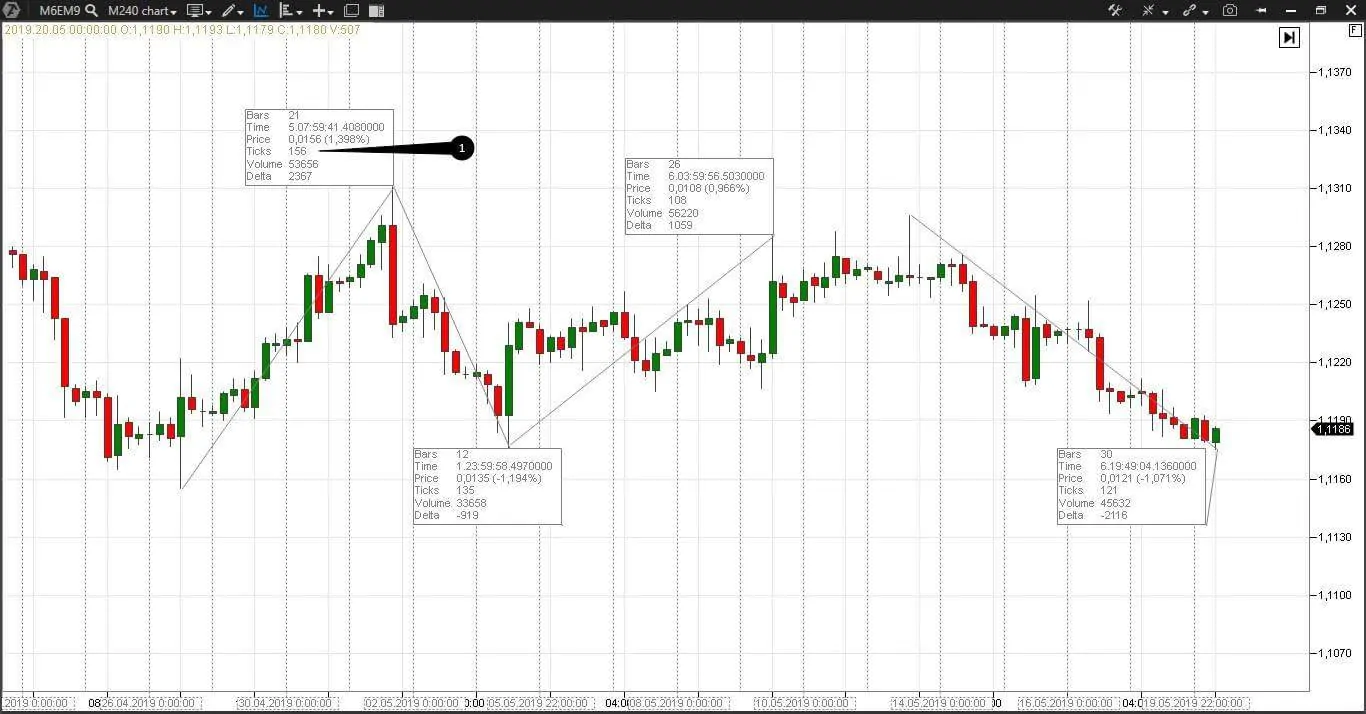
We will follow the same rules in 4-hour charts but will focus on looking for a wave of more than 150 points. We measured several waves with the ruler in the following picture. The farthest wave, marked with number 1, is suited for our trading.
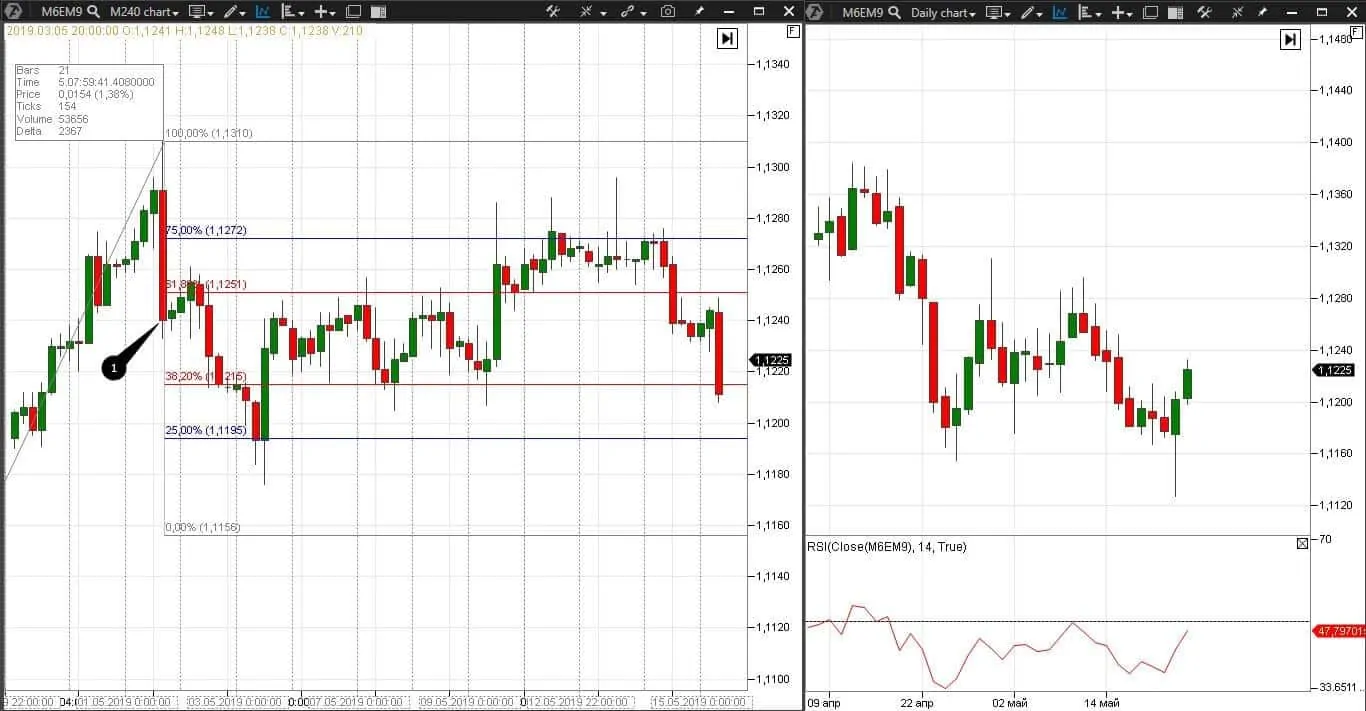
RSI (14) is below 50, which means that we again look only for sells in the chart.
And again, we cannot open even a single trade by rules of the trading system. Despite the fact that a candle closes in the corrective channel in point 1, not a single candle further on closes as a whole under the bottom confirmation level. We will wait for emergence of a new wave of more than 150 points to start trading.
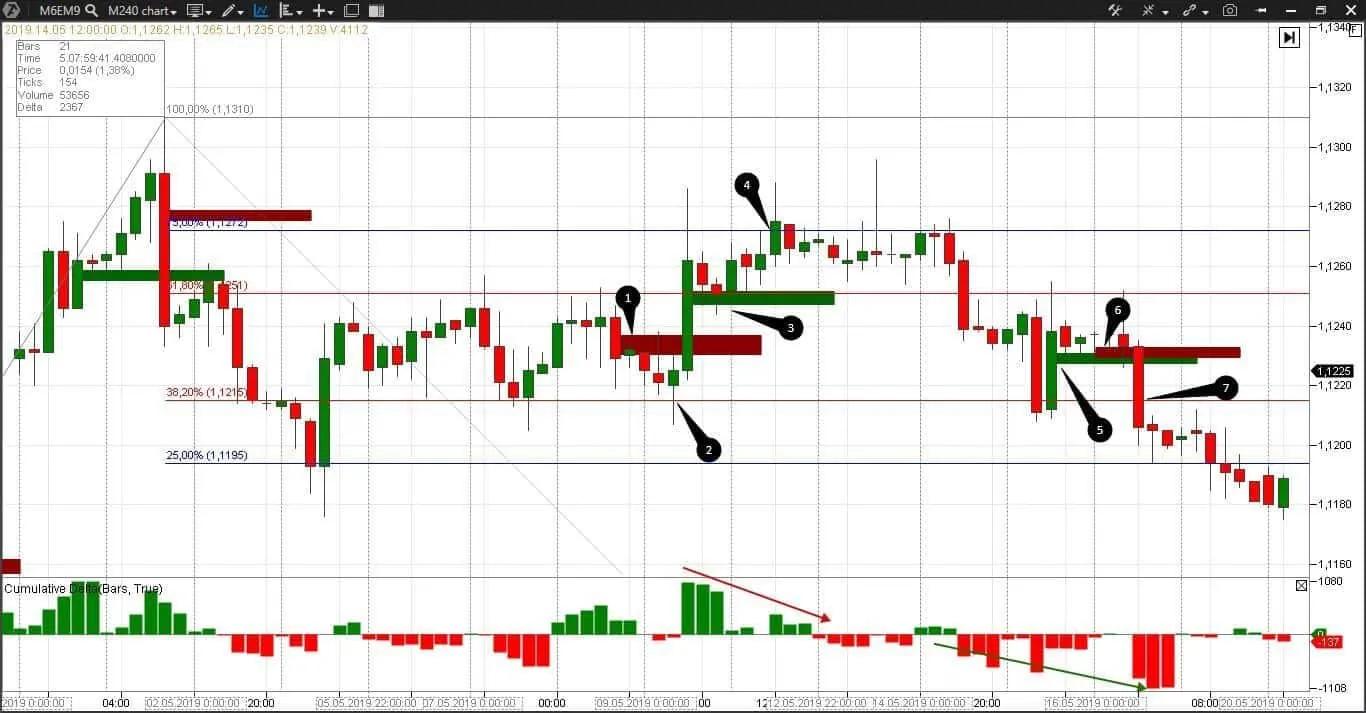
And now we will add familiar ATAS indicators – cumulative delta and stacked imbalance. Maybe we will find trading opportunities this way. This time, we will not change the chart type and use 4-hour chart.
Do you know why the Forex system didn’t provide us with even a single trading opportunity? The matter is that the market is not in a trend movement but in a flat or range. Note that, when trading in a range, Fibonacci retracement levels serve as local levels of support/resistance. We will enter into trades at the imbalance levels as we did in 5-minute charts. But since we visually identified that the price moves in a range, we will both sell and buy. And we will close the trades at Fibonacci retracement levels. We sell in point 1 and close in point 2. We buy in point 3 and close in point 4. We buy in point 5 but close this trade with a small loss in point 6, since the opposite imbalance emerges. If we would have used the cumulative delta as a filter, we would not have bought in point 6, since the negative cumulative delta increases, which means that sellers predominate in the market. We do not want to fight against the market, we want to go with the stream. We again sell in point 6 and close the position in point 7.
Our result is 3 profitable trades and one breakeven or small loss trade. And again, there is no sense to calculate a comparative profit, since we didn’t open a single trade by the Forex strategy.
Conclusions.
ICWR will find its followers and fans as any other strategy. Perhaps, you would change the wave length for your instruments or apply other capital management rules. We tested this strategy on currency futures, because this is the primary bread of the Forex fans.
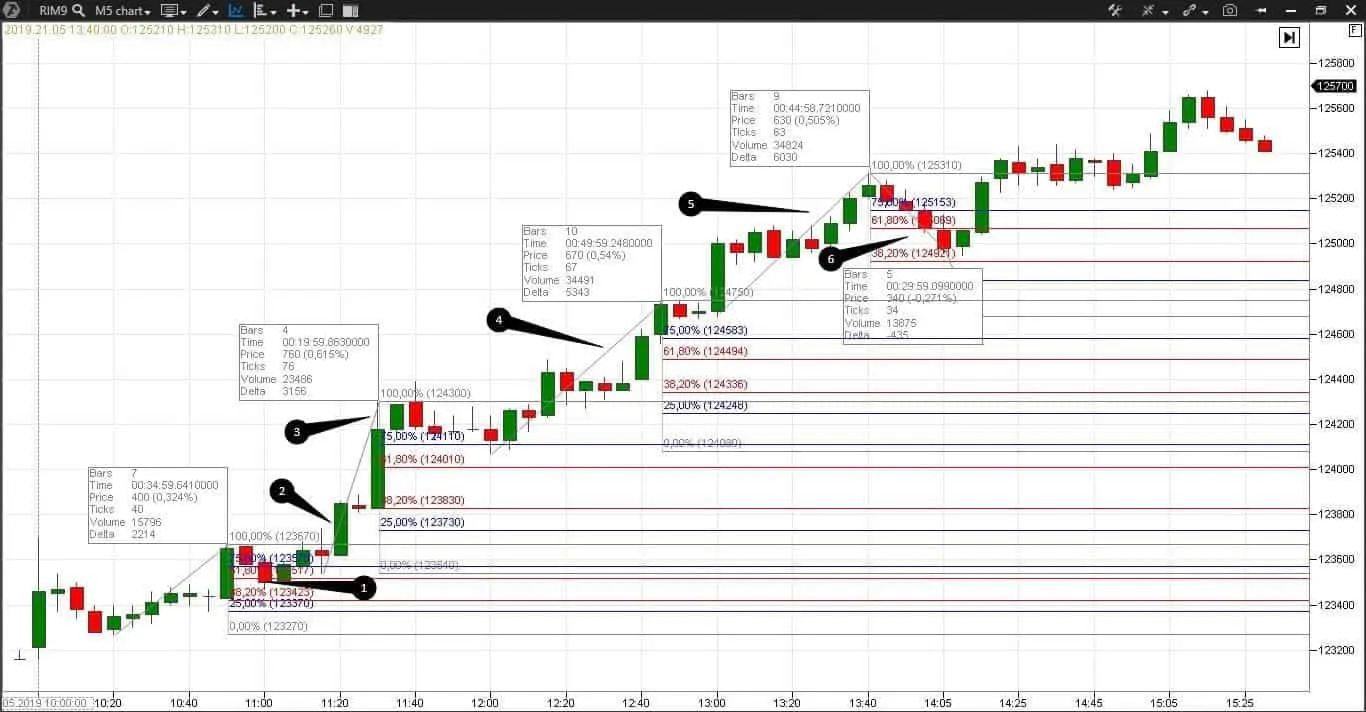
In order to make a fair and all-sided assessment of the strategy, we will give an example of an RTS index futures (RIM9) on a trend day.
The candle in point 1 closed in the corrective channel and now we wait for the trade opening signal. RSI(14) is bigger than 50, that is why we will buy. The candle in point 2 closes completely above the upper confirmation level – we buy. We set a strict stop 50 points below the entry price. A new wave with number 3 emerges, we draw Fibonacci retracement levels again and wait while the candle closes below the bottom confirmation level in order to exit the trade. We do not see the closing signal in this wave. The next wave with number 4 emerges, but there is no exit signal yet. The corrective wave 5 is too short for building Fibonacci retracement levels. We continue to make profit. We will not add ATAS tricks to this chart, since we just wanted to show that the strategy under consideration could be profitable. If you are a very patient and disciplined trader and are ready to trade exclusively on trend days using a small number of instruments, ICWR is for you. Perhaps, you should know that trend days, according to the Market Profile researcher statistics, account for only 9.5% of all trading days.
| Advantages of the Forex strategy. | Disadvantages of the Forex strategy |
| Allows being in a trade as long as possible and accumulate profit in the trend market. | Trend movements in the market are much rarer than a flat |
| Long strict stops | |
| Low efficient for intraday trading |
So, what to do – trade only 9.5% of trading days with the help of the trend strategy and simple instruments or use advanced software and make money every day? The decision is yours. However, you cannot deceive physiology and you want to eat every day but not 3 days a month. ATAS will provide you with the opportunity to make money every day using various methods. Do not limit yourself.

