Up-Thrust Pattern for aggressive trading.
Aggressive trades are moments of splashes of volatility, when the Time and Sales Tape shows a series of major buys and sells. These actions testify to activity of major exchange players. But what do they do? How to act in a harmony with professionals?
This article will help you to learn how to recognize intentions of a major player by certain patterns. Up-Thrust is one of such patterns.
Read this article and you will learn how:
- the Up-Thrust Pattern looks like and how to use it;
- not to fall into a trap of a major player and not to become a supplier of his profit;
- to identify the moment of an Up-Thrust Pattern culmination;
- to set your chart in such a way so that to see intentions of major aggressive traders.
What the Up-Thrust is
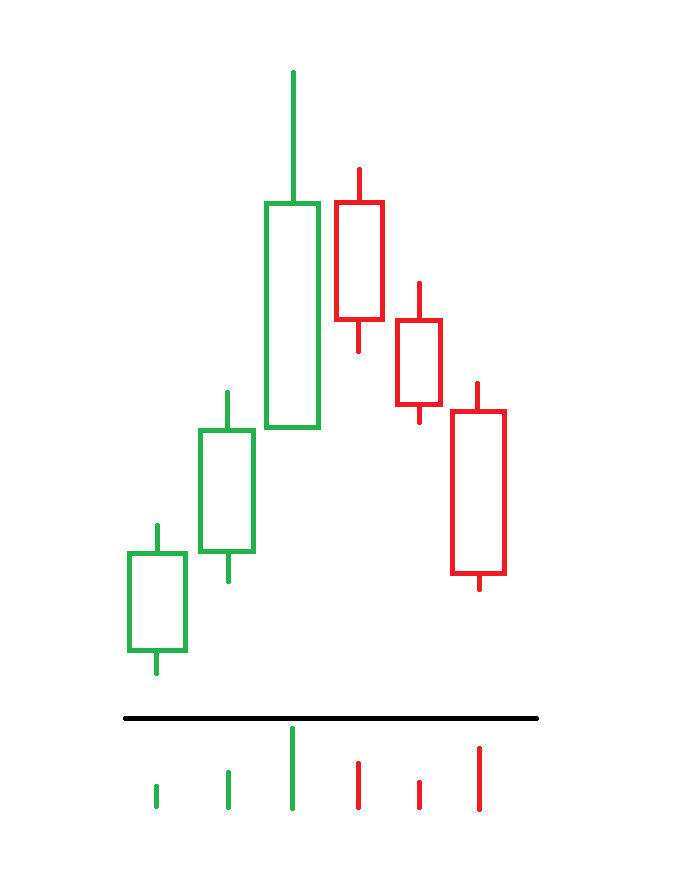
Up-Thrust is an upward protrusion or extrusion. This pattern belongs to the Volume Spread Analysis (VSA) system. The Up-Thrust Pattern can manifest itself in the candlestick chart in the form of a major upward candle on a super-high volume and further downward movement. Such anomalous candles frequently appear in the market and are connected with the manifestation of aggressive trading. Similar situations could take place after broadcast of important news, Non-Farm Employment Change report, published by the Bureau of Labor Statistics, for example.
Emergence of the Up-Thrust Pattern sends a signal to many traders about a beginning of the reversal movement. However, such VSA patterns are also used by major traders for entrapping minor buyers.
A major player uses the Up-Thrust Pattern in order to form a position by favorable prices. In this case, the price will be held with the aim to take out short positions from those who loses hope for a reversal and fixes losses.
A real example of aggressive trading with emergence of the Up-Thrust Pattern
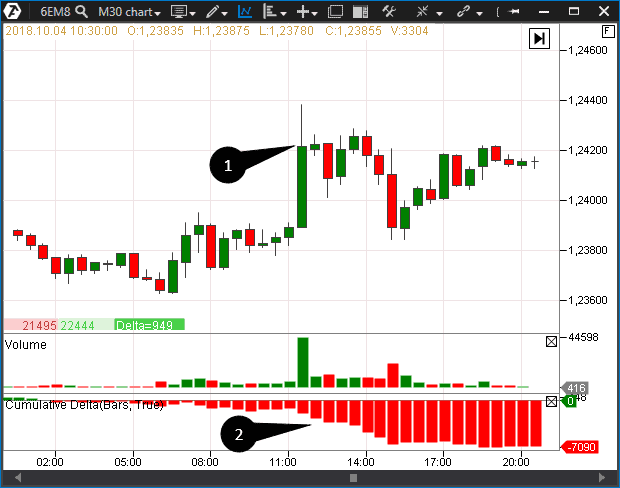
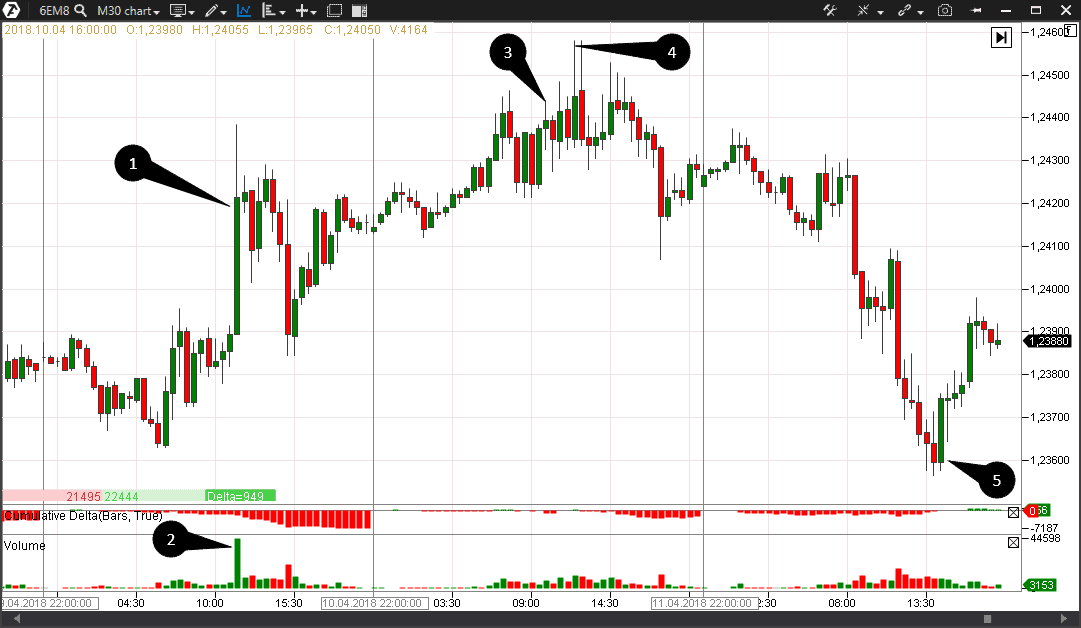
The chart above shows an aggressive upward candle (mark 1) with an anomalous volume – it is the Up-Thrust Pattern.
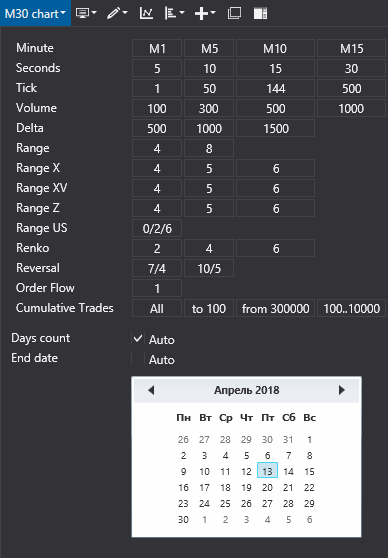
In order to open namely this chart in your computer, launch the ATAS platform, create a new chart and specify the 6EM8 instrument (a EUR/USD June futures). You will need to download historical data from the ATAS platform servers. To do that, set the final date of the downloaded data as April 13, 2018, and select any number of downloaded days within the limit of 10.
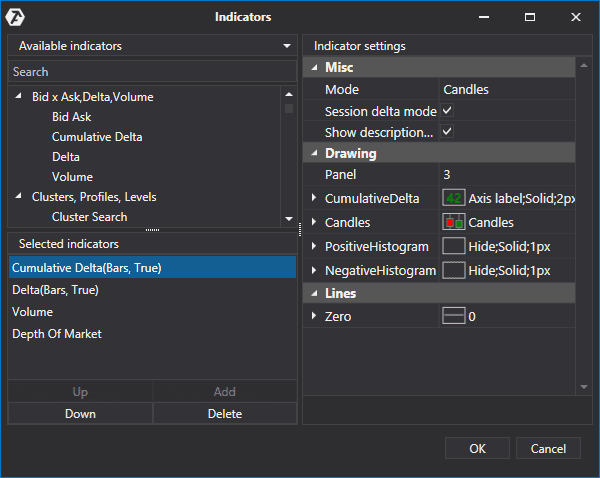
Then add the Cumulative Delta Indicator to the chart. To do that, go to the indicators section by clicking the right mouse button when the mouse cursor is over the chart. Find the Cumulative Delta Indicator in the list and activate it by one click.
Then select the Bars option in the Mode field in the indicator settings and click Add. Perfect. If you did everything correctly, the properly set indicator will appear at the bottom of your chart in the form of a vertical red and green bar chart.
The Cumulative Delta Indicator displays the accumulated difference between the buys and sells volumes during a current trading session in a convenient form. Unlike the Delta Indicator, which displays a delta for each candle, the Cumulative Delta Indicator accumulates the value continuously from the beginning of a session. You can learn more about settings of the Cumulative Delta Indicator this link
A trap for the sellers in the Up-Thrust Pattern
In the chart above, the Cumulative Delta Indicator (mark 2) pointed at the growth of sells after emergence of the Up-Thrust Pattern, however, a culmination did not take place. The futures was traded at length in a narrow range above the Up-Thrust Pattern. The chart shows that the price was held in a narrow range during the next trading session and did not go below the level, at which the Up-Thrust was formed.
A confidence in the price decrease becomes weaker in such a situation, the sellers are in a weary wait and a shadow of doubt in working out a bearish scenario becomes longer and longer.
A special chart will help us to recognize the major player’s intention. To do that, just clone the previously created 6EM8 chart through 2 simple actions:
- mouseover the chart and click the right mouse button;
- and select the Clone the Window item.
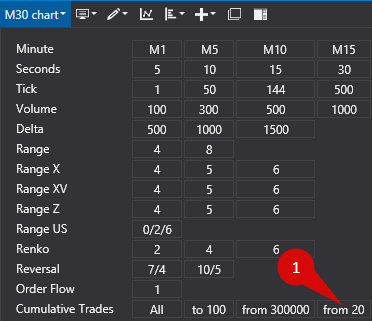
Select the Cumulative Trades display mode in the new window with the “From 20 to 0” parameter. This chart type displays only those trades, which had not less than 20 contracts. These settings would help to detect accumulations of aggressive trades. And in case they are available, we would detect the culmination moments.
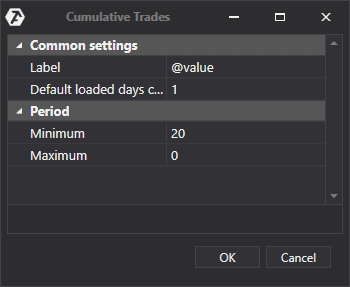
In case there is no “from 20” option among the Cumulative Trades variants, you can add this option by yourself, clicking the Settings button.
Select the Cumulative Trades section in the menu and press the Add button, which opens a dialogue window, in which you can insert your desired parameters. For our example, set the Minimum 20 and Maximum 0. Press OK and a new parameter becomes available for applying in the chart.
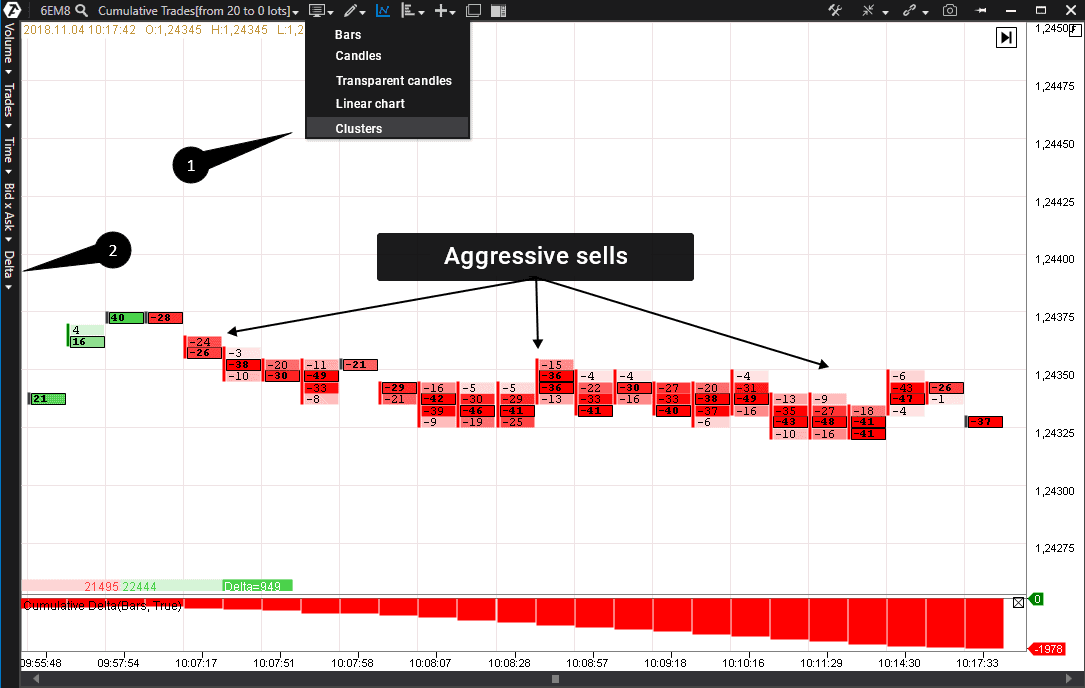
It is necessary to switch the resulting chart into the cluster mode of display (mark 1) and select mark 2 for the Delta display mode:
Zoom into the chart to the degree until the clusters digital values appear (you can do it with the mouse wheel and Shift and Ctrl buttons). Hold Shift and rotate the wheel – this will zoom in/out in vertical direction. Do the same with Ctrl for horizontal scaling.
Find the trading session of April 11, 2018, in the chart, where a number of aggressive sells with more than 20 contracts passed one after another from 10:07 until 10:17 Moscow Time. This section coincides with the top of the Up-Thrust Pattern and means a particular attention from the aggressive traders. Let us note that the seller did not reduce the price. Perhaps, the charge of a major position has not been formed yet.
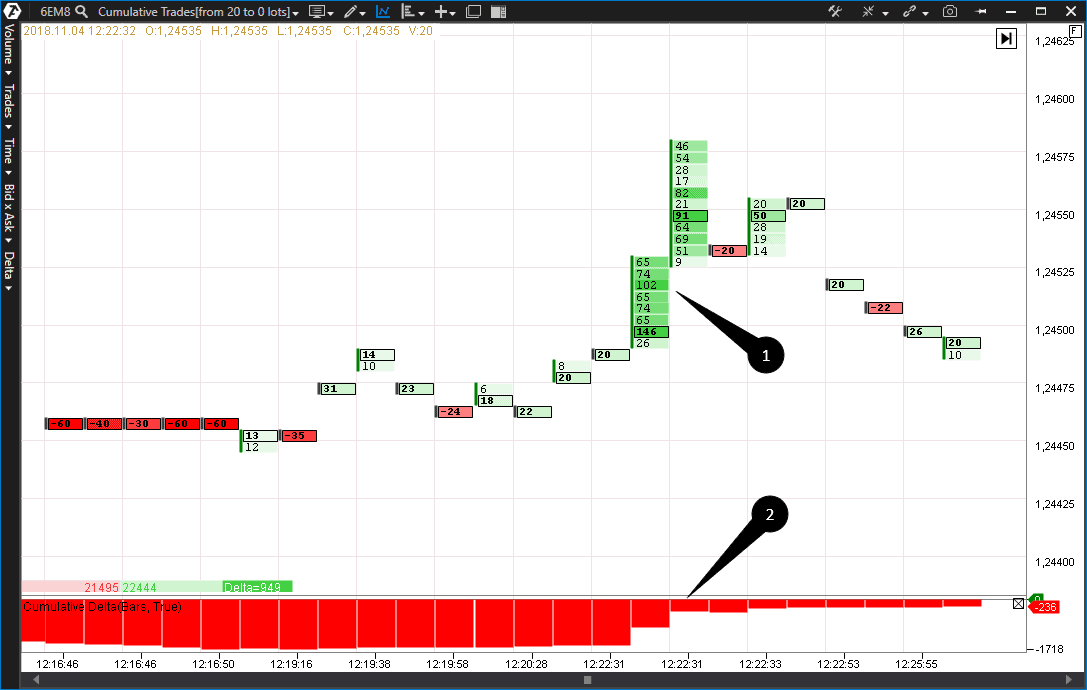
We continue monitoring the price and volume behavior and see that the price moved to the upper area in two hours – the area where the aggressive buyers had emerged earlier. It looks like the stop orders of the traders, who were waiting for the price decrease after the Up-Thrust, were exactly in this area (mark 1 in the chart below).
Working out the stop loss orders resulted in reduction of the Cumulative Delta value (mark 2).
Such a situation points at the Up-Thrust Pattern culmination, which we expected since the previous session. Aggressive buys (mark 1), perhaps, are stop loss orders of the traders, who opened shorts hoping for the price reduction. Formation of a position by a major player by means of activation of somebody else’s stop orders is a frequent event in the market. If a major trader has formed his position completely, a probability of the price reversal increases.
Let us generalize the above described events in the 30-minute period chart in order to understand the above situation better:
1- Emergence of the Up-Thrust Pattern;
2- Pattern confirmation on a higher volume;
3- The area where the first major aggressive sells were noticed;
4- The area of formation of a position by means of the stop loss orders of “the crowd”;
5- Beginning of the profit fixation.
Summary
The considered situation is a good demonstration of the fact that the modern exchange market is full of traps.
The main purpose of the stock market is to make fools of as many men as possible. Bernard Baruch.
Of course, knowledge and application of VSA methods do not guarantee protection from manipulations of major aggressive traders. However, understanding of an intention of a major player significantly increases chances of profitable trading.
We hope that after reading this article:
- you will not “jump” into each pattern only because it appeared in the chart;
- you will wait for a culmination for opening your trades;
- you will use special methods of analysis in order to understand an intention of a major player.

