Cluster Search and Big Trades indicators: 4 differences
The Cluster Search and Big Trades indicators are important instruments from the ATAS platform. They can be very useful to the financial market participants who apply various trading styles. This article has been written in order to help traders to use the Cluster Search and Big Trades indicators correctly. Read in this article:
- Specific features of the Cluster Search and Big Trades indicators.
- What do they have in common?
- The main difference between the Cluster Search and Big Trades indicators.
- 4 examples.
- Additional differences.
- How to use both indicators in practice.
- Bonus.
What are specific features of the Cluster Search and Big Trades indicators?
One specific feature of both Cluster Search and Big Trades indicators is that they use detailed information about trades, which they receive directly from exchanges, as a source. Complete details of ALL trades are specified in this data flow:
- what the trade volume is;
- what the price is;
- whether it is buying or selling;
- trade execution time.
Consequently, those who trade in the market through simple terminals, where the maximum degree of detail is restricted by M1 time-frame and every candle contains data only about Open / High / Low / Close prices (also Volume but not always), cannot use the Cluster Search and Big Trades indicators.
What do Cluster Search and Big Trades have in common?
Both indicators:
- work with detailed data, received from exchanges;
- can work in real time and also can be used for studies based on historical data.
But the most important thing is that Cluster Search and Big Trades show abnormally high trading activity, although they have different criteria for assessing the market activity.
The main difference between the Cluster Search and Big Trades indicators
Cluster Search looks for clusters, in which trading intensity was high. Big Trades looks for individual trades of a big size.
In principle, the difference is clear from the indicator names.
Figuratively speaking, imagine a lake with fish of different sizes. Big Trades is a fisher who looks for a big fish, while Cluster Search looks for a fish shoal.
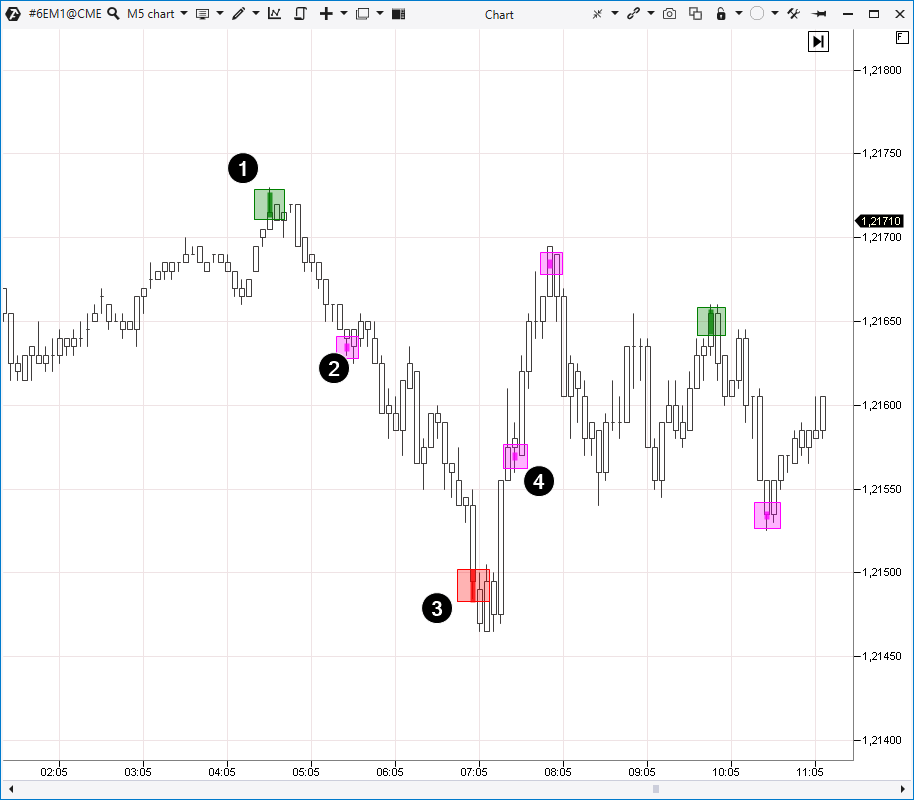
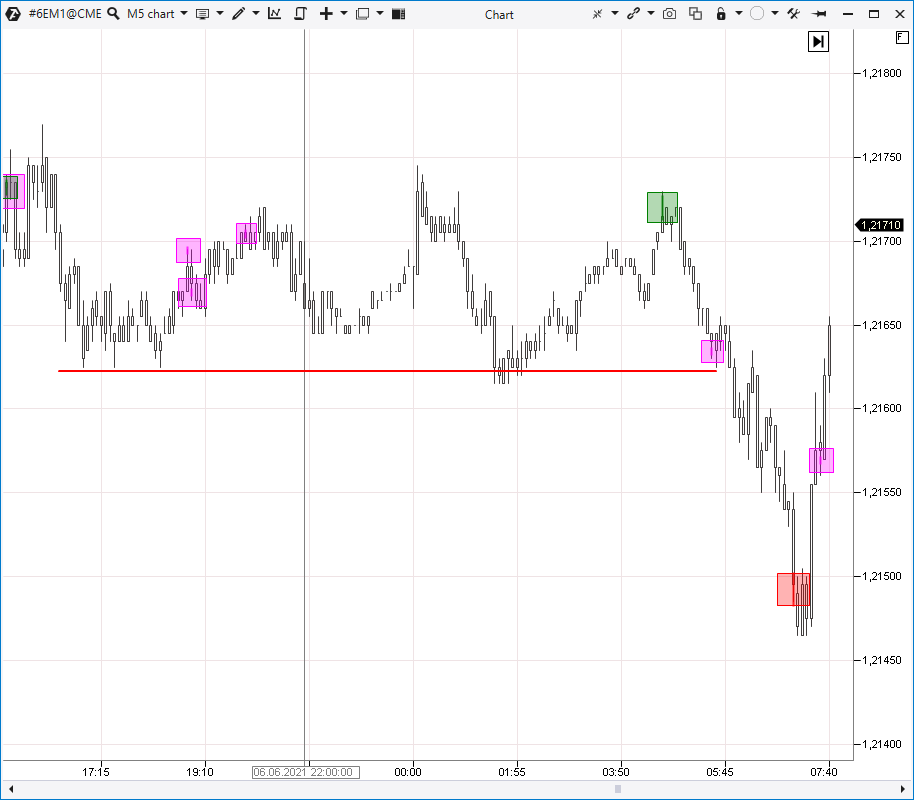
Either catch is of interest, so it is wrong to say that one indicator is better than the other. They are just different. Let’s consider an example to see the difference better. Below is a 5-minute Euro futures chart – the data is from the Chicago Mercantile Exchange (CME).
We added to the chart:
- Big Trades with default settings;
- Cluster Search with one parameter changed (Minimum Value = 300).
We applied a display with transparent candles to see indicators better. Cluster Search signals are marked with pink squares (5 signals).
Big Trades was triggered 4 times. By default, the Auto mode is activated in the Big Trades indicator. Besides, the algorithm estimates intensity of trading in a specific market independently. In our example, 2 green squares of the Big Trades indicator show big buys, while 2 red ones – big sells.
Let’s consider four examples when the Cluster Search and Big Trades indicators were triggered. They are marked with numbers in the chart.
Example 1. Big Trades big buy
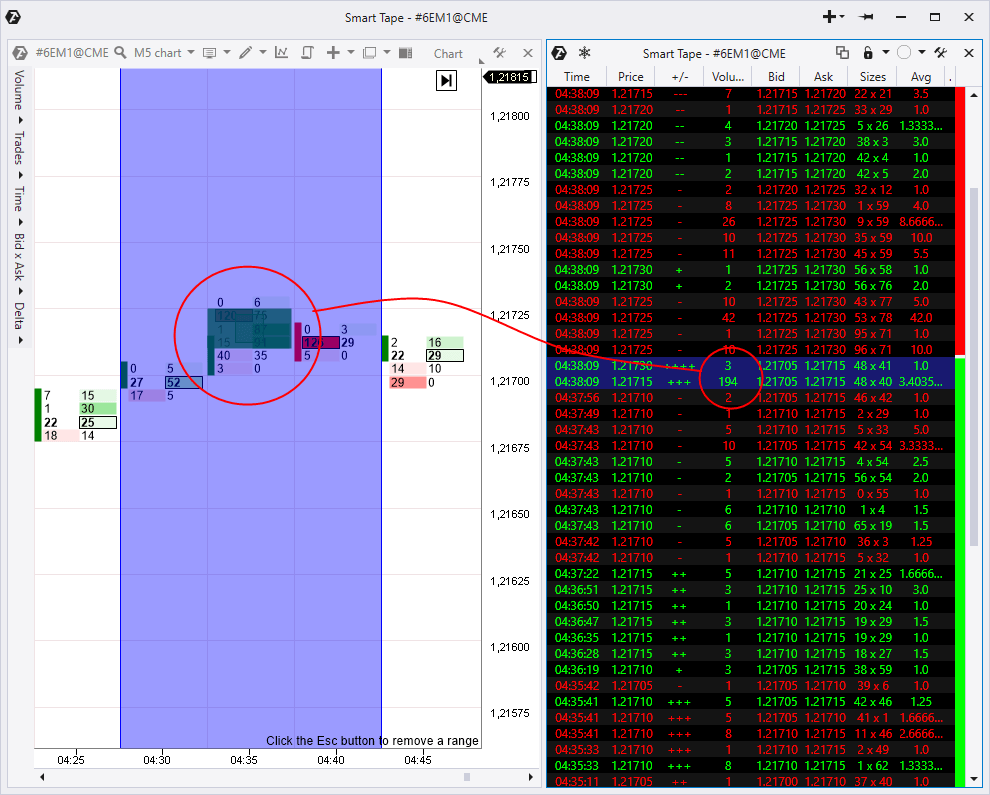
In order to see more details, we:
- switched the chart to the cluster mode (what a cluster chart is);
- we added the Smart Tape in the History mode to the right – this mode allows studying the trade flow for a selected section in the chart (what Smart Tape is and how to set it up).
If we compare the Big Trades indicator signal in a cluster chart with the Smart Tape data, we will see that a big trade for buying 194 contracts with a market order was registered at 04:38:09. Namely this trade activated the Big Trades indicator.
Besides, Cluster Search ‘kept silent’, because the indicator triggering criterion (Minimum Value = 300) wasn`t met.
How can the Big Trades signal be interpreted? Let’s assume that a protective stop loss (what a stop loss order is) of a major market player was posted a bit higher than the round level of 1,217. Perhaps, the selling position of another major player was formed due to this trade. Let’s note that sellers became active on the very next bar at 04:40 and the price started its down movement, which lasted for nearly 2.5 hours.
Example 2. Cluster Search indicator signal
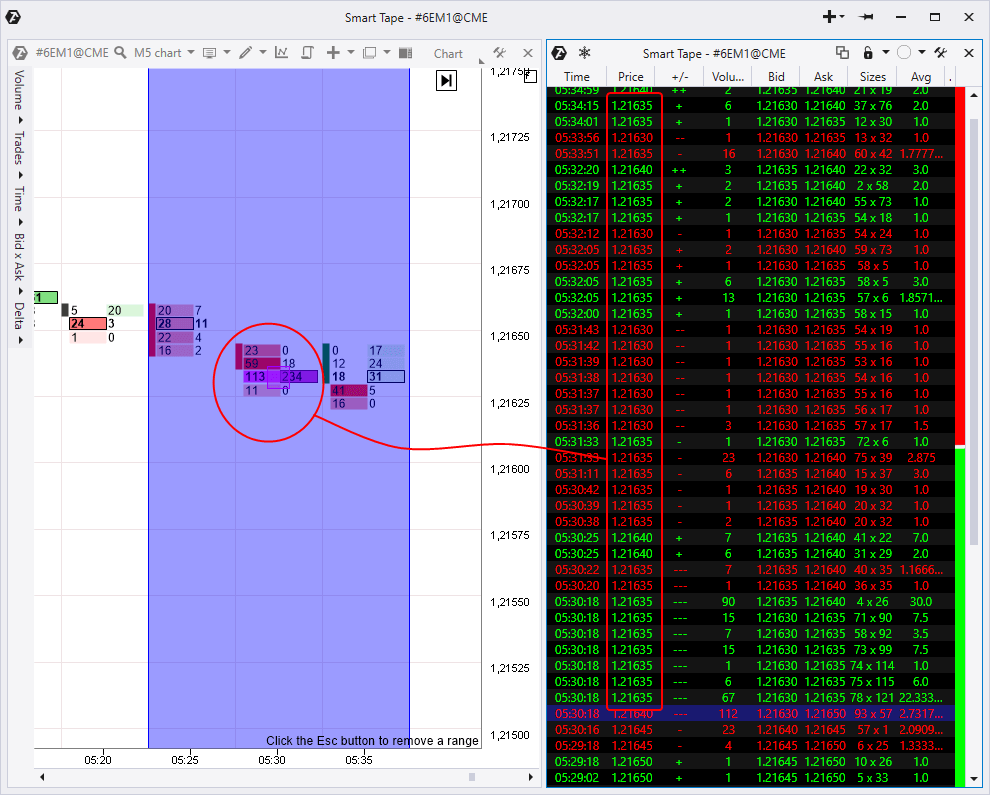
Again we use the cluster and tape combination to see details.
Let’s compare the Cluster Search indicator signal and Smart Tape and we will see that there were several buy and sell trades at the price of 1,21635 on the bar at 05:30. In the result, the total amount of Bid and Ask trades (what Bid and Ask are) exceeded Minimum Value = 300, which led to the indicator activation. Let’s note that the calculation mode in the Cluster Search indicator is set in the Volume position. The signal wouldn’t have been received if Bids and Asks were set separately there.
The Big Trades indicator ‘kept silent’ because there wasn’t even one very big trade among all the trades. The Auto Filter algorithm of automatic assessment calculated that a trade with 122 contracts and more will be such a trade.
How to interpret activity at the level of 1,21635? Having changed the scale, we will see that this level (marked with a red line in the chart below) acted for some time as support.
Perhaps, market participants became active when the price approached the level:
- buyers hoped that there would be one more bounce;
- sellers believed that there would be a breakout (they were right).
Activity of the market participants resulted in a big number of trades on the tape, which was the reason for the Cluster Search indicator triggering.
Example 3. Big Trades big buy
After the level of 1,21635 had been broken, the price continued to demonstrate downward dynamics until the Big Trades indicator was triggered.
Let’s consider this event in detail:
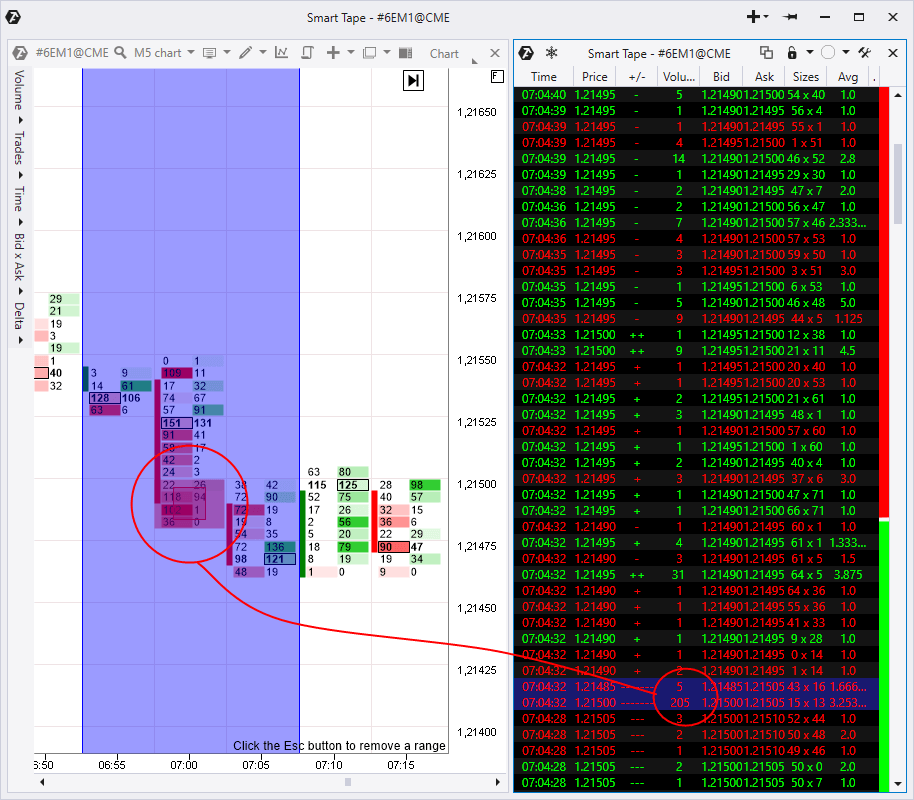
Smart Tape shows that there was a big trade with 205 contracts at the first touch of the round level of 1,21500. Namely this trade triggered the Big Trade indicator.
It is not an accident that a big trade took place exactly at the moment of touching the round level, since more liquidity, as a rule, is concentrated at round levels. You can study this specific feature of financial markets with the TPO and Profile instrument in the ATAS platform.
Example 4. Cluster Search indicator signal
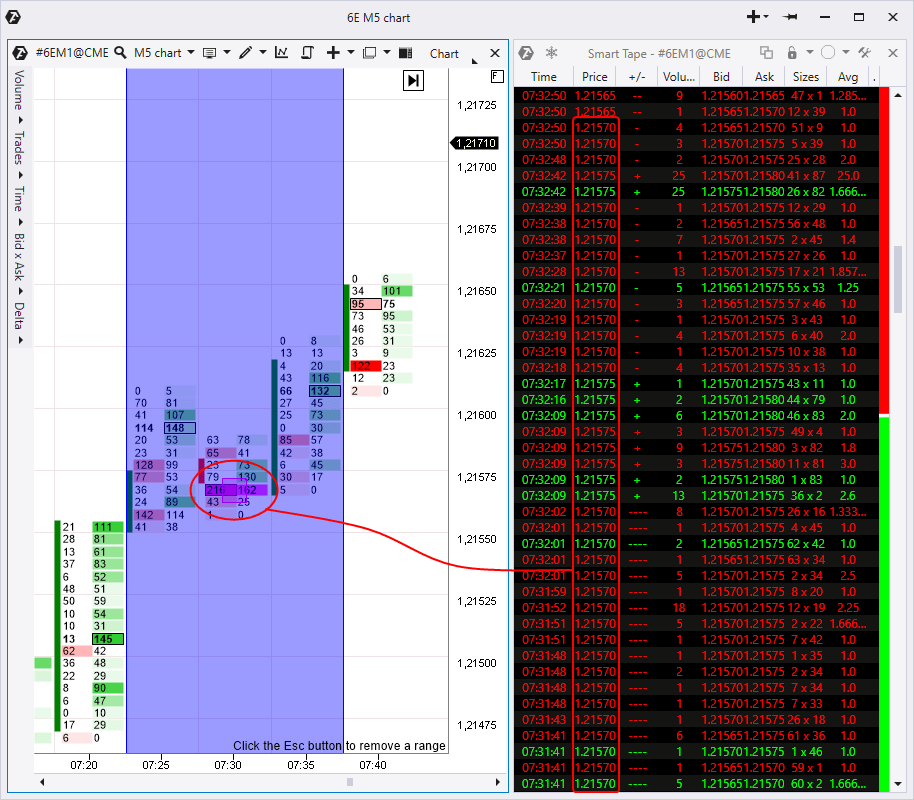
The Cluster Search indicator signal, marked with number 4 in the very first chart of this article, took place on the bar, which opened at 7:30.
The indicator was triggered when a big number of trades were executed at level 1,21570, the total volume of which exceeded Minimum Value = 300, however, there was not a single trade, the volume of which could trigger Big Trades.
How to interpret the relatively high intensity of trading at level 1,21570? As a variant, we may assume that market participants became active after publication of news or closing of a 30-minute candle or one of the European trading platforms started to work. By the way, we have a useful article about trading at the session opening.
So, we showed you in detail 2 signals of both Cluster Search and Big Trades indicators, so that you could understand the difference between them. We hope that you got the idea and there is no need to show details for the other signals, which appeared in the first chart.
Additional differences
We considered the main difference between the Big Trades and Cluster Search indicators, which help traders to identify moments when there is active trading in the market.
The main difference is in the criteria, by which these instruments assess activity:
- Big Trades tracks individual big volume trades;
- Cluster Search shows clusters (single or neighbouring) with a series of trades, which produce a big volume in total.
Moreover, there are additional differences in the indicator settings. In brief, Big Trades is a more simple indicator. Cluster Search has more complex settings since it is more flexible and versatile.
We will show you these differences in the table:
| Big Trades | Cluster Search | |
| Possibility of automatic set-up | Yes | No |
| Calculation Mode | Cumulative, Separated | Volume, Bid, Ask, Delta, Tick, Time |
| Alerts | Yes | Yes |
| Time filter | Yes | Yes |
| Bar direction filter | No | Yes |
| Delta, imbalance and location filter | No | Yes |
It turns out that Cluster Search has additional filters, which provide a more accurate search. In fact, Big Trades doesn’t need them. However, it shouldn’t go unspoken for the purpose of this article, which compares these two instruments, that Cluster Search has more settings and, that is why, could be applied more often. The main thing is to know exactly what kind of a cluster you want to find.
We also recommend you the next relevant articles from our blog:
- 6 settings of the Cluster Search indicator, from which not a single volume would escape
- Cluster analysis with the Cluster Search indicator
- 4 useful tricks of the Big Trades indicator
- Trading by levels with the Big Trades indicator
- Advantages of the ATAS platform indicators
Conclusions
Download the ATAS platform and find out which of its indicators will be most useful for your trading style. Experiment with the Cluster Search and Big Trades indicators in the markets of your choice. Share this article with those who look for really useful trading instruments.
Information in this article cannot be perceived as a call for investing or buying/selling of any asset on the exchange. All situations, discussed in the article, are provided with the purpose of getting acquainted with the functionality and advantages of the ATAS platform.

