How to use the Open Interest
We already wrote in this article about what the Open Interest (OI) is and where and how it is formed. If you read that article, you know that the Open Interest is formed only in the forward markets (futures and options). Today we will continue to discuss the Open Interest.
In this article we will:
- see how the Open Interest reflects moods of the market participants;
- explain where to get the data by positions of various trader groups;
- learn how to use the Open Interest for the exchange trading;
- show OI regularities, which improve the market situation understanding, on specific examples.
Open interest on the Moscow Exchange
Each forward contract (whether a futures or option) has a circulation period and an expiration date. The exchange works in such a way so that several futures or option contracts with different expiration dates are traded simultaneously. However, the most liquid contract is the one with the closest expiration date.
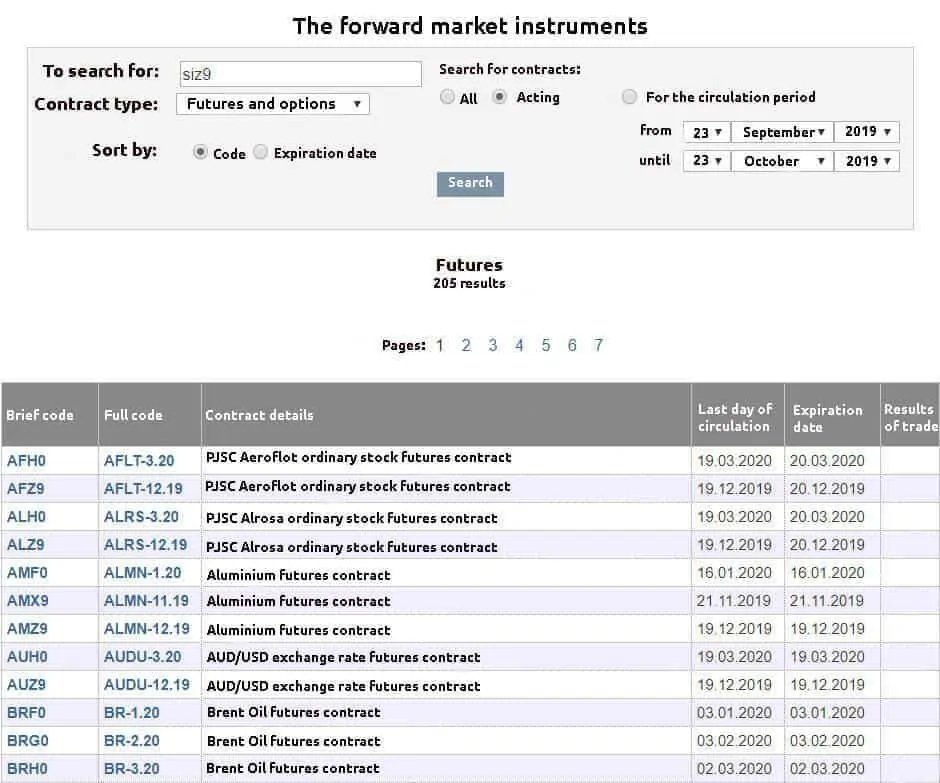
Let’s consider it on the Moscow Exchange example. Please, go to the Instruments of the forward market page to find information about open positions.
Traders have access to all instruments of the forward market here. Any specific instrument could be found by inserting an instrument code in the search field:
Filter out all necessary instruments and go to the instrument parameters, where the Open Interest data are available.
The picture below shows the Open Interest data by Si futures contracts in circulation:
The last column (Open positions) specifies the total number of mutually open positions of all participants. Contracts are placed in ascending order, that is the first contract has the closest expiration date and the last contract has the farthest expiration date. The contract with the closest expiration date has the biggest Open Interest value – 2,332,932. This number means that, at the current moment, 1,166,466 contracts are in the long positions and the same number of contracts are in the short positions. The Si-9.21 contract has the smallest value since it has the farthest expiration date.
How the Open Interest is formed?
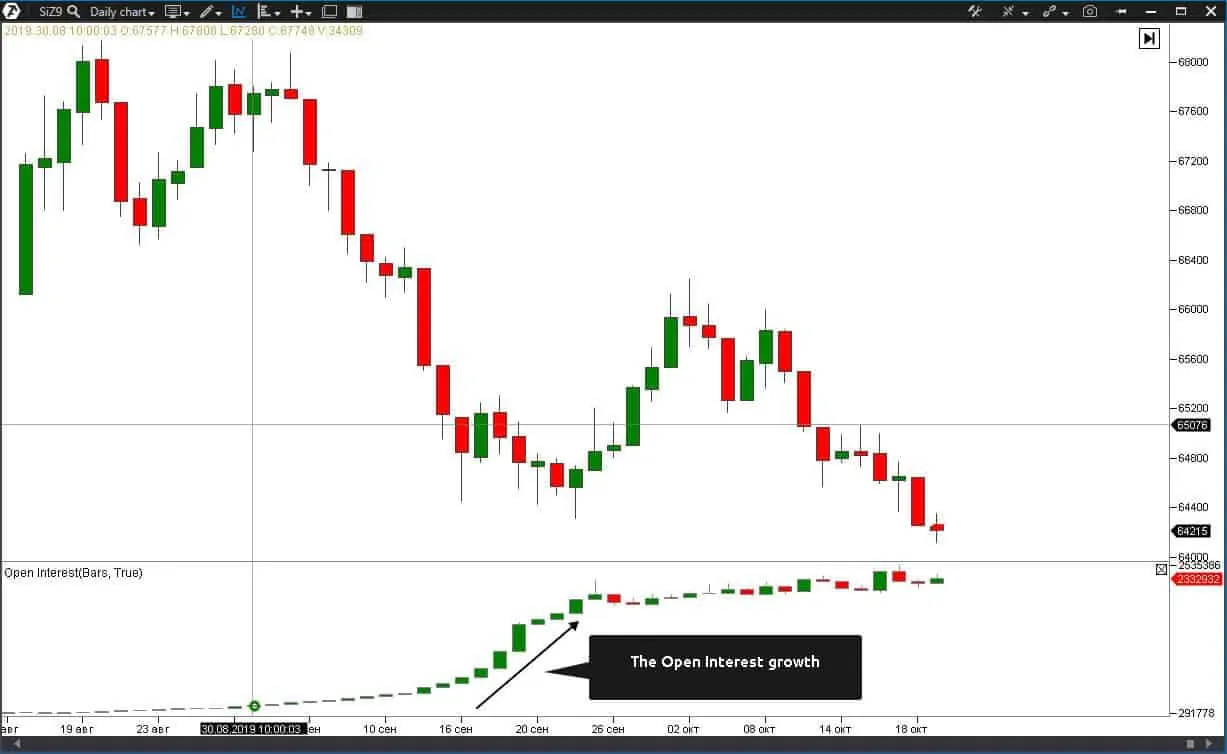
Let’s analyze the chart below and see how the Open Interest is formed through the example of the contract with the biggest number of open positions – SiZ9:
You may notice that the sharp growth of the Open Interest starts from the second half of September, approximately from September 16-19. It is connected with the fact that the last circulation date of the previous SiU9 contract is September 19. Many traders pass to a new contract just several days before the previous contract expires.
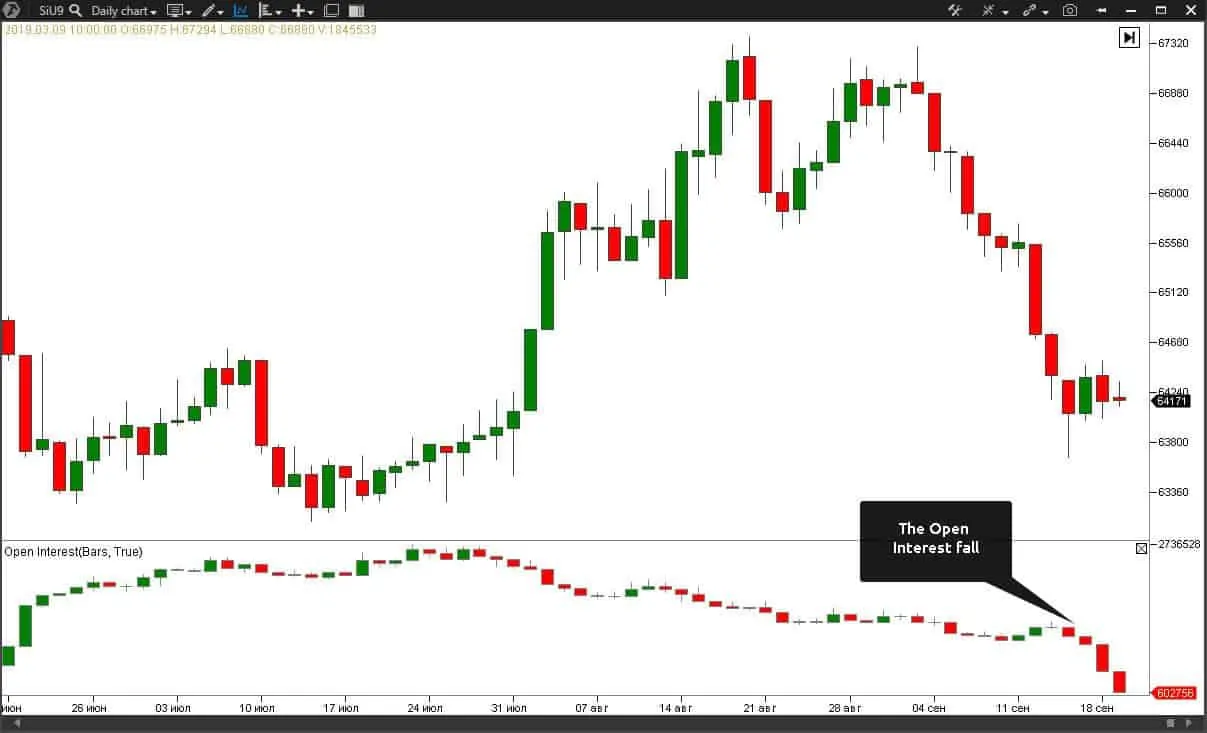
Let’s look at an example of how the Open Interest changed on the previous SiU9 contract:
And here we see that the Open Interest reduces just by September 19.
Thus, the Open Interest changed from the previous contract to the next one. We can draw a conclusion from it that the maximum Open Interest is always formed on the contract, which has the closest expiration date.
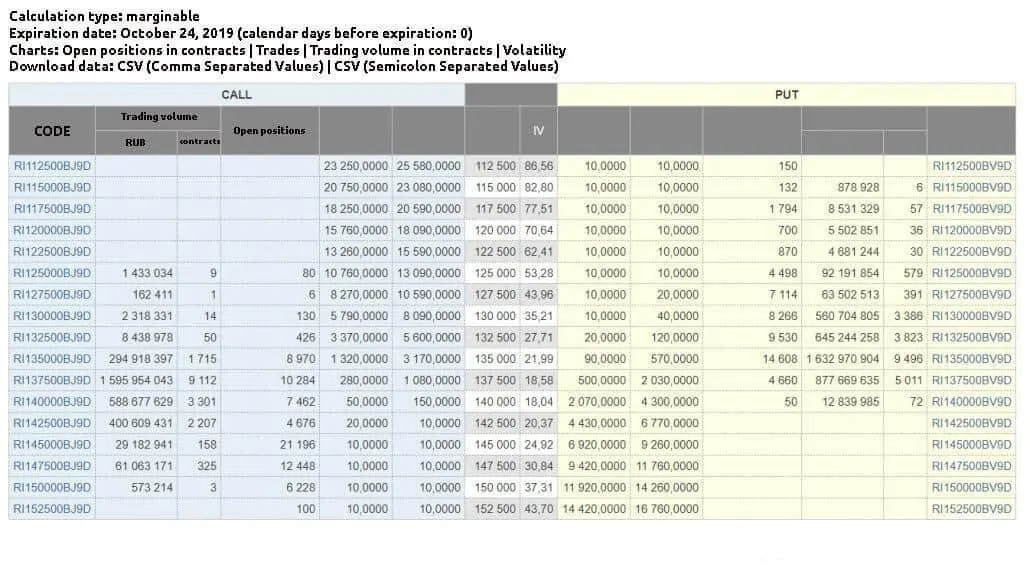
We can study the Open Interest information from the option market of the Moscow Exchange in the same way. To do it, click this link: https://www.moex.com/ru/derivatives/optionsdesk.aspx, select the code of a required instrument and press “Show”. You will get a report about open positions in the following format:
This report shows you how many open positions have been accumulated at each strike by Call and Put options. (You can read more about options in our blog).
Open Interest for CME
The Chicago Mercantile Exchange (CME) has values of open positions of the forward market traders. You can find them on the CME official web-site: www.cmegroup.com.
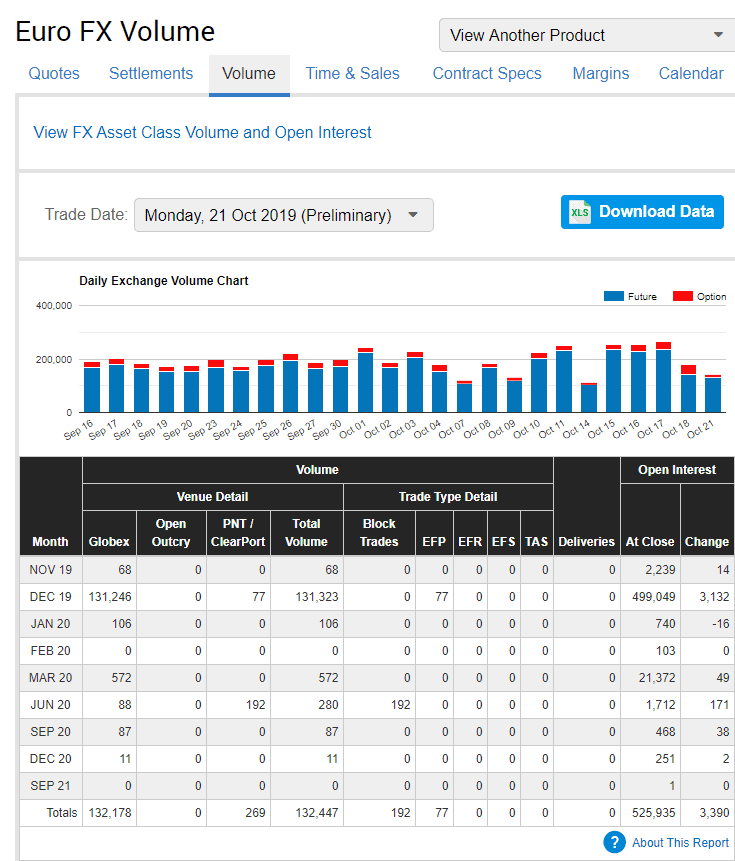
Example of the 6E futures open positions:
The Open Interest section not only helps you to track the current value of the open positions but also to register changes in comparison with the previous trading sessions (the Change column).
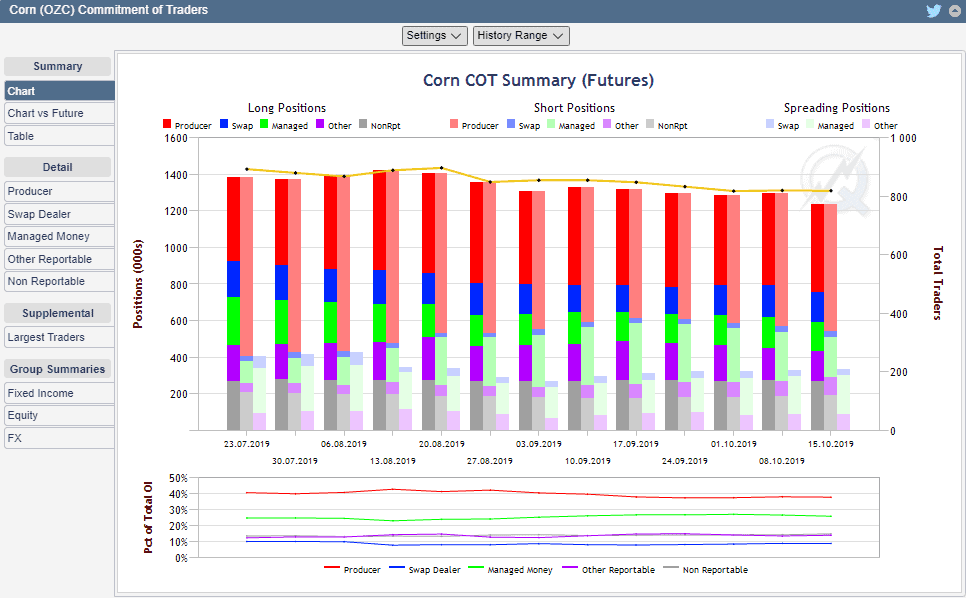
The Chicago Mercantile Exchange publishes not only the general value of the Open Interest but also the Commitment Of Traders (COT) report. This report contains information about the Open Interest of various groups of traders and is published each Friday in the second half of the day on the basis of the positions from the previous Tuesday. This report is published in the form of a diagram for a convenient analysis on the CME web-site and is available here:
The specified report allows to analyze long and short positions of various groups of traders with a relatively small time lag.
The report envisages the following classification of traders:
- producer (producers and suppliers of physical commodities. Usually, they take short positions with the aim to sell their commodities or products);
- swap dealer (dealers and market makers in the swap market);
- managed money (money managers);
- dealer (market makers, banks and swap dealers);
- asset manager (managers of institutional funds);
- leveraged (hedge funds which manage borrowed funds);
- other reportable (the ones that do not fall into any category);
- largest traders (largest traders!).
Open Interest in the oil futures (CL) market
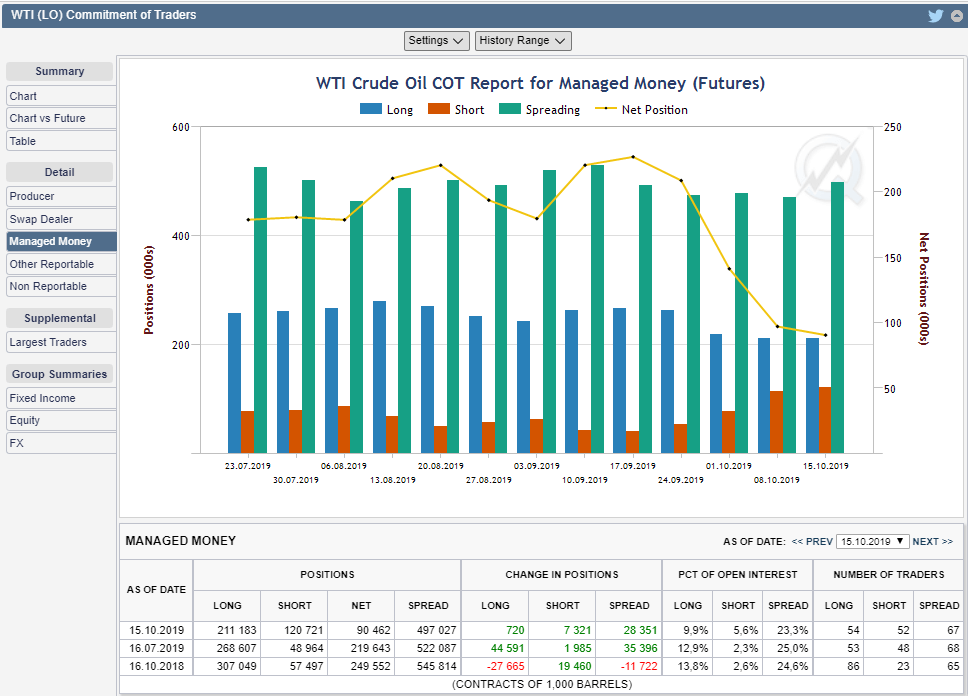
Every futures contract has its specific correlation of the groups of traders. Let’s consider the managed money positions through the example of a crude oil futures (CL):
The above diagram tells us that the managed money had 211,183 open long positions against 120,721 short ones as of October 15, 2019. It points to the fact that the majority of managing investors expect the oil price increase that is why they hold more long positions.
Perhaps, the main disadvantage of this report is that it is published with a delay. However, the market inertia allows to use these reports despite the time lag. Major traders and managing hedge funds accumulate their positions beforehand, that is why if the market has not played the expected event yet, you can be guided by it in your trading.
Where to study the CME data on the option Open Interest?
Use this link to study the CME data on the Open Interest from the option market and select the report type out of the presented variants.
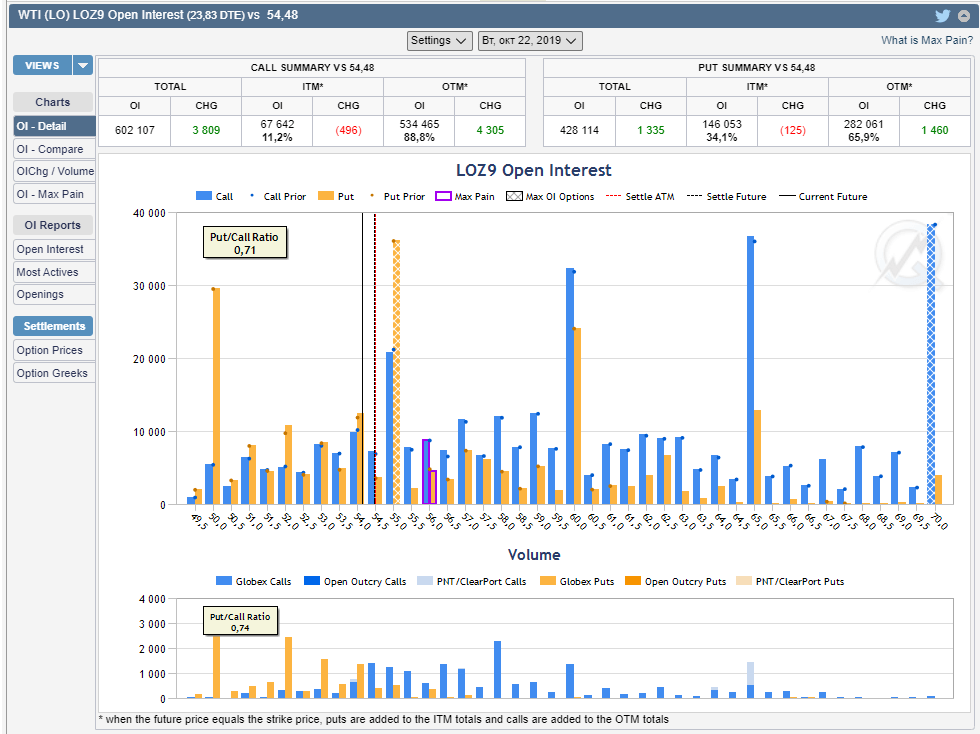
We will consider now how the Open Interest on oil options is formed. We’ll do it through the example of the OI&Settle Detail report.
The volume bar chart in the picture below shows us on what strikes and in what volume the LOZ9 contract Open Interest is present.
We can take into account strikes with maximum volumes from the above report and calculate support and resistance levels with consideration of the premium paid for options – however, this is a topic for an individual article. Our goal today is to show you where and how to analyze the Open Interest.
Specific features of publication of the Open Interest data on CME doesn’t allow to analyze the change of the Open Interest during a day. Tracking the Open Interest in real time is not a problem from a technical point of view. It has already been implemented on the Moscow Exchange and works perfectly. We may only assume that the exchanges deliberately do not provide these data since they are of high value and allow to track behaviour of major market participants and notice places of accumulation and discharge of positions.
How to use the Open Interest?
Unlike CME, the Open Interest data on the Moscow Exchange are available in the tick mode. In other words, the data of each trade contain information about the change of the Open Interest and any trade, which is transmitted in the data feed, shows us not only direction and volume but also the Open Interest value.
Thus, we can see each trade and its influence on the Open Interest. Having these data at your disposal, you can track the price areas where the exchange participants open or close their positions.
At first sight it might seem that these data are sufficient for identification of the price movement direction. However, it is much more complex in reality.
Setting the Open Interest indicator
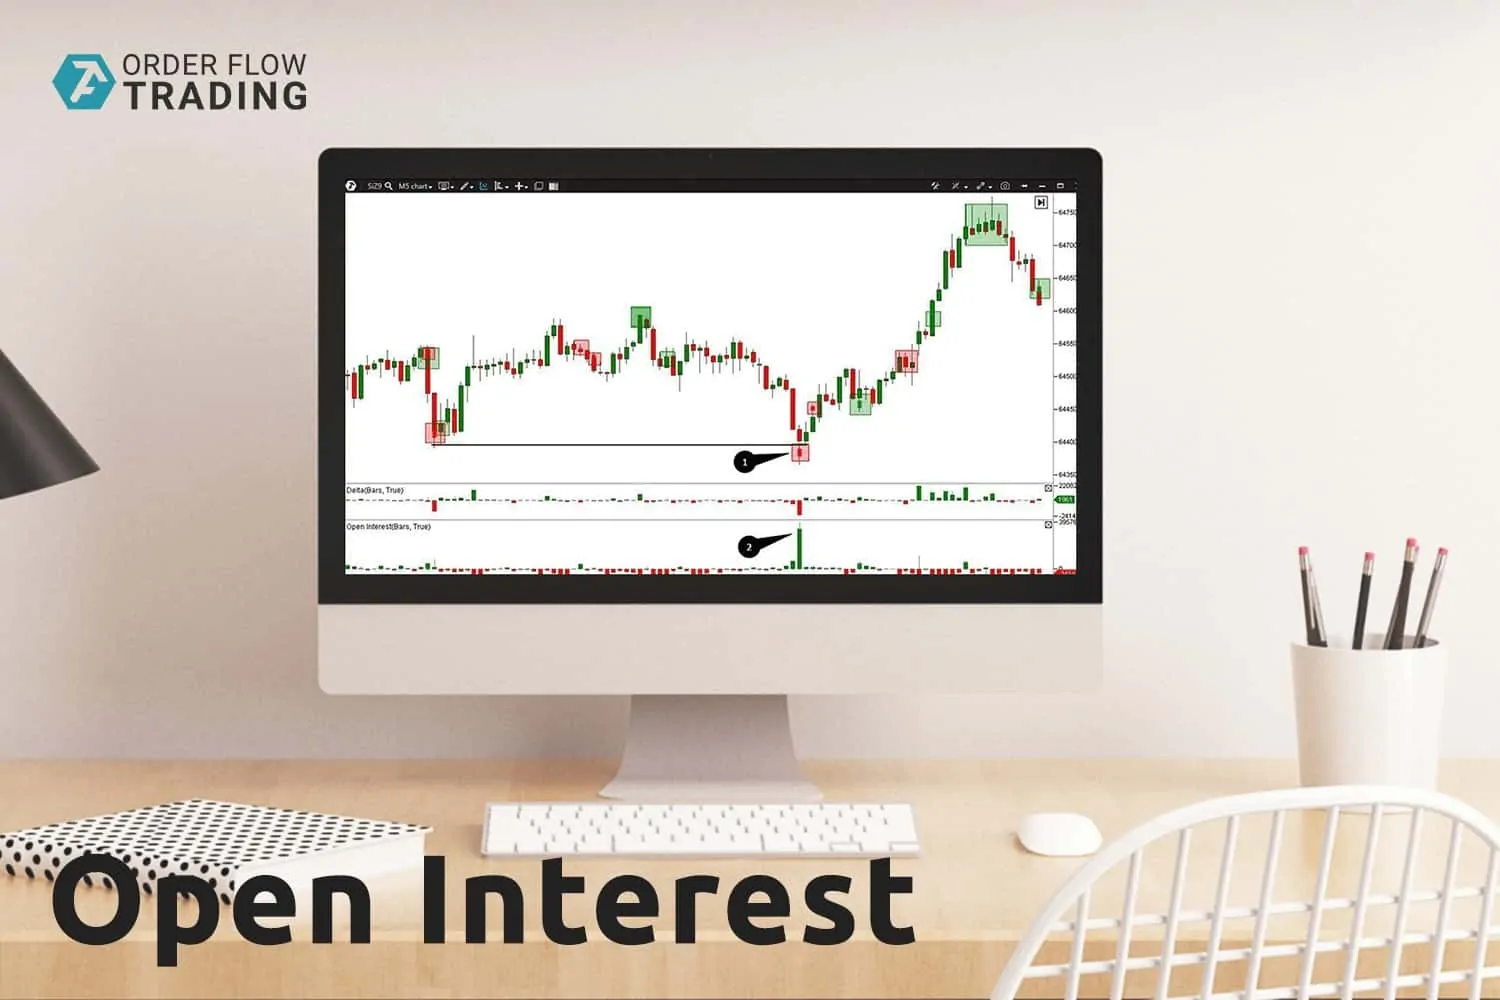
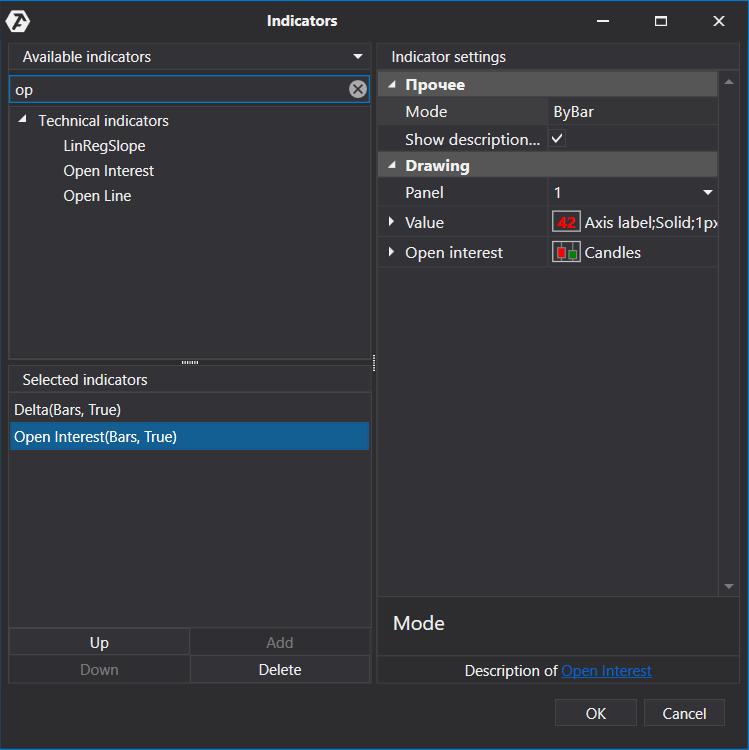
Let’s see how the ATAS platform Open Interest indicator allows to track major accumulations during a day. To do it, we would set a couple of additional indicators in the SiZ9 forward contract chart: Delta and Open Interest. Set the bar mode in the Open Interest settings (as in the picture below) and leave the default settings of the Delta indicator.
The bar mode of the Open Interest allows us to abstract from the general picture and study changes of the Open Interest for each bar. If a bar has just started to be built, the OI will be equal to zero and it will be positive or negative at the moment of the bar closure, which means either increase or decrease of OI.
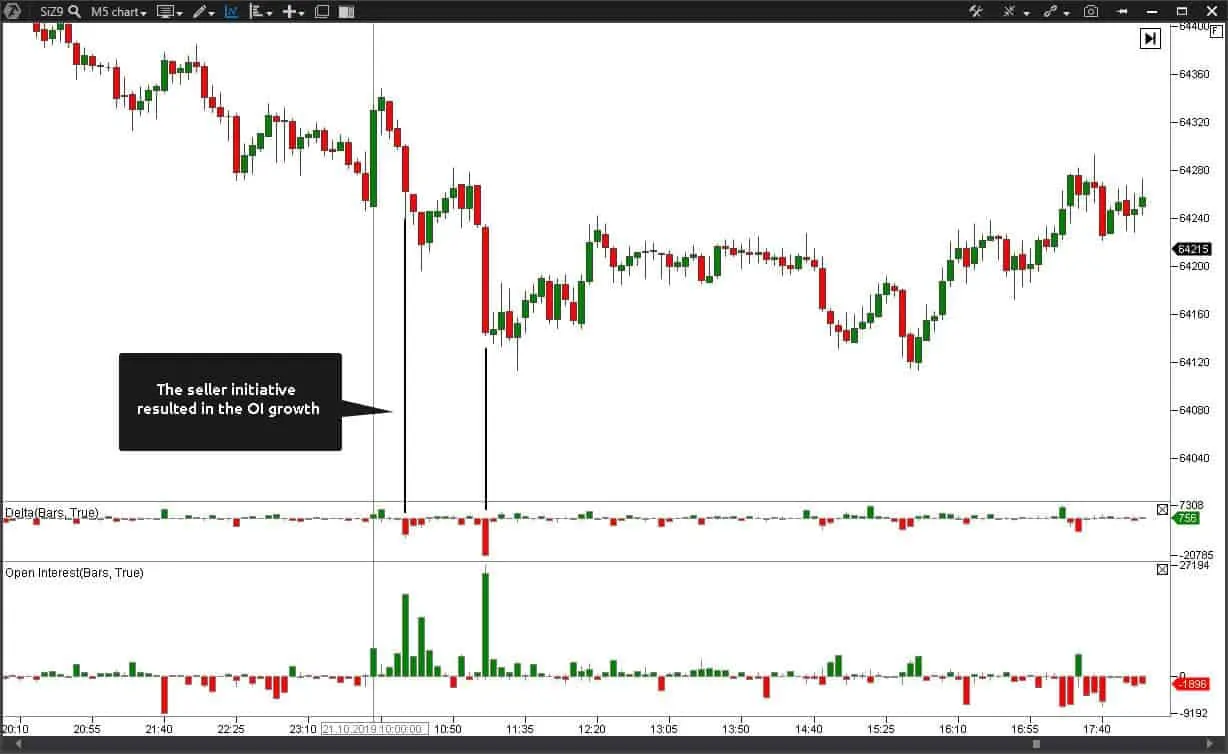
We need the Delta indicator in order to track the buyer or seller initiative in important areas. We noted in the below example that some bars show initiative sellers (it is seen by the Delta indicator) and their trades resulted in the Open Interest growth.
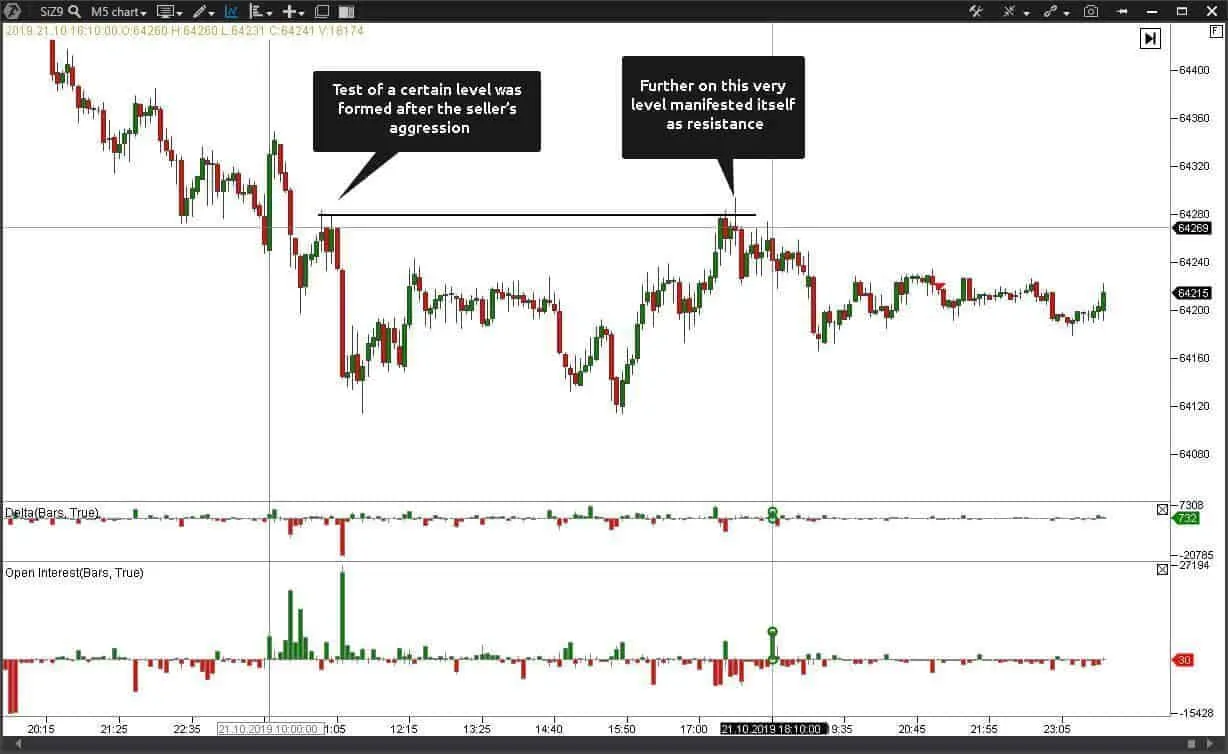
Such a situation tells us that both sides accumulate their positions, but an aggressive seller serves as a trade initiator. We recommend you to always pay attention to the emergence of such situations and note afterwards in what direction the price moves from the consolidation area (position set). A situation itself in which a seller is an aggressor doesn’t mean that the price will definitely go down. It is recommended to wait for emergence of the levels, which would explicitly point to the price holding and would help to make a decision.
In our case, the price tested a certain level, which later served as the resistance level, after the first aggression of the seller. It is preferable for these levels to be formed in the area where the movement initiator ‘played the master’. This way we will see whether the initiator holds his positions or not.
Analysis of the volume and Open Interest
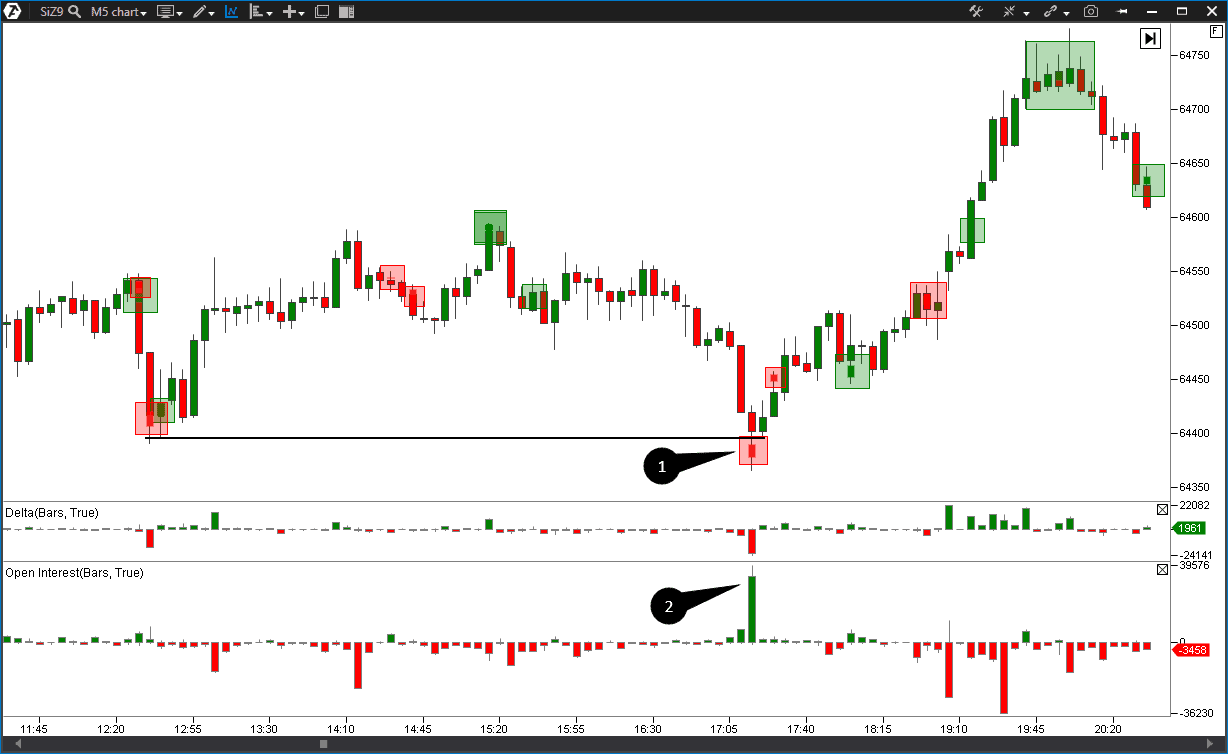
Let’s consider one more method of the Open Interest usage, which allows to identify who hunts and whom he hunts. To do it, we add the Big Trades indicator to our chart, which would register appearance of major buys or sells.
The price breaks the support level in point 1 and we register appearance of a seller’s major trade who, probably, opened his position towards continuation of the breakout.
The indicator showed the Open Interest growth in point 2 and the price moved back above the broken level. In this situation, the seller found himself in a trap. The higher the price moves up, the bigger the loss he makes. It is not difficult to assume that there will be a moment when the seller closes his loss.
As the Si instrument observations show, the ‘entrapped’ position Open Interest disengages itself approximately in the same volume approximately in 200 ticks.
We assume that this dependency is connected with the fact that the market participants use margin leverage of 1:25, which, with consideration of the collateral guarantee of this instrument, exactly corresponds with 175-200 ticks it is able to withstand.
Thus, we can see that a significant number of sellers were entrapped at the false breakout of the level. We understand that we have approximately 200 ticks which the price can pass against this position. This allows us to open a position on the side of strong market participants.
In the event the price breaks the level and stays below it – this would tell us that no one hunts the seller and, most probably, he knows what he is doing. In such an event it is expedient to open positions towards the breakout on a retest of the broken level.
How to detect OTC trades?
The participants of the Moscow Exchange forward market have a possibility to execute OTC (Over The Counter) trades. Such trades do not pass through the market and are executed aside from the general trades at the price agreed upon between the participants, that is why it is practically impossible to track such trades. As a rule, the volume of such trades is significantly bigger than the average volume of exchange trades. We assume that if someone executes an OTC trade, it means that this someone wants to hide it.
How to track such a trade? Two indicators – Volume and Open Interest – will help us to do it.
The matter is that if an OTC trade resulted in opening mutual obligations, it will be taken into account in the Open Interest. The practice shows that appearance of major OTC trades is the beginning of some movement of the instrument and the points of appearance of such trades serve as support or resistance levels. Appearance of OTC trades are most frequent on an Ri futures from the Moscow Exchange.
The example below shows how to find an OTC trade in the chart.
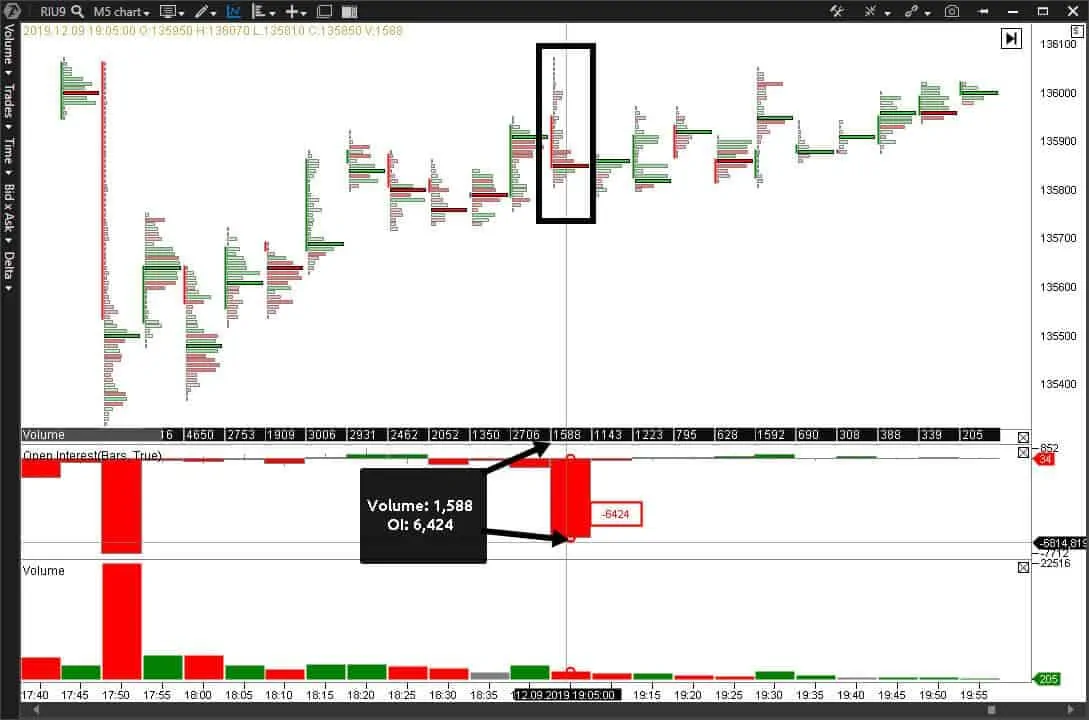
We marked the area in the chart below where we noticed the Open Interest change by 6,424 contracts, while the general traded volume in the candle corresponds with 1,588 contracts.
It is obvious that the Open Interest cannot change in more than the volume multiplied by 2 times. However, we see in this case that the Open Interest is more than the volume in 4 times. It tells us that there was an OTC trade during this time interval which decreased the Open Interest.
We want to draw your attention to the fact that those OTC trades, which resulted in the Open Interest increase, will be more important.
Summary
- First, the Open Interest helps to understand what different market participants expect. For example, foreign hedge funds carry out a thorough analysis when they select instruments for trading. If you open positions towards the managed money, you make it easier for yourself since you rely on the opinions of experts in this sphere.
- Second, the Open Interest allows to build your intraday strategy on the basis of the levels where big accumulations take place.
- Third, when analyzing the Open Interest from the option market, we get additional information about the levels, which can serve as support and resistance, where maximum volumes were accumulated.

