ATAS always tries to improve in order to provide the maximum of convenient and useful instruments for analysis and trading. An important and useful indicator – Market Profile – has been updated recently in the platform functionality. This article is a review of capabilities of the Market Profile in the form it has been available in the recent ATAS versions.
Read in the article:
- the Volume Profile indicator, installation and setting;
- what TPO is and its relation to the market profile;
- how to analyze the profile;
- examples from different markets.
However, before we go to the article content, let’s answer one important clarifying question – what is the difference between the Market Profile and Volume Profile?
The market profile and volume profile are very close concepts. They are often equated, but, in fact, there is a subtle difference between them.
In principle, the profile in analytics of the financial charts is a characteristic of actions by price levels. The profile assumes building a bar chart along the vertical axis of the chart where each bar would present information for analysis. What type of information? That’s where this subtle difference lies.
We speak about the volume profile if we analyze the volume of trades at a certain price level (levels) for a selected period of time. In other cases, for example, when analyzing the delta, application of the volume profile term is incorrect.
In other words, the market profile is a wider concept in analysis. The volume profile is a special (but the most widespread) case of the market profile. It will become clearer when you read the article. Do you have other ideas? Share them in the comments.
How to install the Market Profile indicator?
In order to install the Volume Profile indicator in the environment of the trading and analytical ATAS platform, follow the next procedure:
- open the chart (pressing the Chart icon in the main window of the platform);
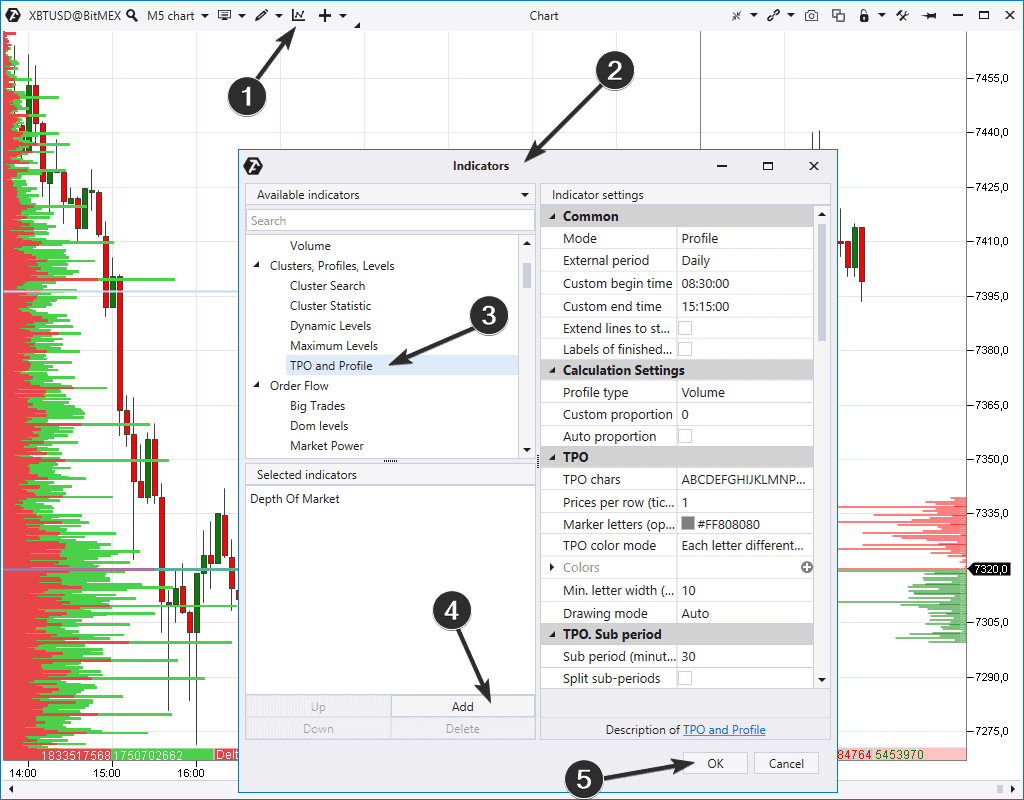
- open the indicator manager. To do it, click the icon (1) or press Ctrl+I;
- the indicator manager window (2) opens. Find there TPO and Profile (3) in the Clusters, Profiles, Levels section;
- press Add to add indicator to the chart (4);
- close the indicator manager pressing OK (5).
We would like to note that you may install several TPO and Profile indicators in one chart with different settings. We will speak a bit later about how to set the Market Profile indicator.
How to set the Market Profile and TPO?
In the picture below we also added the Profile and TPO indicator to the chart (1). It appears in the form of a violet vertical bar chart in the event of default settings.
We will briefly mention the basic settings only, since there are very many of them. In order to describe the material as fully as possible, we will refer to the respective articles from our blog.
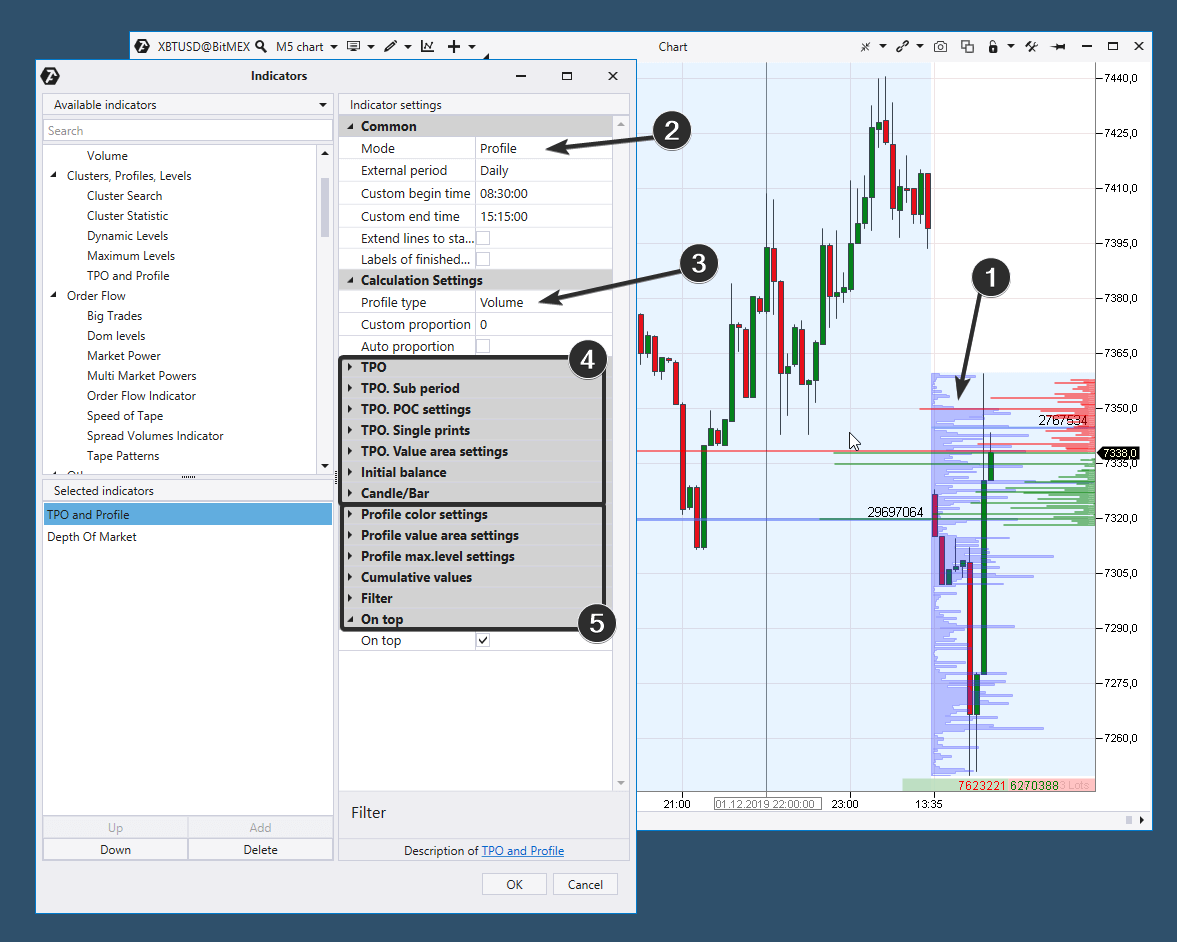
The first and most important one is the setting of the indicator mode. We marked this setting with number 2. There could be four modes:
- Profile – the indicator outputs to the chart the Market Profile only;
- TPO – only TPO is output to the chart;
- Profile and TPO – both Profile and TPO are output to the chart (separately);
- Profile over TPO – both Profile and TPO are output to the chart (together). The Profile is shown over TPO.
Number 3 marks the setting where you can select the profile type. It shows what information about trades should be used by the indicator as the data for building the profile. The following variants are available:
- trading volumes (the first and most popular variant);
- number of trades (the tick volume in the MT4 terminology);
- time ‘spent’ by the price at each level;
- deltas;
- bid x ask (what bid and ask are).
Number 4 marks the block of settings for TPO (we will explain below what TPO is).
Number 5 marks the block of settings for the Profile.
Each of the settings is described in detail in the reference material about the Market Profile indicator. You can also find videos there.
What is TPO and what relation it has to the Market Profile?
TPO is Time, Price and Opportunity. This is how this indicator was named by its developer Peter Steidlmayer. He applied TPO mostly to stock markets.
In order to build TPO in the chart using the original method of Peter Steidlmayer, you should:
- mark the whole range of prices, within which the instrument traded during the first 30 minutes period after the session opening with ‘A’ letters. You will have a column of ‘A’ letters;
- use ‘B’ letters to mark the range of the second 30 minutes period;
- continue doing the same in alphabetical order.
As an example, we built TPO in the linear chart of the Sberbank stock price with the 10m period.
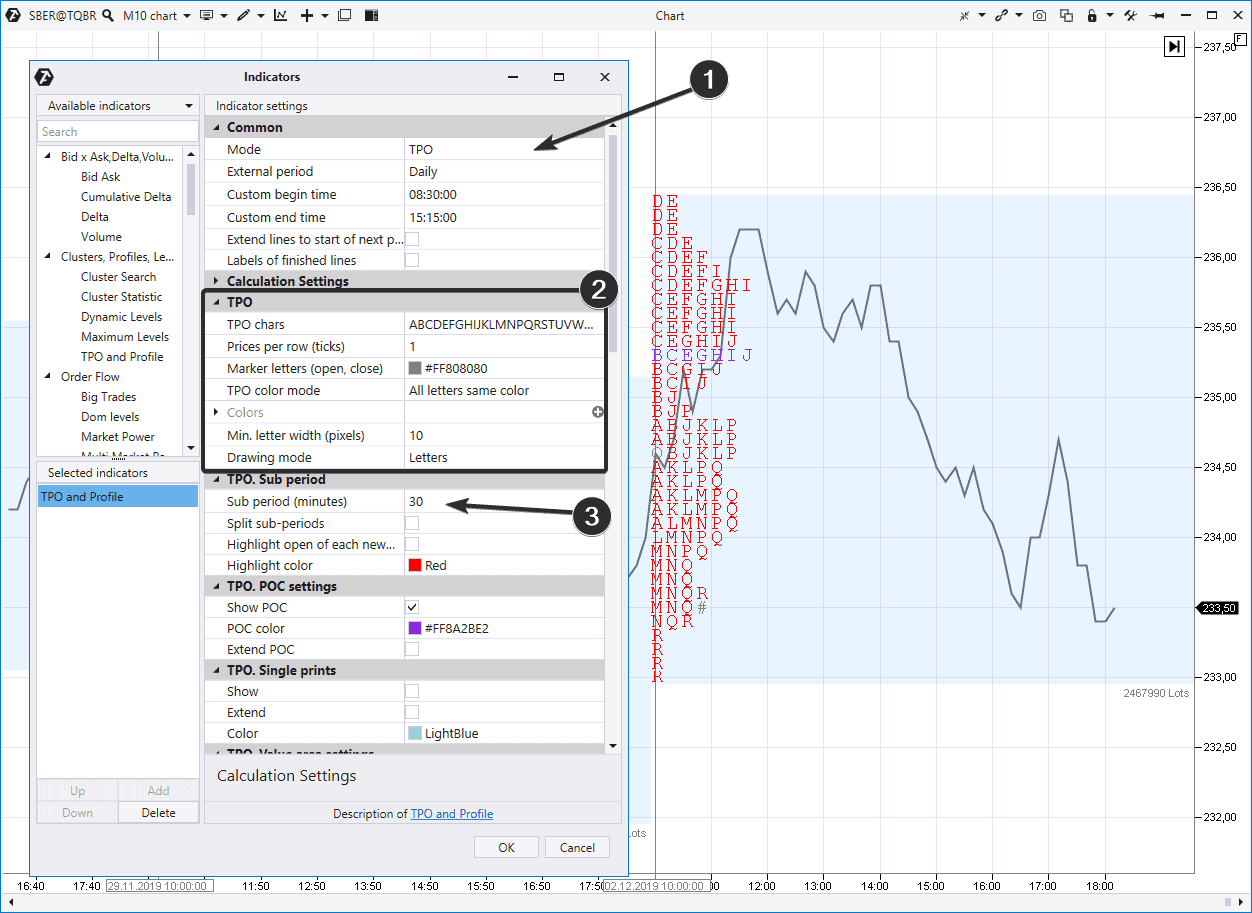
Note the indicator settings:
- we selected the TPO mode with the 1 day period;
- the TPO block identifies settings with which TPO would be visualized in the chart. We have a setting of colouring the letters with the red colour only (the maximum POC (Point Of Control) level is marked violet);
- The TPO sub-period. It determines how often a new letter appears. In our case it is 30 minutes. It’s classic.
Read a more detailed material on TPO in the special article – TPO charts – how to trade. We’ll just note that TPO could be considered as the ancestor of the modern profiles.
Many years have passed since Steidlmayer built from letters the first profiles in the world. Computing capacities of computers have grown significantly and even a regular desktop is able to build different variations of the Volume Profile if it has a detailed history of the course of trading.
What should be selected for trading – classical TPO or progressive profiles? Every trader will make his own selection in accordance with his preferences. ATAS allows to use Volume Profiles and TPO both simultaneously and separately.
But remember that TPO and Profile are different instruments and this is how it is manifested (for example, let’s take a chart from the gold futures market):
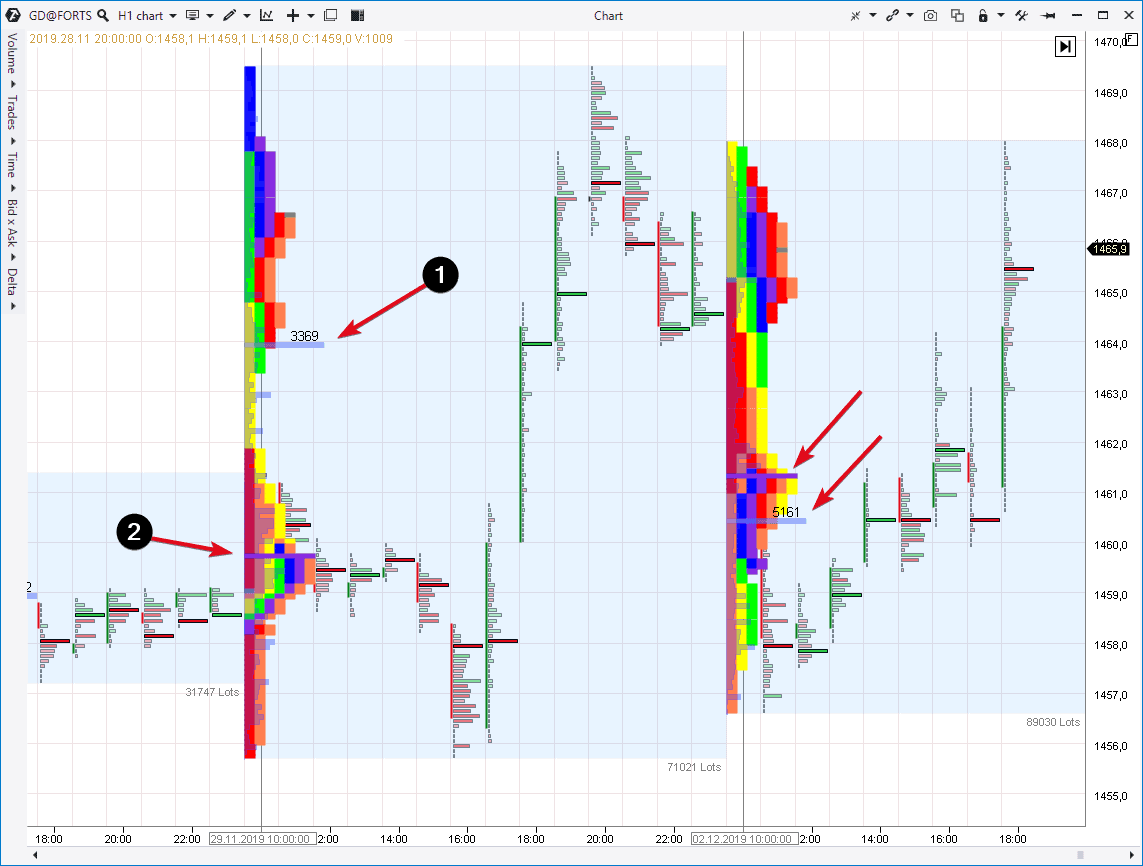
TPO is shown very colourfully in this chart – the indicator used coloured blocks instead of letters. TPO overlaps the Volume Profile one by one. There is a setting which allows to output TPO and Profile beside each other.
- Number 1 marks the maximum POC (Point Of Control) volume on the Profile Volume for one day.
- Number 2 marks the POC level for TPO. This is the level where the market traded more often. But it doesn’t mean that the price, at which the maximum volume of trades were executed, is here.
- Points Of Control also differ the next day, however, not that much.
In other words, if one very big trade takes place in the market, it would significantly change the Volume Profile but would not influence TPO to the same degree.
We will speak further about:
- how the price moves along the Volume Profile;
- how else the Volume Profile indicator could be set;
- how to build strategies.
The Volume Profile indicator in the bitcoin market
In the example below (it is the XBTUSD cryptocurrency market and the data are from the BitMEX) we added to the chart the TPO and Profile indicator with the following settings:
- the indicator mode is ‘profile’;
- the period is ‘1 day’;
- the type is ‘volume’. The indicator uses the data on trading volumes at each price level for building the bar chart.
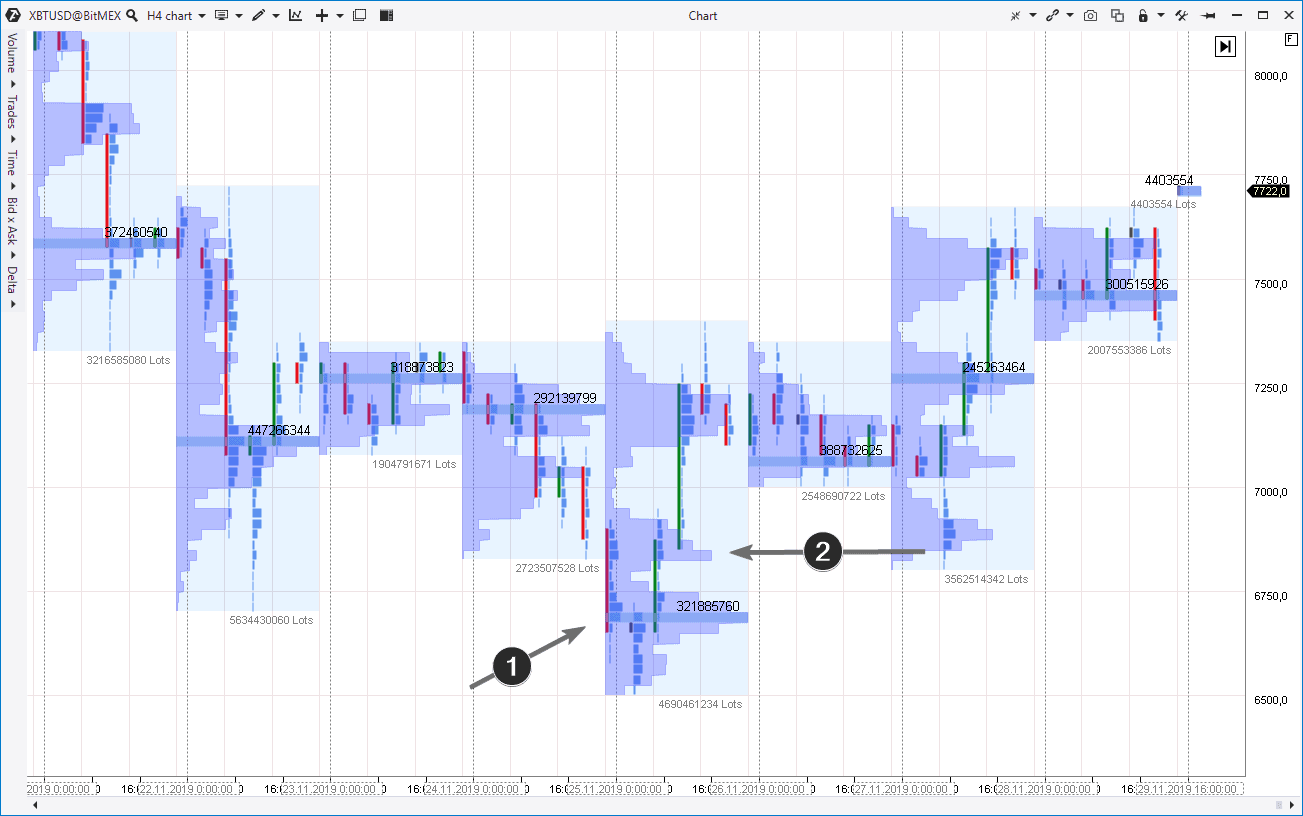
- The active stage of trading was registered at about 6,700 on November 25. The first arrow points to that. However, the next day was traded above 7,000. Such a situation could be interpreted in a way that the coin traders decided that the USD 6,700 is too cheap for one bitcoin (how to make money on cryptocurrencies). That is why, we may expect a bounce in the event of the further return of the price to the specified level. Read the article about the auction theory, if you are interested in this logic.
- The price started to move down to the very same levels on November 27. However, this movement slowed down a bit below the round level of 7,000 (it is better seen on short time periods). This gave an idea that the sellers do not have an aggression to push the price through the area, in which a high volume was registered (marked with arrow 2). Then you could try to enter into a long with a protective stop below the maximum volume level as of November 25.
On the next day, the trades were carried out near the level of 7,500. It:
- confirms the correctness of the taken position;
- gives the ground for moving the stop in the breakeven area.
The Market Profile indicator in the oil futures market
In the next example, we selected the Brent oil futures market using the Moscow Exchange data. We added the TPO and Profile indicator with the following settings to the H4 chart:
- the indicator mode is ‘profile’;
- the period is ‘1 day’;
- the type is ‘delta’. The indicator uses the data on the difference of buys and sells at each price level for building the bar chart.
In other words, we built the Delta Profile and not the Volume Profile. What does it give us?
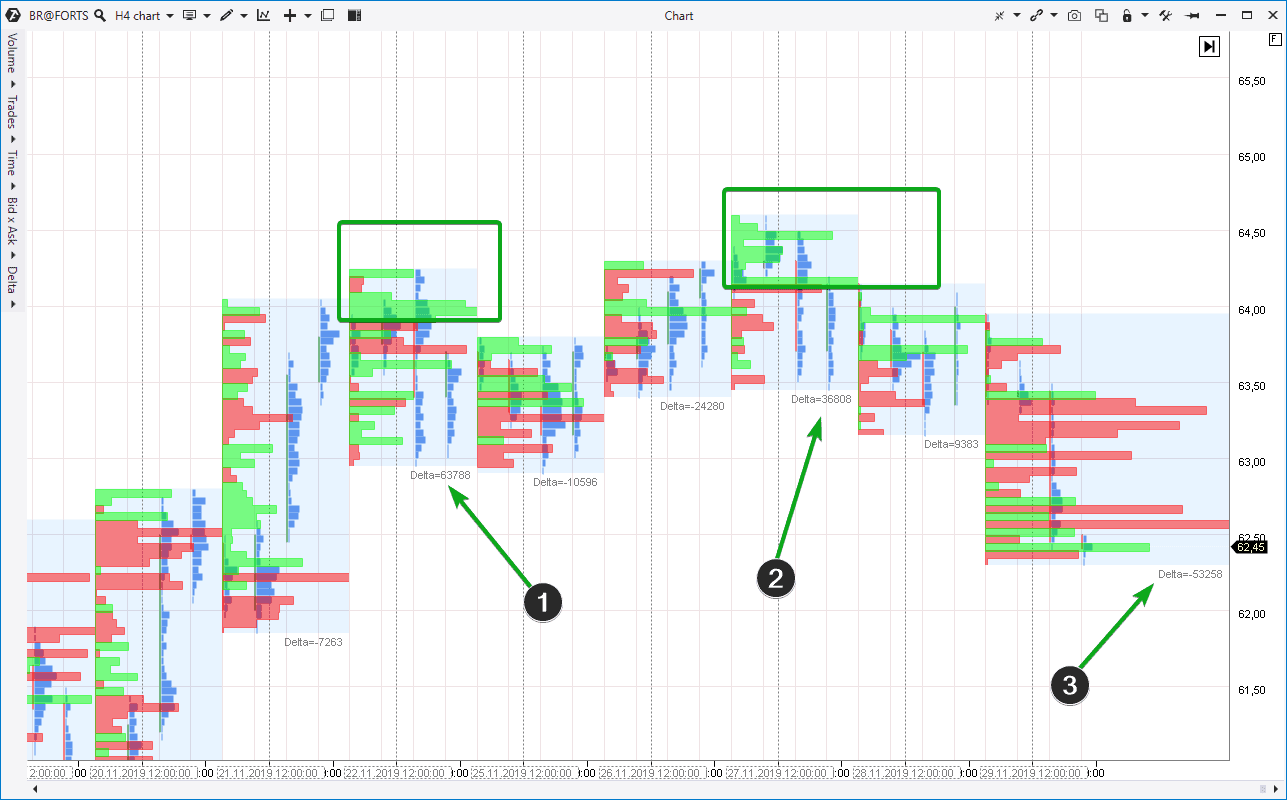
You may notice that numbers 1 and 2 mark the days with the biggest predominance of the positive delta. Buyers dominated. But the Delta Profile provides the grounds for alertness. Why?
Well, have a look at the green squares. They cover the levels with an excessively conspicuous predominance of initiative buyers. And the fact that it took place at the day’s highs alerts us. Further on, the price rolled back far away from the highs. Why doesn’t the price grow despite the buyers aggression? It is a typical behaviour for the price peaks when:
- a lot of buyers enter into long positions through the market buy orders;
- the small quantity of the managed money ‘turns upside-down’ sending a limit sell order to the exchange.
It is quite predictable for those who correctly read this situation in the chart – the market changed its behaviour to the bearish one on day (3) and the price decreased on the growing negative delta.
The Market Profile indicator in the stock market
We selected the stock market in the next example, namely, the Gazprom stock. Traders that work in the stock market know that the closing auction, which takes place immediately after the end of the main trading session, may significantly influence the profile shape. The reason is that a small amount of trades of huge volumes are executed during the closing auction though the price usually doesn’t move.
This happens not only with the GAZP stock but also with many other, including stocks on the NYSE and NASDAQ.
Below are 2 intraday charts. To the left is the TPO and Profile indicator with the following settings:
- the indicator mode is ‘profile’;
- the period is ‘1 day’;
- the type is ‘delta’.
To the left is the TPO and Profile indicator with the following settings:
- the indicator mode is ‘profile’;
- the period is ‘1 day’;
- the type is ‘trades’.
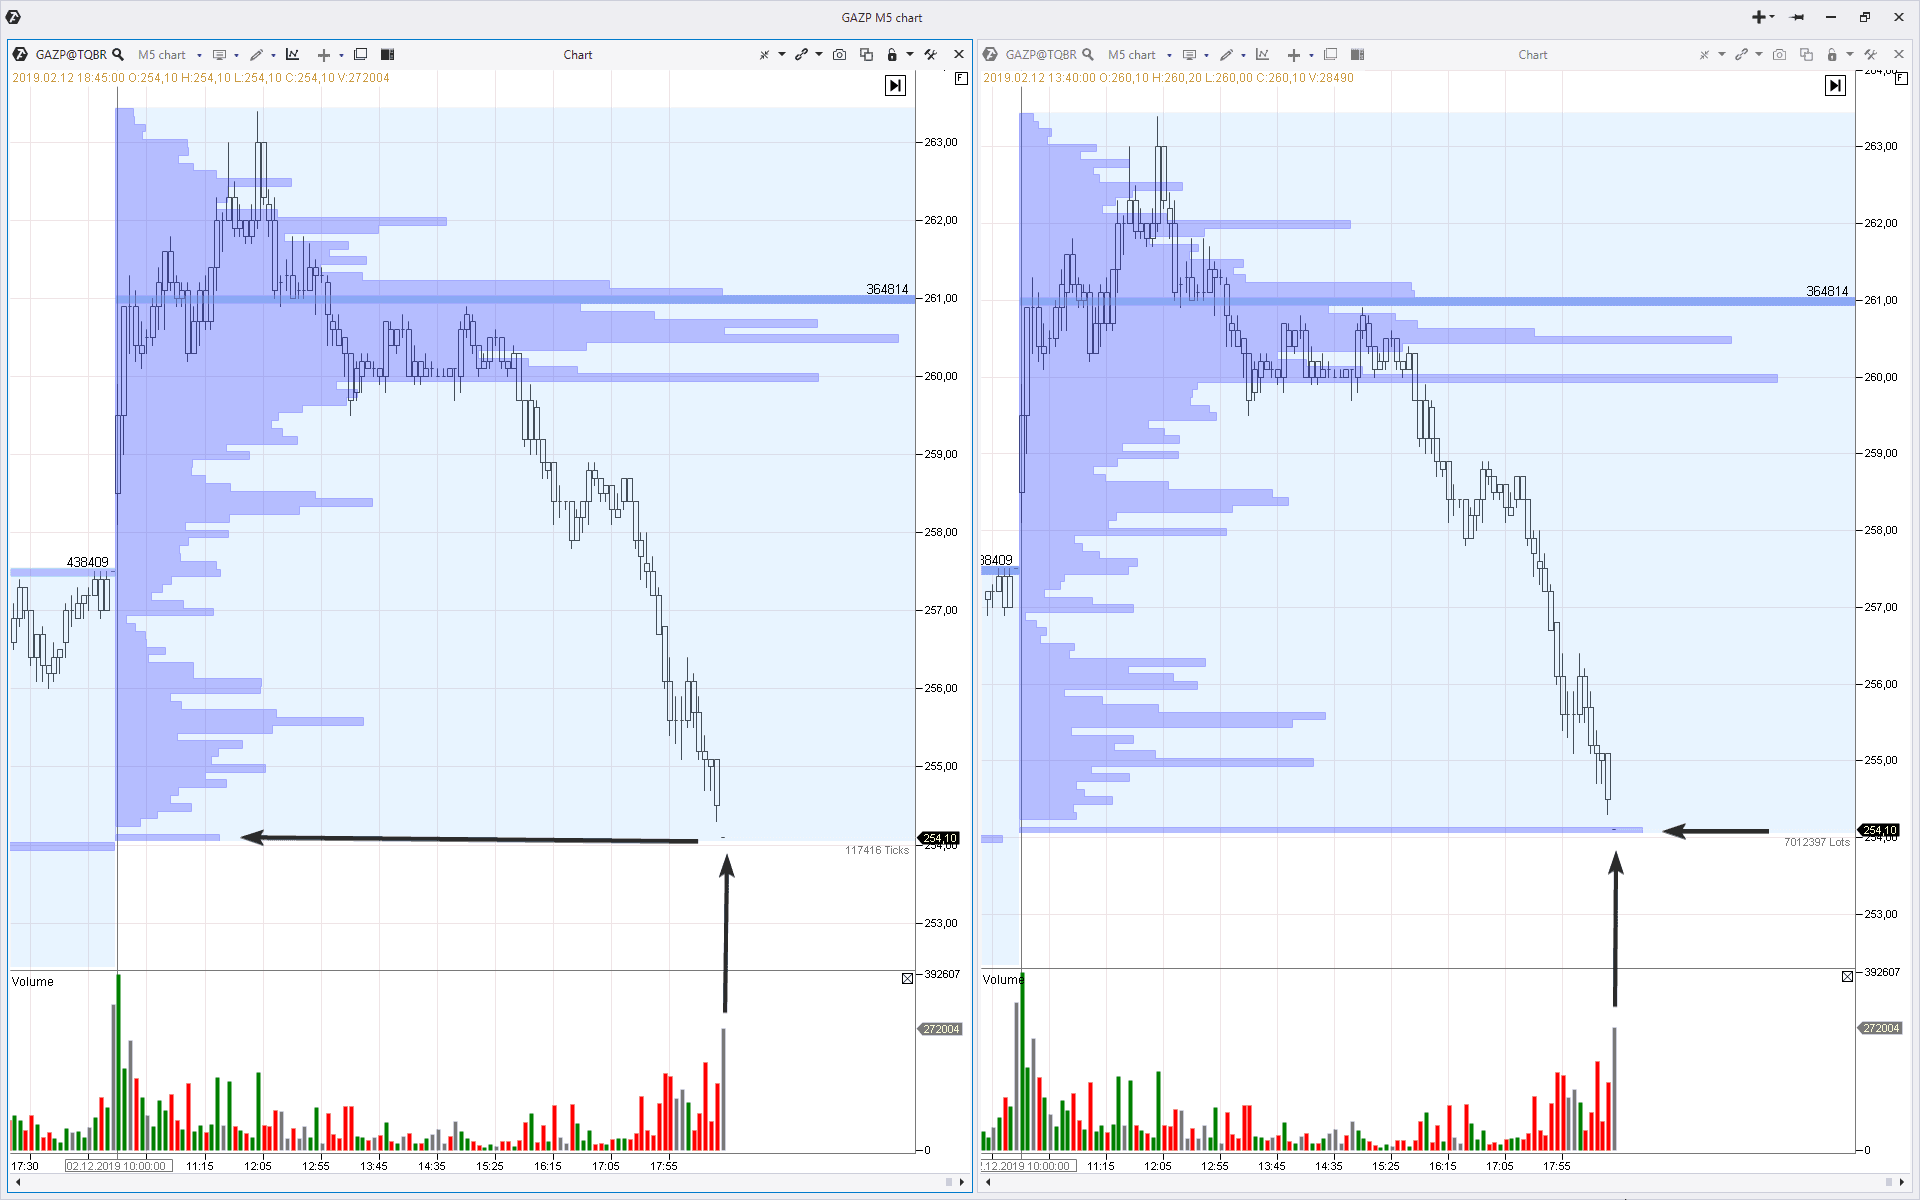
As you can see in the right chart (Volume Profile) there is a pivot here which may inconvenience the process of analysis. Instead, a pivot is much less and the market profile is more well-balanced in the left chart (Trades Profile).
If you select ‘time’ in the profile type, it would also help you to ‘fight’ with closing auctions when building profiles.
Another variant of using the Time Profile is putting it on the charts which are not based on time, for example: range, renko and tick charts.
Summary
The Volume Profile in the trading and analytical ATAS platform is a powerful and flexible instrument for making decisions which are based on the actual market activity.
Is there a volume profile for MT4? We already compared ATAS and MT4, and this comparison is not in favour of the most popular software among Forex brokers. Nevertheless, the volume profiles for MT4 do exist. However, high-quality data from the exchange are required for its operation. The value of profiles in the MetaTrader becomes doubtful since the MT4 terminal receives data from the ‘grey broker’s box’.
You’d better download the test ATAS version free of charge. Assess advantages of use of a professional software for trading on the official exchange.