The VWAP (Value-Weighted Average Price) indicator shows the average price, weighted by volume for a certain period of time.
Major institutional investors and HFT algorithms take it into account. Moreover, this indicator is used by proprietary trading companies for assessing strength and weakness of a specific instrument.
VWAP doesn’t forecast price movement, it reflects the current situation. Using this indicator, traders can, with little effort, visually assess who controls the situation – buyers or sellers – and move along with them and not against them.
How to set up the VWAP indicator
The indicator can look as one or several lines depending on its settings. Let’s see how to set up the VWAP indicator. See Picture 1.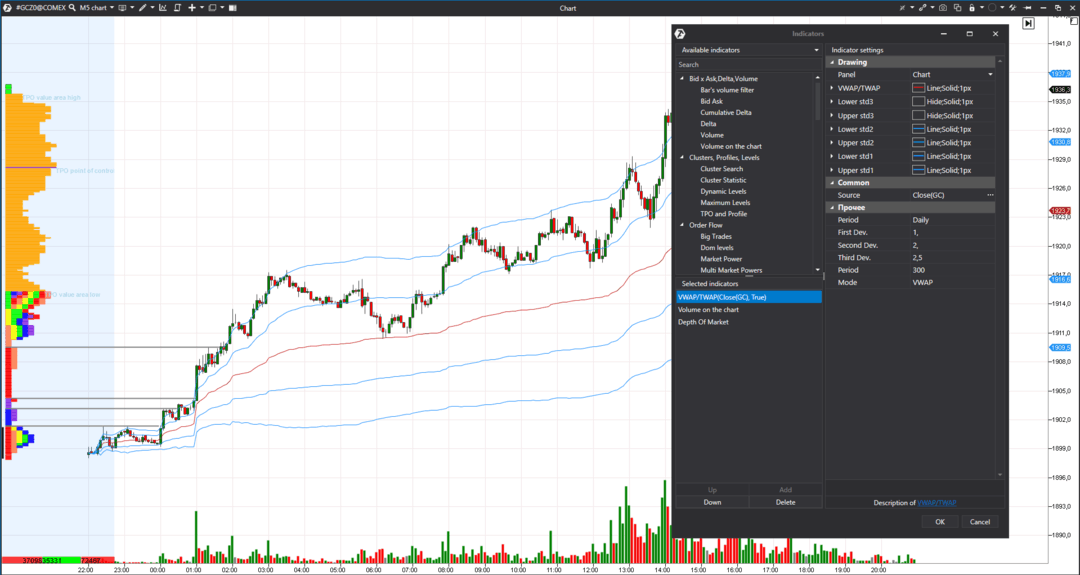
The most efficient would be to use VWAP with the ‘daily’ setting. In this case, it will be recalculated every trading session independent of the previous day. Bigger periods may distort the true indicator value. Nevertheless, for your convenience, you can build the indicator for bigger periods – for example, for a week or month.
There are two modes in the indicator algorithm:
- VWAP – average price weighted by volume;
- TWAP – average price weighted by time.
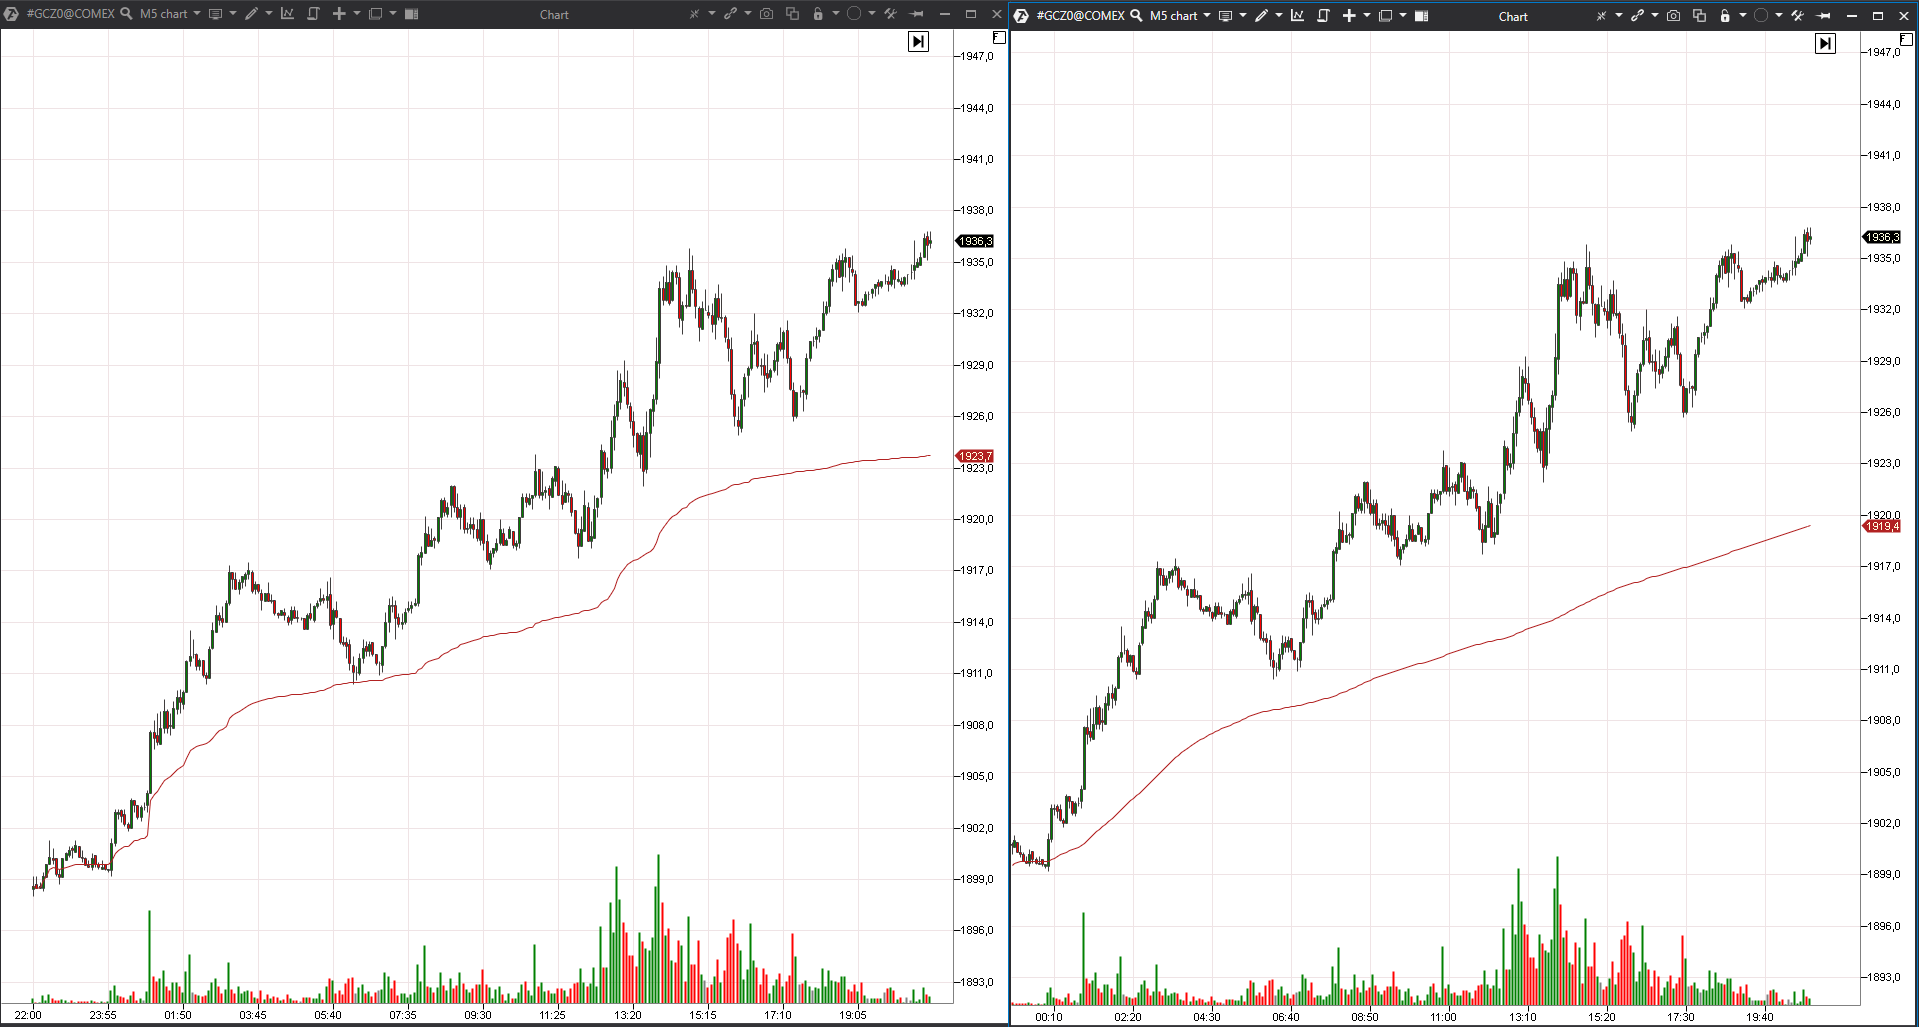
Their difference is clearly seen in the picture below. The 5-minute gold futures (GCZ0) chart shows TWAP to the left and VWAP to the right. See Picture 2.
Price = (Total Price * Volume) / Total Volume
The first value of the daily VWAP, at the beginning of a trading session, would be equal to the price, since neither volume nor price have been accumulated yet. In other words, there is nothing to sum up yet.
It might seem at first sight that VWAP is very similar to the Moving Average (MA). However, there is some difference. MAs and their modifications do not take into account volume, they take into account prices only. As well as moving averages, VWAP lags behind the price, since it calculates past data.
How to use the indicator in trading
If a trader needs to sell a big quantity with the minimum influence on the price, it is the easiest way to do it in the area of VWAP. Institutional traders and investors will buy just below the indicator and sell above it, but traders with a smaller capital use the indicator differently.More often it is used for confirming the trend and as the support/resistance level at rollbacks. It is not efficient to use this indicator mechanically. You should attentively monitor it during the whole day in order to notice a price behaviour change.
VWAP will look like a horizontal line when the price moves within a range.
Let’s consider an example in the 5-minute Apple stock (AAPL) chart. See Picture 3.
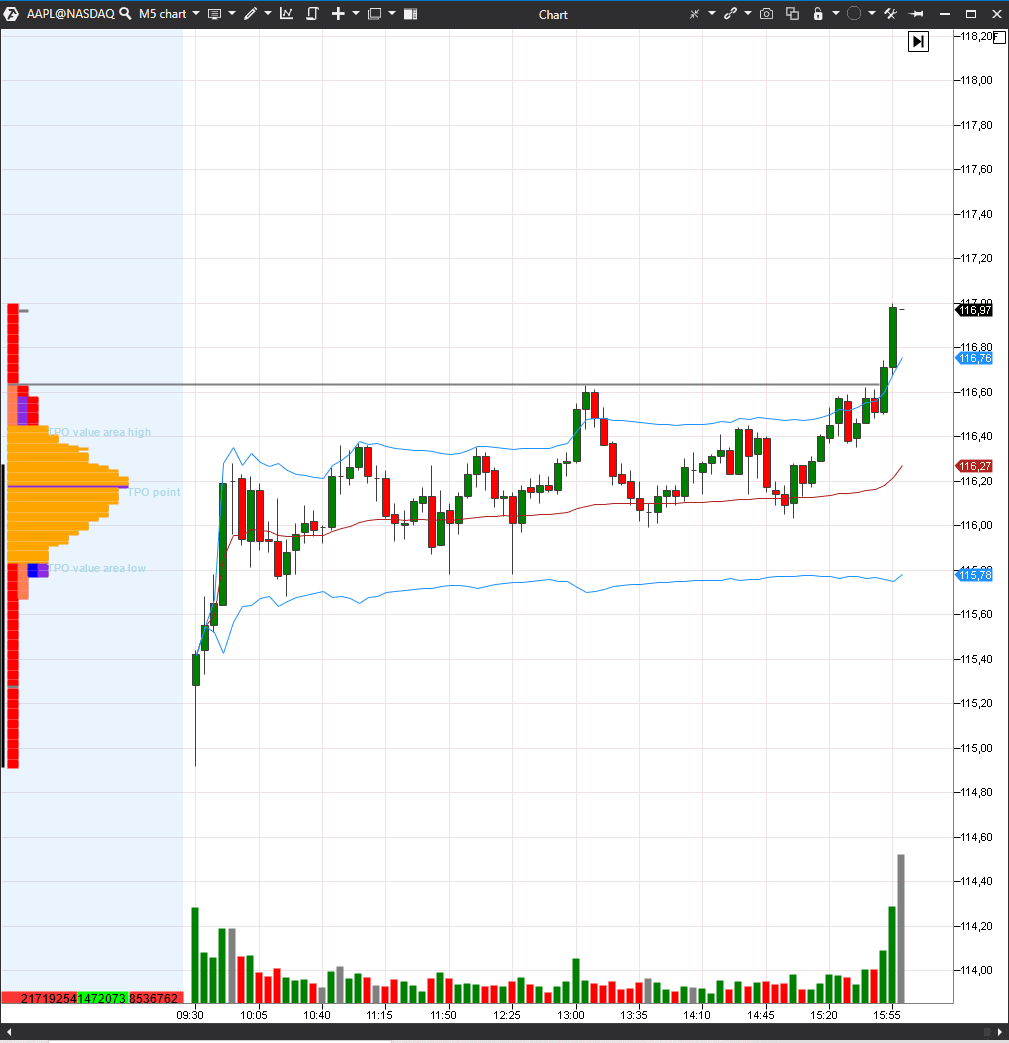
The price was traded within a range without an obvious direction. You may assess the movement potential on flat days with the help of standard deviation – blue lines in the chart show it. It is more correct to open long positions at the indicator level and close them at the upper blue line, since the price stays above VWAP most of the time. Note that candles often have long tails in the area of VWAP, which means that buyers, who do not allow the price to fall, are always below this level.
If the price and VWAP intercross, it is not a clear signal for buying or selling, because it is necessary to wait for the price to consolidate above or below the indicator. It is more efficient to open trades after consolidation above or below the VWAP level.
Many false thrusts and crossings may appear in the event of the indicator down or up movement.
VWAP is directed up or down on trend days. Depending on the strength of trend movement, the indicator inclination angle will change.
If the price ‘breaks away’ from VWAP, it is the sign of strength or weakness. It is not efficient to expect crossing with VWAP on such days, but it makes sense to open positions when the price rolls back maximally close to the indicator for the first time. It is crucial to take the first rollback, because a trader takes the minimum risk at this level and a potential profit is significantly higher than a possible risk.
You should open long positions on buy trend days when the price is above the indicator. Besides, the indicator itself should look ‘upward’. And you should open short positions on sell trend days when the price is below VWAP. Besides, the indicator itself should look ‘downward’.
How to combine VWAP and cluster analysis
Let’s consider an example of a trend day in the 5-minute gold futures (GCZ0) chart. See Picture 4.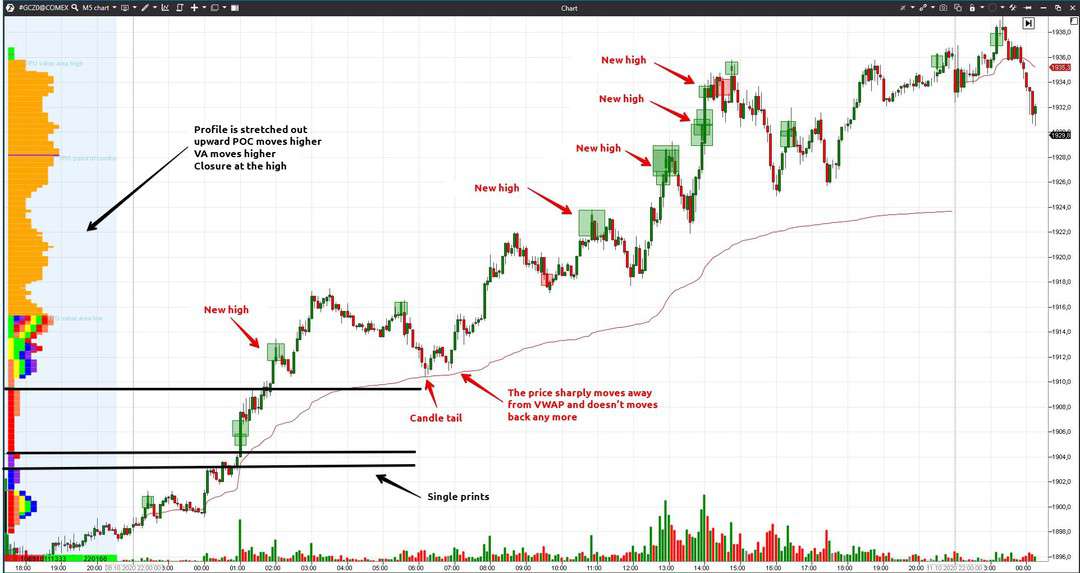
We added the following to the chart apart from VWAP:
- fixed volume profile in the form of TPO;
- the Big Trades indicator with autofilter. Big Trades takes data from the Smart Tape and highlights, in the chart, trades on the criteria, set in the filter. Autofilter changes dynamically depending on activity in the instrument.
Single prints, which we see in the chart before an American trading session starts, increase the probability of a trend day. Single prints appear if the price quickly ‘runs away’ from some levels and doesn’t come back to them during a trading session. Single prints show one of the parties apparent interest – buyers in our case.
The price stays above VWAP. None of 5-minute candles closes below the indicator during an American trading session. Moreover, the price stays significantly above the indicator and this is the sign of strength. One shouldn’t expect price and VWAP intercrossing on such days. One should open long positions at the first rollback and increase the position size at every further rollback, protecting the position with the trailing stop.
Big Trades shows buys practically at every new high. These could be not only new buys but also stops by short positions – such trades add ‘fuel’ to the price growth.
The profile is stretched. The POC maximum volume level and Value Area move up and the trading session closes practically at the high – these signs also confirm a trend day.
In this example, we turned off blue lines of standard deviation, which were used earlier, because one shouldn’t close positions on a trend day when the price moves far away from VWAP.
Indicators help traders to assess a situation, but a trading system, experience and advanced software help to make correct decisions.