How do you use panic in the market to profit?
Panic is an unnatural state of a human being, under which strong emotions and ill-considered actions are characteristic. Being in panic, a person is paralised or, on the contrary, takes steps, which he, normally, wouldn’t do.
Markets are an extension of human emotions and excitement and all feelings, including panic, could be revealed here.
We will speak today about such an important phenomenon as market panic.
Read in the article:
- Panic moods.
- Market crises.
- Dynamic Levels is the panic indicator.
- How to trade under the conditions of panic.
Panic moods
Panic is just a standard market state such as a flat or trend but is not so frequent. However, it takes place regularly.
Panic sell-outs occur when traders or investors think that ‘everything is bad’ and they are ready to run away from the market at any cost.
Are there panic buys? This term is hardly acceptable. If the feeling of fear becomes sharper in panic, we can say that the fear of losses subsides during agiotage, when there is an uncontrollable price growth. Traders are inspired by an uptrend and are profit-driven. They enter into buys with large amounts of money in order to become rich fast and ‘guaranteed’.
We recommend you to read an article about buying and selling climaxes, which is about two extremes – panic sells and euphoric buys.
Panic fall and global crises
Local and global crises generate market panics of various scales. When prices on financial instruments fall, investors try to ‘turn into cash’ at any cost, in so doing they accelerate the fall.
Global crises occur not very frequently, but the biggest reductions of asset prices do occur in such cases. Consequently, very profitable possibilities for doing a short emerge.
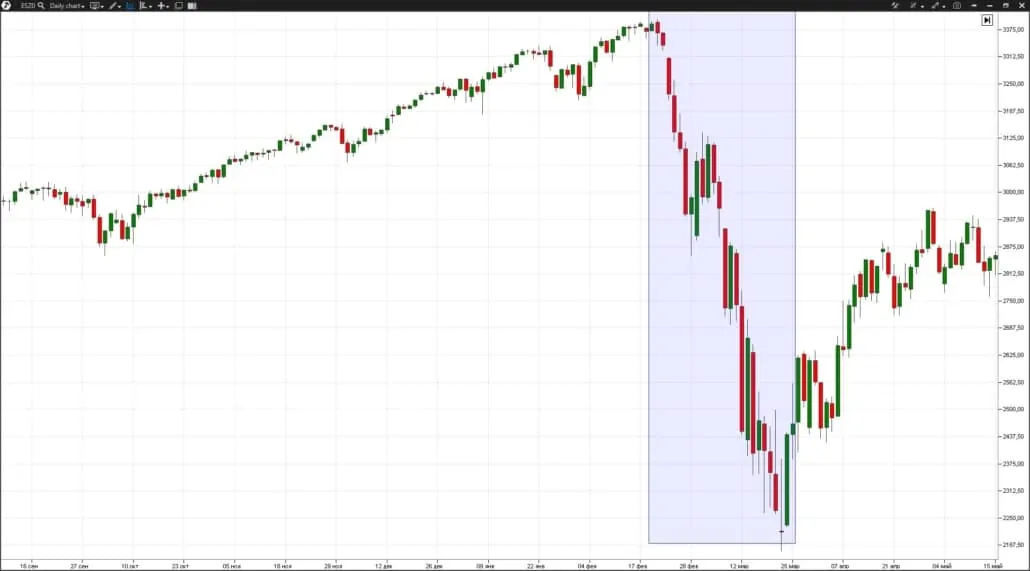
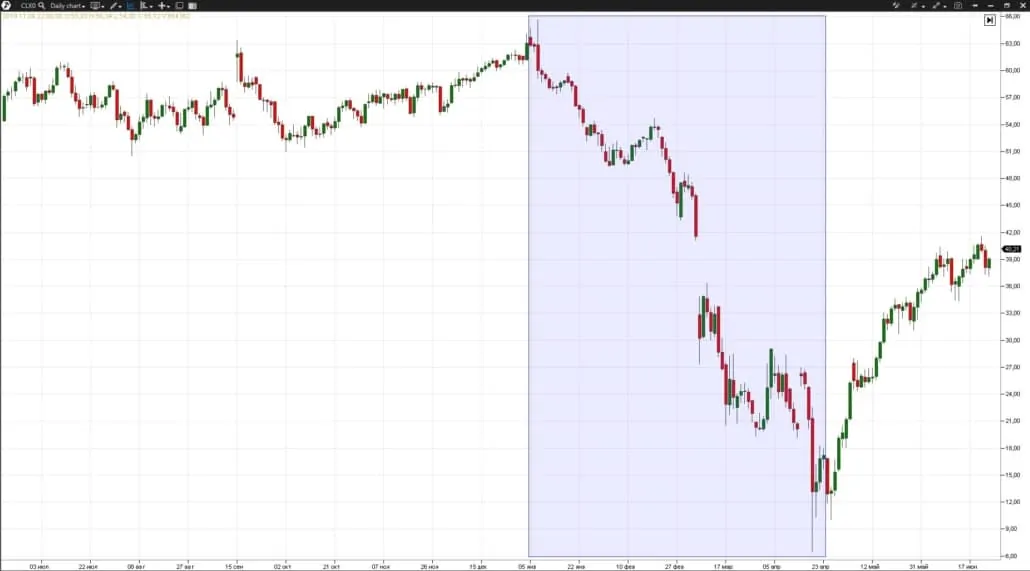
The 2020 coronavirus epidemic generated a number of panic falls in various markets (you can read about this and other crises in the Major market crashes in the 21st century article).
The panic crash in the S&P 500 market in February-March 2020:
Panic crash in the oil market in February-April 2020:
The crash rate during a panic is much higher than the growth rate in pre-crisis times.
The day volatility sharply increases. The month progress of the price growth could be smashed by one day of a fall. These strong movements are provoked by a number of factors, but the panic mood of the market participants play an important role in it.
Should we expect such movements in the nearest future?
Most probably, we should. The world economy problems do not ‘wane’. Coronavirus in 2020 and Lehman Brothers bankruptcy in 2008 are just triggers, which provoked chain reactions. That is why, traders and investors should always be ready for big panic sell-outs.
Dynamic Levels is a market state indicator
As a variant, you can use the Dynamic Levels indicator from the ATAS trading platform in order to identify the current market state.
This indicator dynamically shows changes of the Value Area, where 70% of the selected period volume has been traded. This indicator also shows the maximum volume level for the selected period.
We wrote about Dynamic Levels in the following articles:
- Using the Dynamic Levels indicator for intraday trading;
- Analysis of trading levels with the help of the Dynamic Levels indicator.
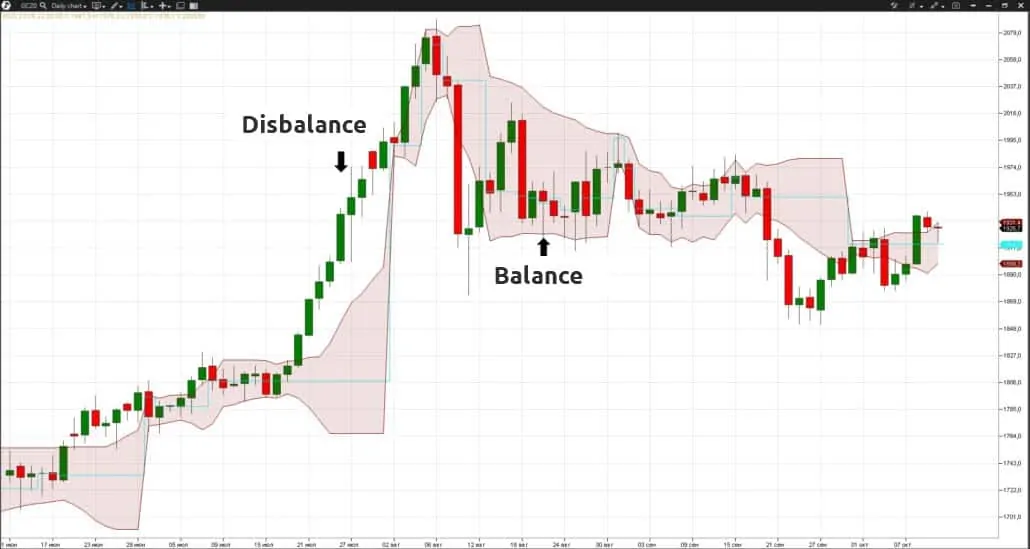
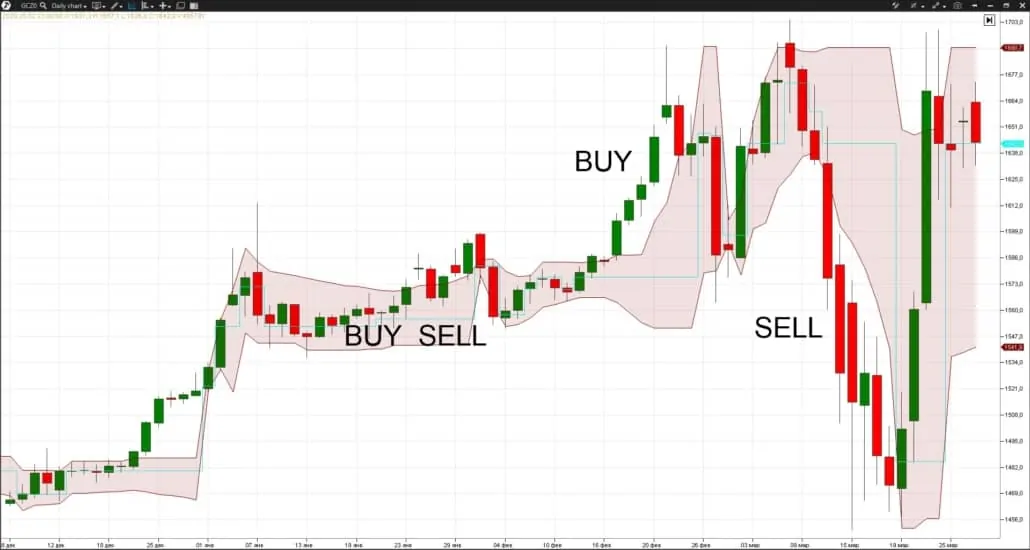
Example of the Dynamic Levels indicator in a daily gold chart:
It is believed that the market is ‘at rest’ when the price fluctuates within the Value Area. This state is also called ‘balance’.
When the state of a trend or disbalance emerges, the market leaves the Value Area. In some cases, a strong trend could be caused by the growth of panic moods.
Disbalance → Trend → Panic
One force predominates in the market during a disbalance – bulls or bears. Consequently, a focused price movement occurs.
There is a version that major players, who accumulated their positions in the balance, start to distribute their volumes during a trend and exit with a profit, while more and more new unprofessional participants try to join a new trend. The trend fades out as soon as major players have distributed the whole main volume and exited from their positions.
The Dynamic Levels indicator from the ATAS trading platform properly shows the current market state and, consequently, availability of panic moods in the market.
However, how to use it in practice?
How to trade when there is panic in the market
Let’s consider 5 ideas, which will help you to make correct trading decisions in times of crises and panic sell-outs.
Idea 1. Always trade in accordance with the current market state in order to avoid big losses during strong crisis movements.
It is better to identify the current market state on a daily time-frame using the Dynamic Levels indicator (the indicator period is 1 month).
Why could a month be an efficient period? Because many investment and hedge funds publish monthly reports and, consequently, closing a month net positive is important for them. And this could influence profit registration at the end of the month by open positions and accumulation of new positions at the beginning of a new month.
Example of the Dynamic Levels indicator with 1-month period is shown in the picture below:
- If the market is in balance within the Dynamic Levels indicator lines, you can both sell and buy.
- If the market moves outside the boundary lines upward, it is better only to buy and do not execute trades against the growing market.
- If the market moves outside the indicator balance lines downward, it is better to sell and do not try to continue to make losses, waiting for the growth, since, sometimes, the falls are panic, fast and volatile.
Idea 2. If there is negative news, which may provoke panic movements, then you need to track the daily time-frame with respect to the market exit from the balance state.
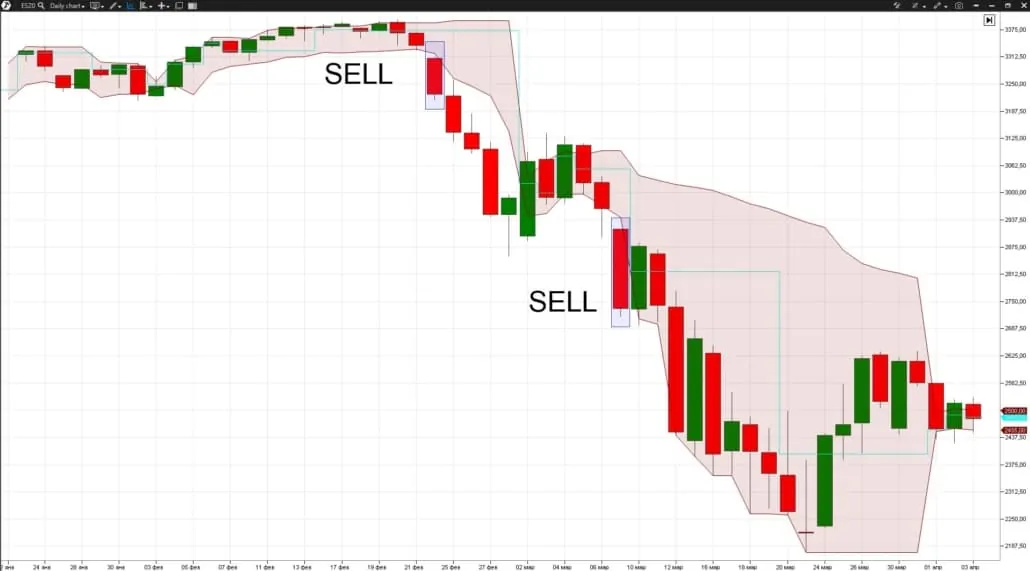
We can consider an example of such a situation in the S&P 500 index chart (as of February-March 2020):
The first exit from the balance state, after publication of news about coronavirus, took place on February 24, 2020, and the second one – on March 9, 2020.
These two days were characterised with trend candles with minimum shadows, which testified to the strength of bears. It was a good situation for opening sell trades.
Idea 3. When there are panic moods in the market, it may seem to you that the price already fell rather far. However, you shouldn’t worry about entering into sells too late. Panic is the time of big downtrends and if the market exited the state of balance, the probability of movement continuation prevails.
Idea 4. Of course, there could be a false breakout of the state of balance with subsequent return to the previous range.
That is why, it is necessary to strictly control your risks and post stop losses behind extreme points of the signal candles. It is better not to put at risk more than 1-2% of your capital in one trade. In such a case, your account wouldn’t suffer too much even if there is a false move.
Idea 5. You should let the profit grow during panic, since movements could be unpredictably big. That is why, it is better not to use hard take profits, but to accompany a trade moving a stop loss behind extreme points of new days. This way you will be able to maximize profit with minimum risks.
Conclusions
Despite the fact that panic is an abnormal human state, a panic fall in the market could be considered a standard phenomenon. Small-scale panics occur every day on the smallest periods.
That is why it is important to be able to trade panic. In order to make a profit rather than loss on panic:
- Control risks. Limit your losses to 1% of your deposit, then possible losses will not trigger strong emotions and, let alone, ill-considered actions.
- Analyse the current market state every day. Use the Dynamic Levels indicator to understand whether there is panic in the market.
- Always trade in accordance with the current market state.
We will finish our article with a famous quote of baron Rothschild: “Buy when there is blood in the streets”.
The quote is in conflict with the article idea, but markets always have 2 sides. While panic falls provide reasonable entries into short-term sells, they lay foundation for long-term trends from the investor point of view.
Keep your head cool. Do not allow emotions to influence your decisions. The ATAS platform functionality will help you to act more rationally.
Information in this article cannot be perceived as a call for investing or buying/selling of any asset on the exchange. All situations, discussed in the article, are provided with the purpose of getting acquainted with the functionality and advantages of the ATAS platform.

