COT reports, deep fundamental analysis, option levels, agency ratings, investment company forecasts and various scanners of patterns/volumes/news – all these means are used in the classical centralized markets.
The cryptocurrency market differs from them due to its nature. However, it also has sources of additional valuable information for analysis, which you cannot draw out from the cluster chart and/or order book.
These sources mainly use blockchain functions, which increase network transparency and thus help analysts and traders to make more justified decisions.
In this article, we will conduct a brief review of 9 such sources:
- The most complete historical chart of BTC/USD.
- Glassnode.
- Look Into Bitcoin.
- Never Look Back.
- Coinmarketcap.
- Coinmetrics.
- Coin 360.
- Bybt.
- Skew.
It is not the goal of the article to advertise third-party web-sites. In some cases they even compete with the ATAS platform functions. We are not connected with these services and cannot guarantee their quality. We just want to help cryptocurrency traders (there are some of them in the ATAS team) to have a broader outlook and better understanding of exchange trading and to make less losses because of hasty decisions.
Ready? Let’s go!
All-Time Bitcoin Price Chart
The bitcoin.zorinaq.com/price/ contains the most complete historical interactive chart of the bitcoin price. It is renewed once a day and is not as informative as cluster charts from cryptocurrency exchanges in the ATAS platform. However, its notability lies in the fact that it traces its history from the very first registered bitcoin price.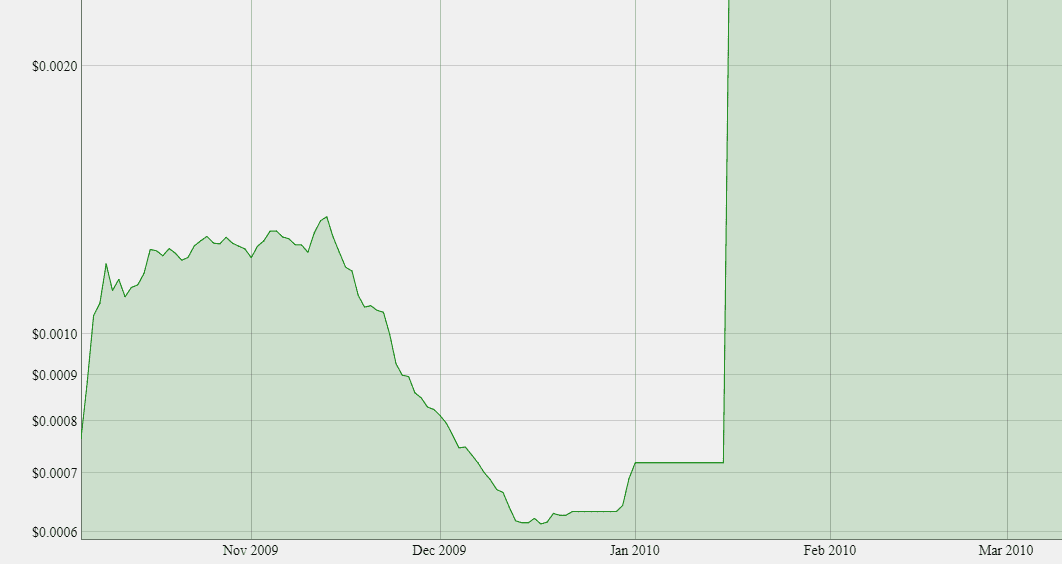
It was possible to buy BTC 1,309.03 for USD 1 on that day. Actually, the New Liberty Standard wasn’t an exchange – it only calculated BTC value based on the cost of electric energy, which was required for mining.
However, thanks to its data, we can see the historical bottom of BTC/USD in December 2009, when USD 1 cost BTC 1,600 (equal to USD 60 million as of the end of May 2021). It’s unlikely that many people bought at that bottom…
Glassnode
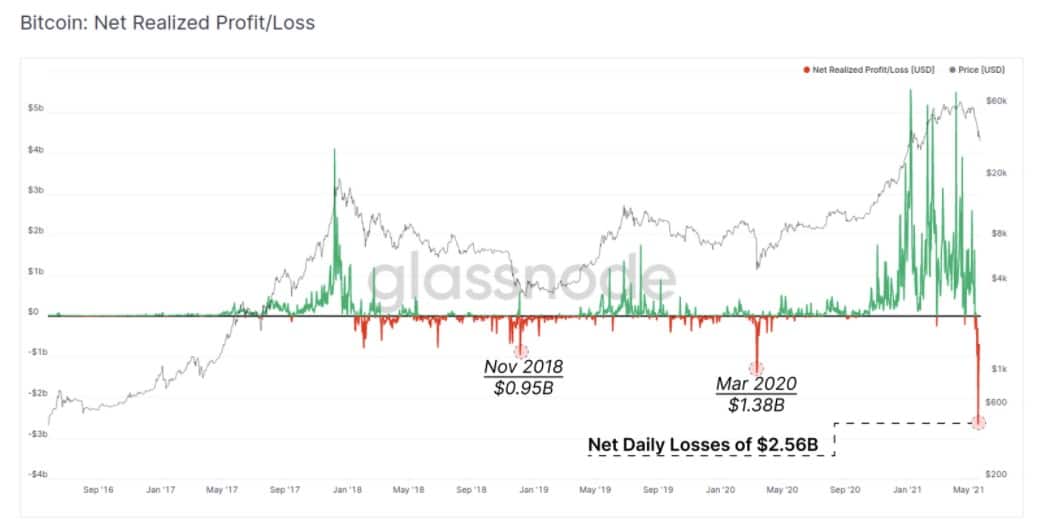
The glassnode.com is a Berlin agency, which deals with blockchain network analysis.It was founded by professional financiers, who realised that classical instruments were insufficient for cryptocurrency market analysis. That is why Glassnode developed its own metrics of activity in the cryptocurrency markets in order to provide them to analysts.
For example, the chart below shows that the maximum size of investors’ losses for the whole period of cryptocurrency trading was reached during the panic in the cryptocurrency market on May 19, 2021. It is interesting that the chart shows the tendency:
- to go down after the profit peaks have been reached;
- to go up after the loss peaks have been reached.
- setting up alerts by peak metric values;
- training on metrics.
Informative market reviews on the basis of metrics are published every week in the Insights blog.
Look Into Bitcoin
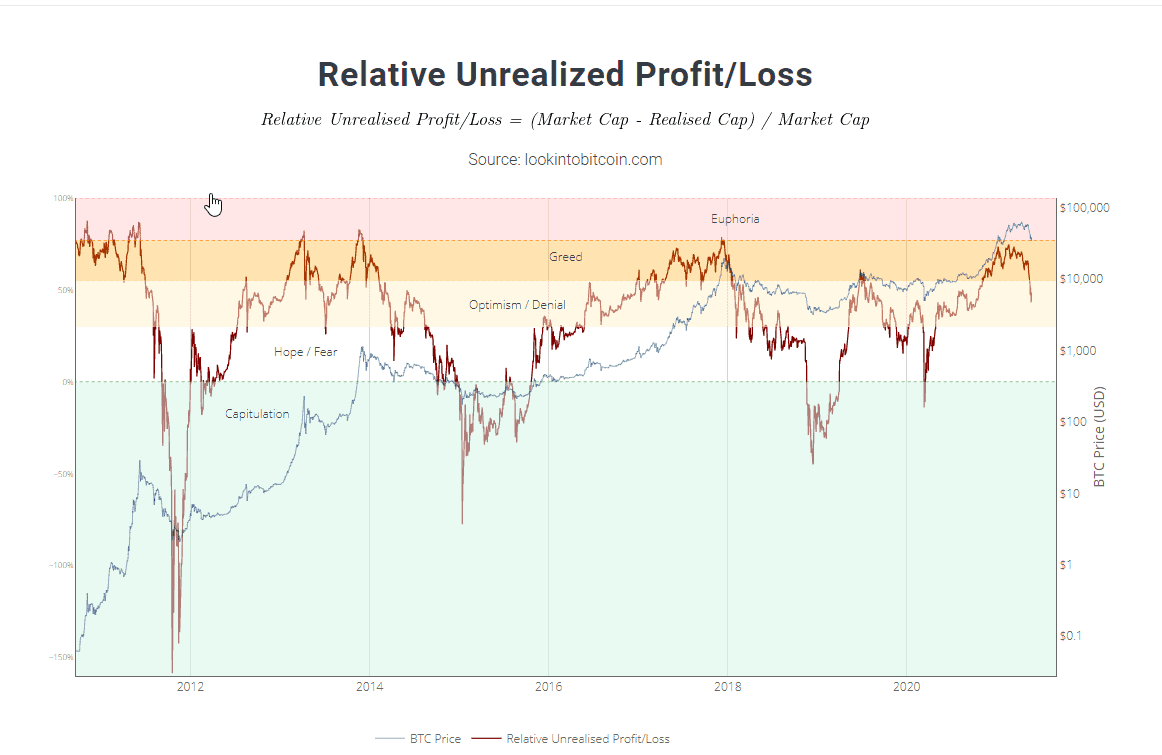
The lookintobitcoin.com is a web-site with free access, which provides useful instruments to people, who are interested in bitcoin.The web-site consists of three main sections:
- Training. Educational articles, which show inexperienced cryptocurrency investors how to use special instruments for assessing the blockchain.
- Real-time charts. They use market cycle or blockchain network analysis and provide clear indications in order to help identify whether BTC is overvalued or undervalued from the historical point of view.
- Indicator signals. They help investors not to miss critical moments of price cycles in the charts.
Never Look Back chart
A simple but interesting historical bitcoin chart could be found on bitcoin.craighammell.com. It is a logarithmic chart of bitcoin prices, which is called Never Look Back. The name implies that BTC, after passing a certain level, never comes back.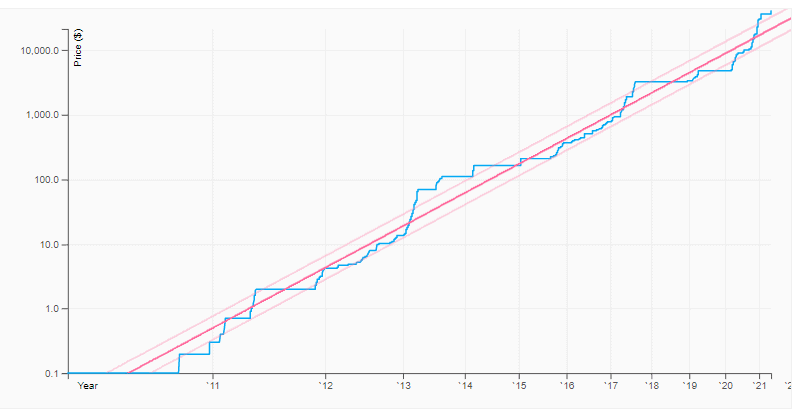
Technically, we could assume that the blue upward line is vulnerable to ‘redrawing’ of its values.
Coinmarketcap
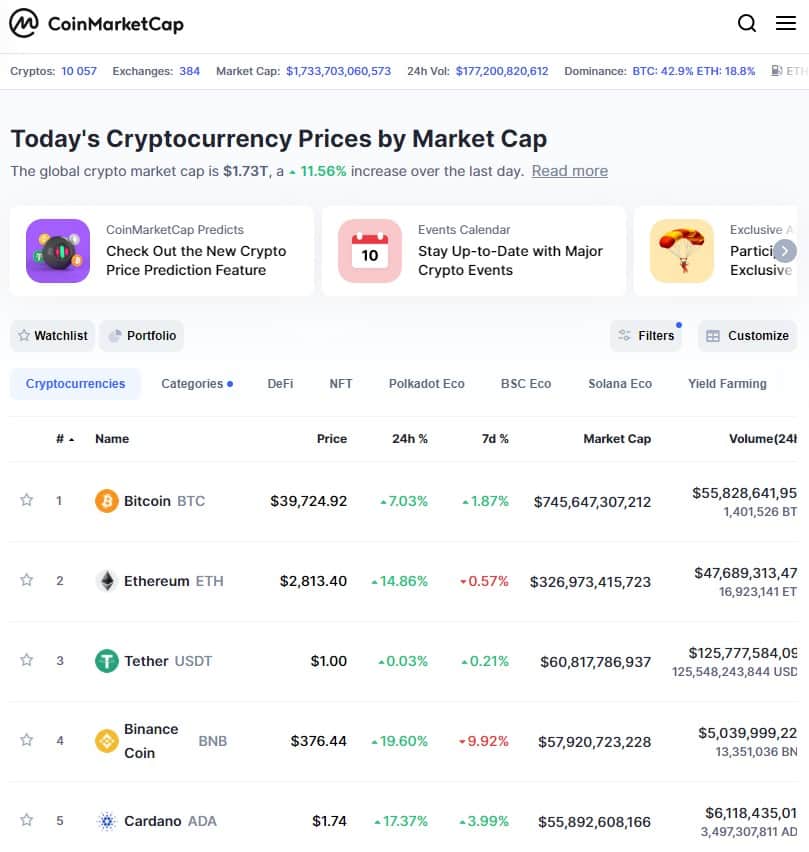
The coinmarketcap.com is a must-have portal for cryptocurrency traders.It is a branch standard. It contains metrics / ratings of:
- individual cryptocurrencies (there are more than 10 thousand of them and assets are sorted out by categories);
- individual exchanges;
- NFT tokens.
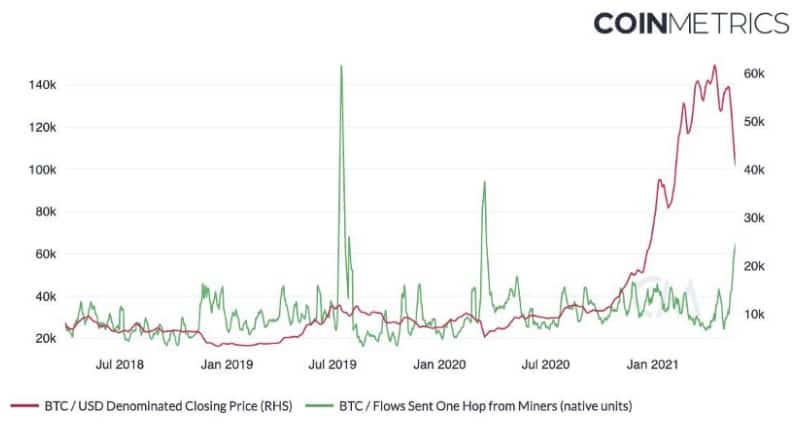
Coinmetrics
The coinmetrics.io is a web-site, which presents cryptocurrency market metrics. Similarly to Glassnode, Coinmetrics keeps its analytical blog where it publishes its conclusions about cryptocurrency markets.For example, the Coinmetrics chart below shows that the panic of May 19, 2021, was provoked by sales of Chinese crypto-miners after the Communist Party of China aggressively spoke against crypto-miners and cryptocurrencies in general.
Coin 360
The coin360.com is a market thermal map. It could be used for identifying the strongest/weakest cryptocurrency for 1 hour/day/week. It is possible to select an arbitrary time period.
The following is also available:
- a separate map for exchanges;
- sorting by assets, which increased/decreased in value more than others.
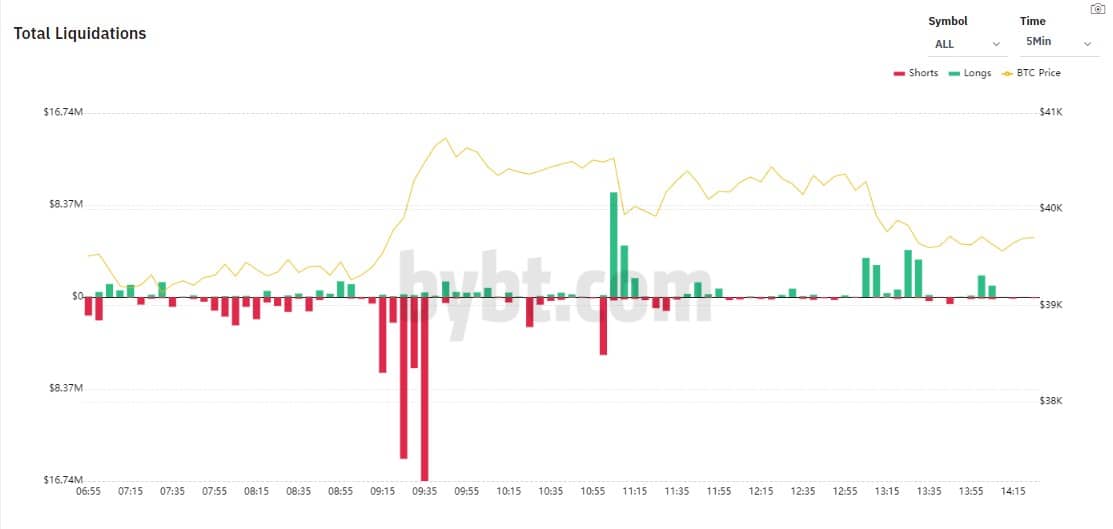
Bybt
The bybt.com is a powerful resource with cryptocurrency market metrics. It collects information from leading exchanges and provides it with up to 1 time per minute update.The users can track/analyse:
- Open Interest data;
- buys/sells of a big cryptocurrency Grayscale fund and also some ETF funds;
- the general balance of the buyer and seller positions by various exchanges/coins;
- liquidation of long and short positions by various exchanges/coins (see example in the chart below).
Skew
The skew.com is a web-site, which provides access to professional cryptocurrency market metrics.
Conclusions
Combine powerful indicators of the trading and analytical ATAS platform with additional data in order to:- better understand the market structure;
- make the most justified decisions;
- find the best entry points.
Do you want to share a useful source of information for cryptocurrency market analysis, which is not mentioned in the article? Please, mention it in the comments.
Information in this article cannot be perceived as a call for investing or buying/selling of any asset on the exchange. All situations, discussed in the article, are provided with the purpose of getting acquainted with the functionality and advantages of the ATAS platform.