How natural gas prices are changing. Analysis.
Natural gas futures (NG) is:
- the third world biggest commodity delivery futures contract by volume;
- widely used as a national natural gas benchmark price and the most important world energy source;
- allowing market participants carrying out hedging for risk management, connected with the natural gas price volatility, caused by the demand.
In this article we will:
- conduct analysis of abnormal growth and fall of a futures contract price in 2018-2019;
- build a long-term forecast.
We will use data of a futures contract (NG) trading on a day period. Apart from the price and volume dynamics, the Stacked Imbalance indicator is set in the chart.
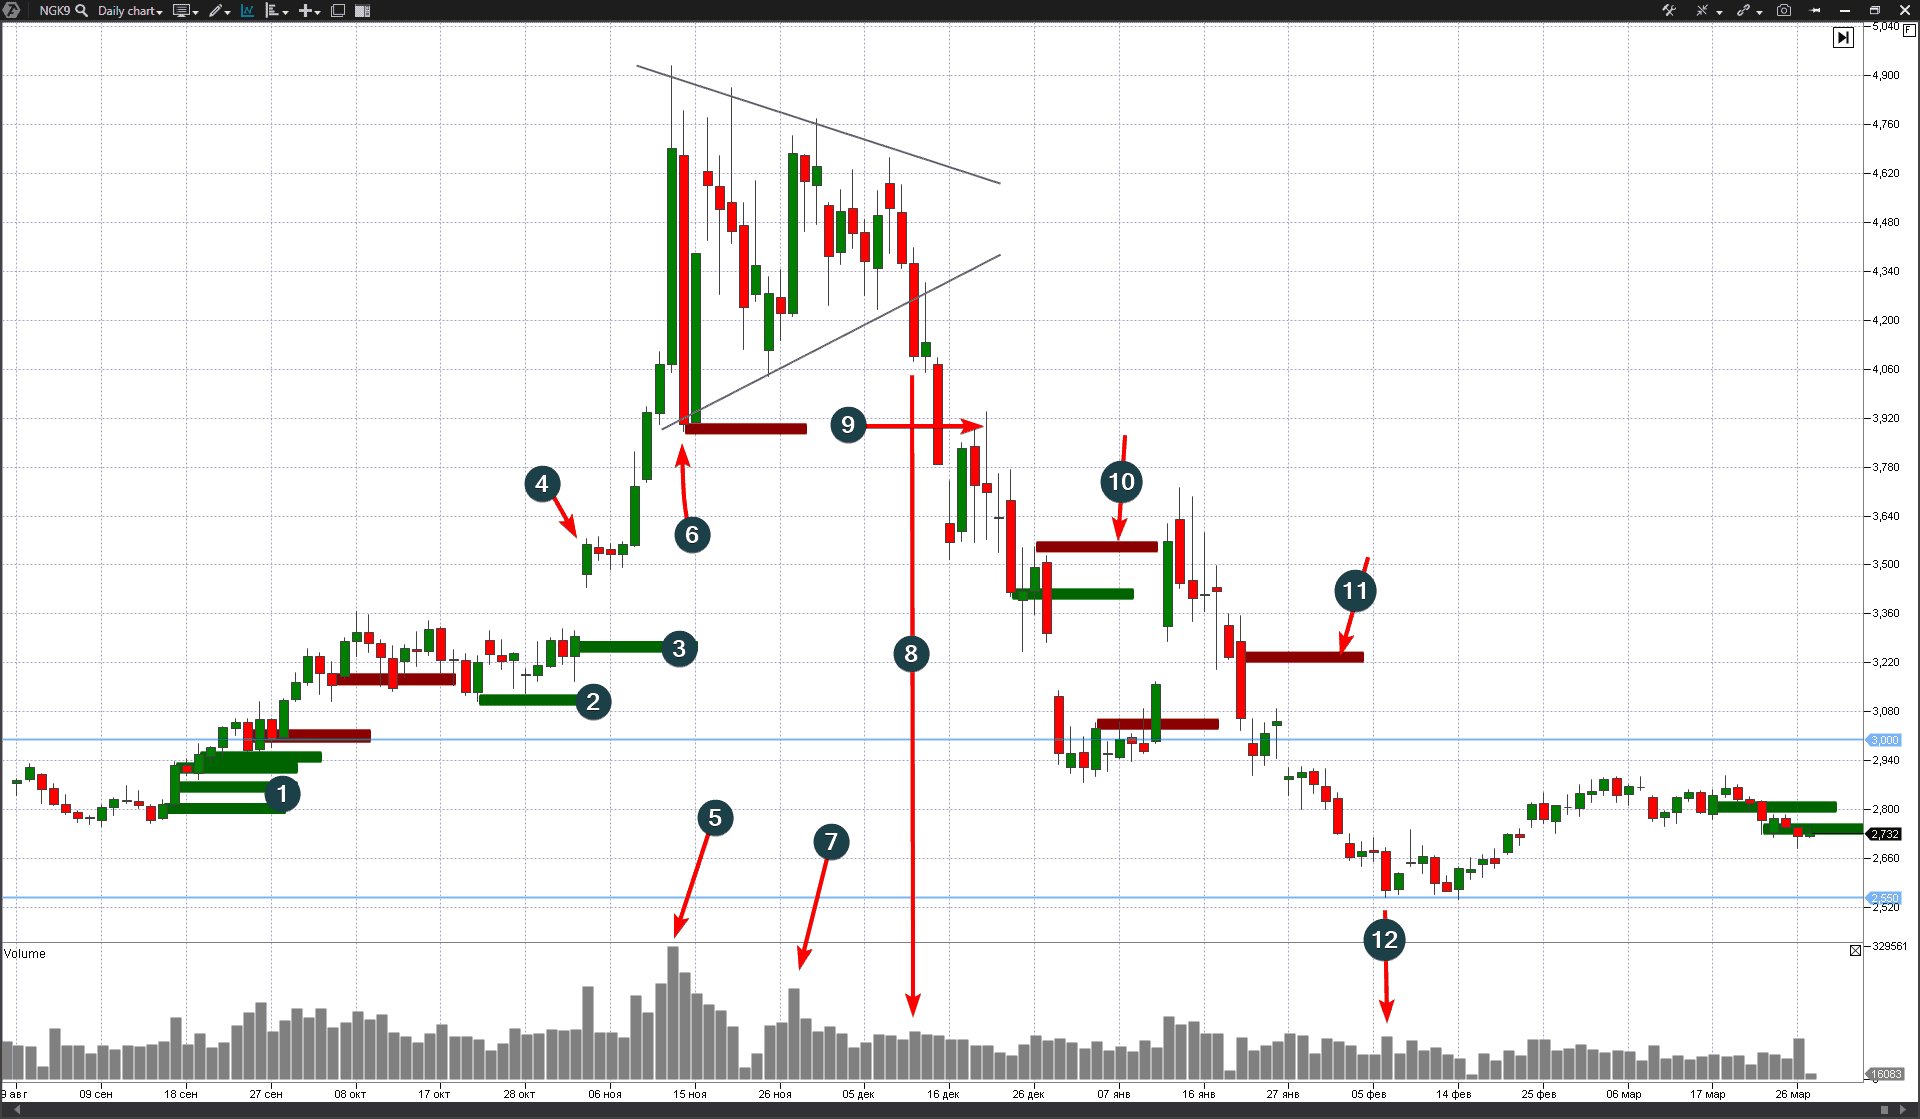
The futures contract price was traded in the range between the support level of USD 2.55 and resistance level of USD 3.0 per contract during a long period of time (majority of months of the years 2017 and 2018). However, interesting events took place in the beginning of September.
Multiple imbalances (what imbalances are and how to trade them) of buyers (marked with number 1) ensured the growing natural gas price support and pushed it from a long-term corridor on a growing volume. This behavior of imbalances, volume and price testifies to a true breakout and serious mood of buyers. The growing natural gas price found resistance in the area of USD 3.30 per contract in the middle of October.
The support grew, which is confirmed by the growing levels of buyers imbalance (marked in the chart with numbers 2 and 3). The market (arrow 4) was opened with a gap on Monday, November 4, “having jumped” over the resistance of USD 3.3 per contract. The price quote moved upward incrementally during the next days.
An extremely aggressive price growth from USD 4.07 to the peak of USD 4.80 per contract took place on November 13. The natural gas price growth achieved 20% during one day. Volumes were extremely high (marked with arrow 5).
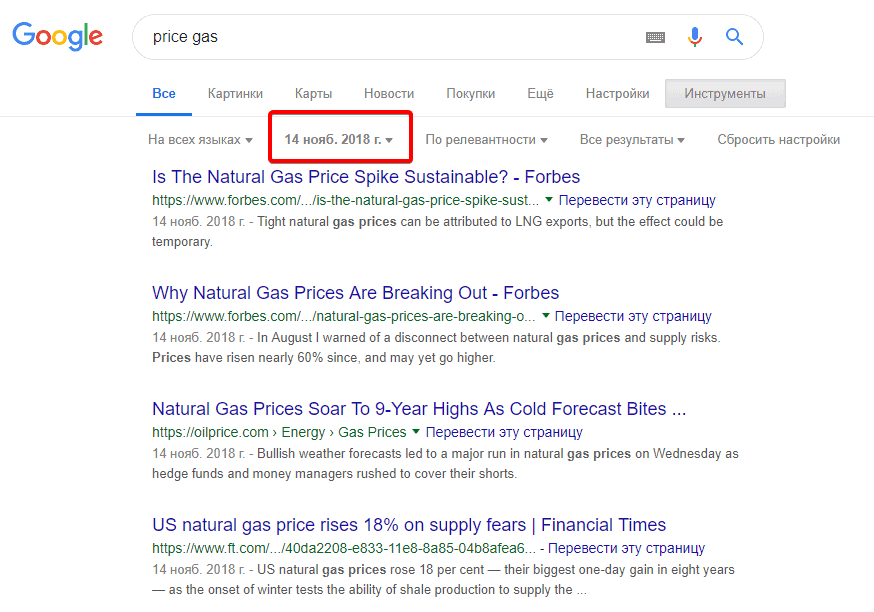
This growth was actively discussed in the news.
Experts explained it with reduction of deliveries, bad weather forecast and closing short positions of major hedge funds. But the chart data show us that, in fact, it was a buying climax, which you can get acquainted with in a respective article about VSA and cluster analysis.
The price was closed at the level of USD 3.88 per contract the next day, on November 14 (marked with arrow 6), which is below the psychological level of USD 4. It means that the sellers levelled out 20% of the growth progress during one day on an abnormal green candle of the previous day. It is a negative sign and confirmation of the yesterday’s buying climax.
Imbalances point at panic sells on the trading low on November 14. The power of hidden buys by limit orders ensured temporary support. And the market of natural gas contracts entered a contracting range (wedge pattern), restricted with the low of November 14 and high of November 13.
The volume splash on November 27 (marked with arrow 7) attracts attention in this range. It was an effort of buyers to renew the crazy rally. However, as the historical data show, there was no growth during the next days. On the contrary, we can see price reduction on the growing volume and breaking the support level of the wedge pattern on December 11 (marked with arrow 8).
This natural gas price dynamics tells us that the period of active trades over the level of USD 4 per contract is an area of weakness, where a major seller established his short positions.
Testing (marked with arrow 9) of the imbalance breakout in the area of USD 3.90 (one more signal for selling) took place on December 18-19 after the candle top breakout test on December 12 (a profitable position for entering the game on the bearish side during the next session).
Later, the decreasing imbalances of sellers continued to press (marked with numbers 10 and 11) and the price went down significantly to enter its previous and commonplace corridor at the level between USD 2.55 and USD 3 per contract.
Note the volume splash on February 6 (marked with arrow 12), which is characteristic for a small panic. It is of interest that 5 days later, on February 13, the trading was carried out exactly at the level of this panic but had a significantly lower volume of traded natural gas contracts. It means that the panic sells were absorbed by a buyer and the market is ready to start from the old support of USD 2.55 per contract.
The recent data show that a natural gas contract is balanced exactly in the middle of the range with support of USD 2.55 and resistance of USD 3 per contract. These price levels are determined by fundamental data and long-term market situation.
The closest serious opportunities should arise when the price approaches the said corridor boundaries.


