7 features for the fundamental analysis of the fx market
We found this brilliant definition in one of the fundamental analysis textbooks.
Fundamental analysis is what traders do not see on the screens of their terminals and in the charts.
In this article we will discuss why traders need what they do not see and how the invisible hand of fundamental analysis influences price movements.
- What fundamental analysis of the currency market is.
- Basic Forex and forward market currencies.
- Theoretical grounds and indicators of the fundamental analysis.
- Key indicators, which influence the USD exchange rate.
- Influence of political events on currency exchange rates.
- How to trade on fundamental news.
- Advantages and disadvantages of the fundamental analysis of the currency market.
What fundamental analysis of the currency market is
Fundamental analysis of the currency market is an assessment of a change of a currency value on the basis of the economic situation, financial policy of Central Banks, availability of cash in circulation and other macroeconomic indicators.
The currency market differs from the stock one with:
- Bigger stability. At first sight, this statement seems awkward, but when you analyze it you will understand that there are no sharp falls of everything at the same time, like it happens in the stock market. If one currency falls, another one is bound to grow.
- Global character. Currencies are traded round-the-clock.
- Smaller number of markets. There are thousands of companies and only dozens of currencies.
Both long-term position investors and intraday traders use fundamental analysis. Long-term investors identify the main trend and hold the position. Intraday traders use high volatility when news are broadcast.
Basic Forex and forward market currencies
Basic currencies in the Forex market are USD, EUR, JPY, CHF and GBP. It is believed that the currency value is identified by demand and supply and is in ‘free floating’. Although, there are exceptions, like, for example, it has been with the Turkish Lira (TRY) recently. While TRY was falling, the TRY/USD rate was rather strictly regulated by the government.
One can trade currencies not only in Forex, but also in the forward exchange market (futures).
Trading futures currency contracts in the forward market is more interesting for traders because:
- futures contracts have the Open Interest (OI). Globally, the Open Interest shows inflow or outflow of money from the markets. The Moscow Exchange broadcasts the Open Interest online. CME (Chicago Mercantile Exchange) provides data about the Open Interest with a delay, instead it splits it into different groups. And traders can see what major manufacturers, small speculators and hedgers do. Larry Williams built one of his indicators (Willco) using this data.
- exchanges show real volumes of traded contracts.
- futures contracts with different expiration days are traded at the same time. One can forecast future movement of currency prices or trade spreads.
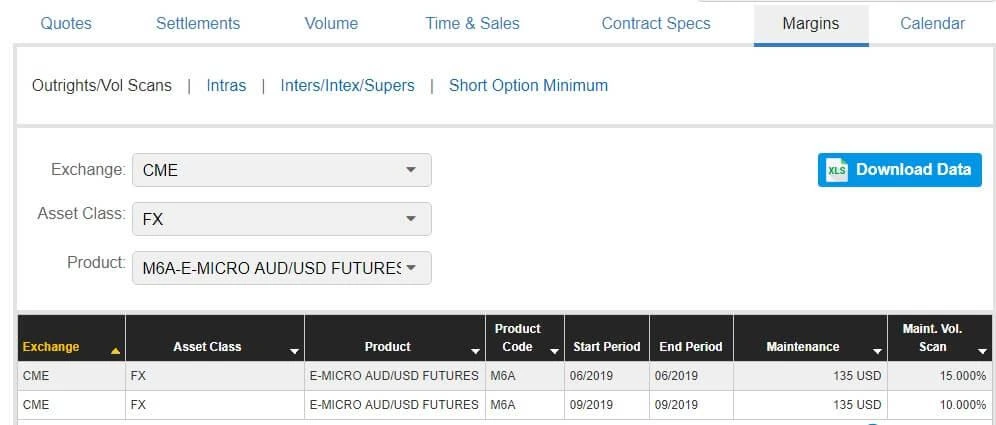
- guarantee collateral on futures contracts allows trading even with a small starting capital. The minimum amount for trades with micro-contracts on CME is from USD 135 to USD 320. The guarantee collateral on futures contracts on the Moscow Exchange is even less – from RUB 2,200 to RUB 13,200.
Theoretical grounds and indicators of the fundamental analysis
Let’s restore the macroeconomic theory in our memory before we discuss basic fundamental analysis indicators. This section could be boring. If you know what GDP, unemployment and trade balance are and how they influence currency exchange rates, go directly to the next section.
Fundamental data could be conditionally divided into several big groups:
- Economic and financial data – these are basic indicators, which influence the price quote movement. Unemployment, inflation, money supply and interest rates.
- Political events – Donald Trump’s tweets and Theresa May’s resignation.
- Crises and unforeseen events – crisis of 2008 and earthquakes.
It is impossible to assess the influence of analytical data on currency prices without taking into account business cycles. Economy of any country develops in cycles:
- Recession – fall of economy, crisis and depression;
- Restoration;
- Development – continuation of growth of the economy to a new maximum;
- and so on in circle.
Economic indicators of the fundamental analysis behave differently at different stages of the business cycle. Some indicators are late, while some are ahead and warn about cycle changing. The state tracks and forecasts cycles.
Changes of indicators for a certain period of time or in comparison with other countries’ indicators, rather than absolute indicator parameters, are important for the fundamental analysis. Data, which significantly differ from the previously forecasted indicators, are of special importance.
Fundamental factors, which influence the currency exchange rate:
- Central Banks and interest rates;
- trade balance;
- stock indices;
- money in circulation;
- inflation;
- unemployment;
- GDP and industrial production.
Let’s consider each of the factors in brief.
Central Bank
Central Bank is the main state organization in a country. Central Banks ensure stability of national currencies. They have various instruments of influence on demand and supply. The US Central Bank is called the Federal Reserve System or simply the FED. Central Banks conduct different monetary policy, depending on the state of the economy and business cycle:
- Expansionist – to stimulate the falling economy. They buy out securities from banks and supply them with cash, decrease interest rates and increase the money supply.
- Restrictive – to avoid inflation and heavy crisis of the rising economy. Central Banks sell securities, increase interest rates and decrease the money supply. Such a policy results in more expensive loans, growing unemployment and falling consumer demand.
Trade Balance
Trade Balance is the difference between export and import. Theoretically, if export is bigger than import, the inflow of foreign currency into the country grows and demand on the national currency grows too, since it is needed for exchange. Consequently, the national currency exchange rate gets stronger. If import is bigger than export, it is the opposite and the national currency gets weaker. We said ‘theoretically’, when speaking about the trade balance, for a reason. In real life, macroeconomic factors mix and influence each other, that is why it is impossible to accurately calculate the trade balance influence on currency exchange rates. However, broadcast of news about the growth of a trade deficit of international trade could result in the exchange rate fall. The trade balance also reflects demand on commodities abroad. The low cost of the national currency is good for exporters. They have an advantage in the global market, since their commodities are cheaper. Consequently, the low cost of the currency results in export growth. That is why Central Banks could decrease the currency value for increasing export. Export has a significant influence on economic growth of a country.
Stock indices
Stock indices behaviour or demand on stock also influences the currency exchange rate. Permanent buying interest in stocks, nominated in a certain currency, increases the exchange rate of this currency.
- The main American Index is S&P 500.
- The main Russian Index is RTS.
Money supply
Money supply – surplus of one currency creates an increased supply and reduces the value of this currency. Consequently, the currency deficit increases its value, because the demand increases and supply decreases. The M2 money stock is the key one for the US, while M3 money stock is the key one for the Euro Zone.
Interest rates
Interest rates – the higher the interest rates, the higher the currency exchange rate is. Interest rates depend on the state of the economy and from such indicators as CPI (Consumer Price Index), consumer expenditures, real estate market and employment. Interest rates are set by Central Banks.
- Check American data on reference websites.
Inflation
Inflation – growth of inflation decreases purchasing capacity of money. Central Banks fight inflation by means of increasing interest rates. This way they remove some money from circulation, because it becomes more profitable to invest into financial assets. As soon as some money is invested into financial assets, the purchasing capacity goes down and inflation also goes down. Growth of money supply increases inflation. Inflation in the sphere of services lags behind inflation in the commodity markets by 6-9 months. The higher the inflation, the lower the unemployment level is. Inflation in the US is measured with the help of two indicators – CPI and PPI. We will consider them in more detail in the following section.
- Check American data on reference websites.
Unemployment rate (UNR)
Unemployment rate (UNR) is a leading indicator at the highs of the business activity and lagging indicator at the lows. Each percent of unemployment decreases GDP growth by 2 percent – Okun’s law. The currency exchange rate goes up when the unemployment level goes down and vice versa. It is impossible for any country to reach the zero unemployment level due to seasonality.
- Check American data on reference websites.
GDP
GDP – the stronger the GDP grows, the stronger the national currency is.
- Check American data on reference websites.
The volume of industrial production (IP) grows and the national currency becomes stronger along with export. The business cycle could be tracked by this indicator.
- Check American data on reference websites.
Let’s consider now the key US indicators, which influence the USD exchange rate, in more detail.
Key indicators, which influence the USD exchange rate
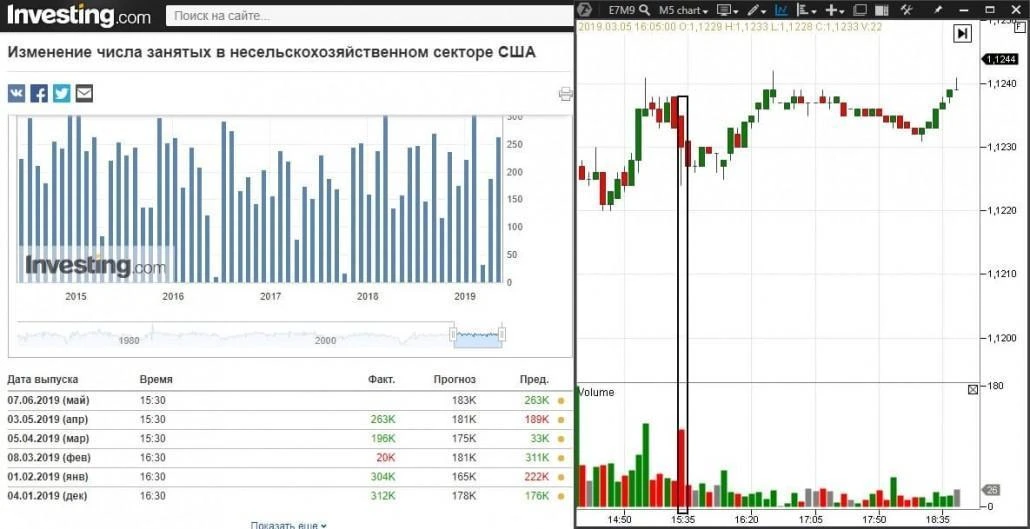
Report on unemployment in the nonfarm sector – Nonfarm Payrolls.
| Published on | The first Friday of each month |
| Influence on the exchange rate | The better the data in comparison to the previous month, the higher the exchange rate is |
| Additional information | This report is important because it is the first during a month and traders use it to forecast further exchange rate development. Employment determines expenditures of the population, since you have no money to spend if you are unemployed |
We marked traders’ reaction to the publication of data on May 3, 2019, with a rectangle in the 5-minute E-mini Euro futures (E7M9) chart below. The data were not just good but much better than the forecasts. The EUR/USD currency pair price jumped down on increased volumes during a short period of time. However, it is rather difficult to see such pronounced reactions nowadays, since political factors and a combination of other economic factors exert influence on currency exchange rates.
A number of permits issued for building purposes – Building Permits.
| Published on | The third week |
| Influence on the exchange rate | The better the data in comparison to the previous month, the higher the exchange rate is |
| Additional information | The most important report in the real estate sphere. The number of permits issued for building purposes grows when the interest rates are low and reduces when the interest rates are high |
Consumer Price Index (CPI) or consumer basket price index.
| Published on | The second week |
| Influence on the exchange rate | The better the data in comparison to the previous month, the higher the exchange rate is |
| Additional information | Direct indicator of the level of inflation; if the indicator grows, inflation grows too |
Producer Price Index (PPI) is the indicator of the wholesale trade of products in the domestic market.
| Published on | The third week |
| Influence on the exchange rate | The better the data in comparison to the previous month, the higher the exchange rate is |
| Additional information | Primary sign of inflation. Peak highs and lows lag behind by 3-6 months from business activity peaks. As a rule, peaks of CPI and PPI indices fall on one and the same quarter |
Use of production capacities (CAPU) is the general output (total productivity). The indicator is closely connected with business cycles and allows forecasting behaviour of Central Banks in difficult moments. Takes big values during recession.
Durable goods orders is the indicator of confidence of a consumer in the future and willingness to spend money on expensive commodities. The growing number of orders stimulates production.
Average Hourly Earnings. Salary increase, which goes ahead of productivity, sends a signal about a possible price increase, which would result in the interest rate increase.
Average Weekly Hours is one of the business cycle indicators. It goes down at the initial stage of the fall, since employers want to keep employees.
Influence of political events on currency exchange rates
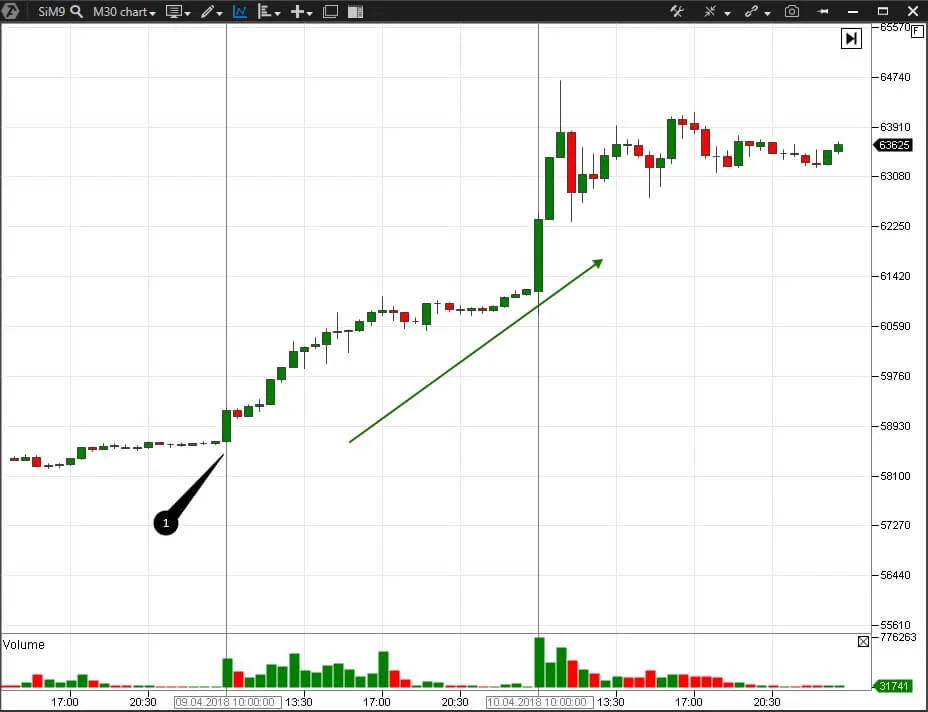
Political events always influenced exchange rates. Donald Trump became the US President in January 2017. He is an active Twitter user and his messages periodically shake up currency and stock markets. The US introduced sanctions against Russian companies on April 6, 2018, and the RUB exchange rate fell sharply. We can see the reaction of traders in the 30-minute USD/RUB futures (SiM9) chart.
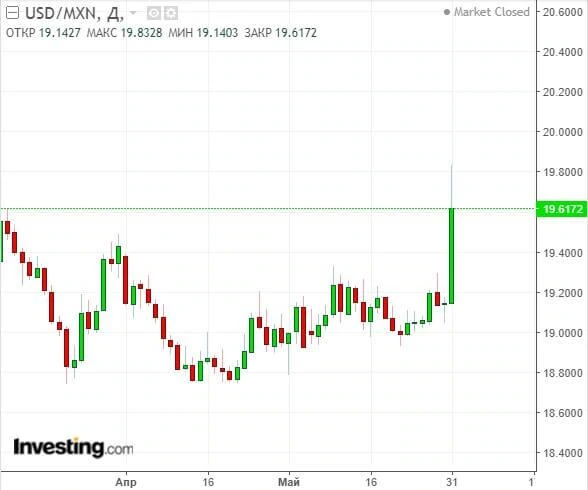
Donald Trump wrote about imposition of tariffs on Mexican goods in his Twitter on May 31, 2019.
Reaction of traders that trade Mexican Peso (MXN) was immediate. USD/MXN rate grew up to the 3-month high.
How to trade on fundamental news
Trading on news is a risky undertaking. Nevertheless, if you want to try this trading approach, here are some important recommendations:
- Identify what takes place at the current price level BEFORE the news broadcast. Check whether there is a focused movement or obvious overweight of sellers or buyers. Maybe the reaction on the news already was taken into account by the market. The news broadcast could significantly move the price if the market is in equilibrium.
- Check whether one of the sides received a reward after the news broadcast for pushing the price. That is whether a big price movement is confirmed by significant volume and delta overweight. If so, the price movement would probably continue.
- Monitor corrections or pullbacks attentively, since the more significant the news is, the smaller the pullback from the movement would be.
- Enter a trade with the limit orders, because the market orders might be executed at an unprofitable price.
- A VSA expert Sebastian Manby states that more than in 50% of cases, the market makes a false movement in the opposite direction half an hour before the news broadcast.
- Use the footprint.
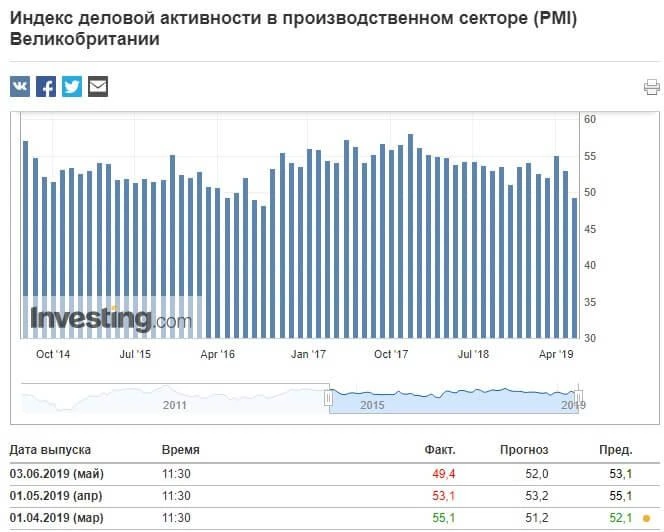
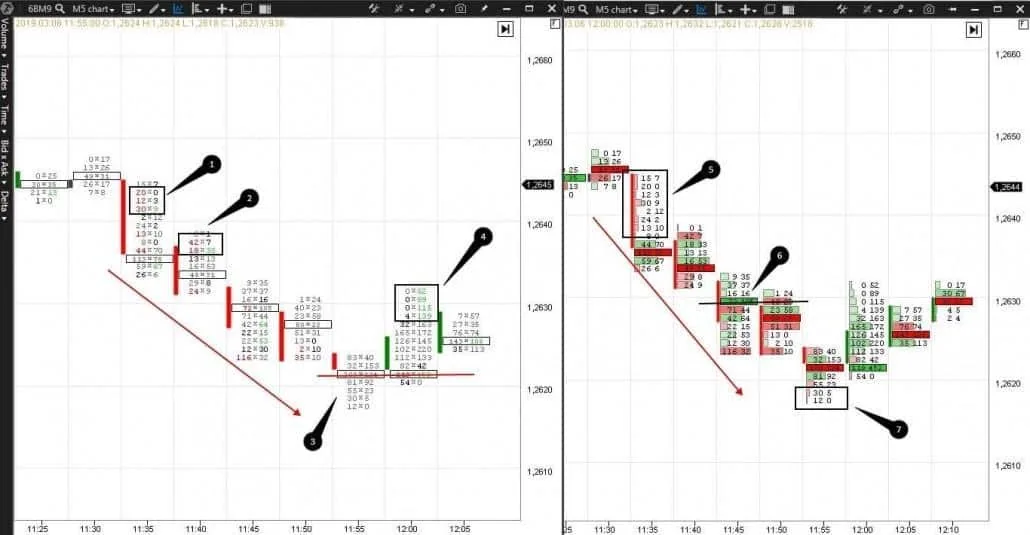
Footprint is displayed in the real-time mode. It helps a trader to understand who does what at each price level. Let’s assess advantages of a footprint in the 5-minute GBP futures (6BM9) chart after broadcast of bad news about PMI in April.
The picture below shows two footprint variants: Bid*Ask Imbalance to the left and Bid*Ask Volume to the right. We show two different footprint variants, because they are visually clear for different types of traders. If you prefer to work with highlighted numbers, the left chart is for you. If you like bars and colors more, the right chart is for you. There are 15 variants of footprint display in ATAS.
We marked multiple imbalances of sellers, which warn traders about further price decrease, with numbers 1 and 2 in the left chart. A short position could be opened here. Maximum volume levels of each 5-minute bar move down – we marked this movement with a red arrow. The price drop stops at the day’s low. Seller imbalances vanish and POC of two neighbouring bars form the support level, marked with a red line. Buyer imbalance emerges under number 4. However, this imbalance raises doubts, since:
- it is located at the very high of the bar, where unlucky buyers usually get stuck;
- the price pulled back from the buyer imbalance and closed below – a green band shows us the exact level of opening and closing;
- imbalance consists not of new positions but of stops – zero values from the bids side.
It is worth waiting for additional confirmation of the price reversal in order to open a long position.
We marked a sharp price fall with number 5 in the right chart – a thin long bar. Such sharp movements, as a rule, do not stop at once, the inertia would continue to push the price further down for some time. Buyers tried to turn the price in point 6, but failed, since the next bar was opened below this level. While POC levels continued to go down. Sells exhaust in point 7.
Footprint shows whether you go with the market or stand on the way of the smart money. It increases confidence in execution of the trading strategy.
Advantages and disadvantages of the fundamental analysis of the currency market
| Advantages | Disadvantages |
| Allows forecasting global changes of the business cycle | Complexity |
| It is good for position traders and long-term investors | A big number of indicators, the influence of which is not evident |
| Volatility increases during the news broadcast and creates opportunities for an intraday trader | Volatility increases during the news broadcast, which is disastrous for beginners |
We complete practically all our articles with the thought that a competitive advantage leads to a profitable trading. A thorough knowledge of the fundamental analysis of a selected currency pair could become your advantage. Or a combination of the cluster and fundamental analysis could become your advantage. Try ATAS free of charge and find out which advantage saves your nerve cells and increases confidence.
Information in this article cannot be perceived as a call for investing or buying/selling of any asset on the exchange. All situations, discussed in the article, are provided with the purpose of getting acquainted with the functionality and advantages of the ATAS platform.

