What Is Stock Yield?
Stock yield is a metric that indicates how effectively a stock has increased its value over a specific period. It includes:- changes in the market price of the stock;
- dividend payments from the stock.
How do you calculate stock yield?
The formula for stock yield appears as follows: Stock Yield = ((Selling Price – Buying Price + Dividends) / Buying Price) × 100% Example. For instance, you purchased shares of XYZ company at $100 per share. After a year, the stock price rose to $120, and within the year, you received dividends totaling $10 per share. To determine the stock yield, you need to make the following calculation: Yield = ((120 – 100 + 10) / 100) × 100% = 30%What is dividend yield?
Dividend yield represents the ratio of the annual dividend to the current market price of a stock. This metric holds particular significance for investors seeking a steady income through dividends. The formula for dividend yield (DY) is as follows: DY = (Annual Dividends / Stock Price) × 100% For instance, if a stock costs $50 and yields annual dividends of $5, the dividend yield would be: DY = (5 / 50) × 100% = 10% This means that investors receive a 10% annual return in dividends relative to the current stock price.Types of Stock Yield
Required stock yield reflects the minimum acceptable profit percentage that investors anticipate from investing in a particular stock. It is influenced by the level of risk associated with the stock and the overall market conditions. Normal stock yield refers to the average level of yield that is typically expected from stocks in a specific industry or sector. This concept helps investors compare the yield of specific stocks with commonly accepted standards. Market stock yield also serves as an indicator of the average yield of all stocks in the market or within a particular segment. It acts as a benchmark for evaluating the effectiveness of individual investments relative to the overall market. The difference between normal and market yield:- normal stock yield is a more theoretical concept, optimal for analyzing historical data and making forecasts.
- market yield is more frequently used to assess the yield of a specific stock at the present moment.
Indicators of Stock Yield
When assessing portfolio efficiency and selecting stocks, investors use the following indicators:- EPS (Earnings Per Share)
- P/E Ratio (Price-to-Earnings Ratio)
- ROE (Return on Equity)
- Dividend Yield
EPS (Earnings Per Share)
EPS is one of the key financial indicators. It is used to evaluate a company’s profitability on a per-share basis. This ratio indicates how much of the company’s earnings are attributable to each common share. EPS is calculated using the formula: EPS = (Net Income – Preferred Dividends) / Weighted Average Number of Common Shares For example, if:- the net income of the company is $1 million,
- preferred dividends amount to $200,000,
- and the number of common shares outstanding is 400,000,
- Compare it with previous periods. Consistent annual EPS growth often signals increased company profitability, which investors generally view favorably.
- Compare it with industry averages. A company with EPS surpassing the industry average may indicate its competitive edge over others.
- Examine the sources of EPS growth. If EPS growth stems from one-off events like asset sales and does not reflect improved operational efficiency, it may be a less positive signal than sustainable growth from increased sales or improved margins.
P/E Ratio (Price-to-Earnings Ratio)
The Price-to-Earnings ratio shows how much investors are willing to pay for each dollar of a company’s earnings. It is calculated as the ratio of the current market price per share to the EPS. Example. Suppose a company’s stock is trading at $50 per share, and its EPS for the last year was $5. In this case, the P/E Ratio is calculated as: P/E Ratio = (Stock Price / EPS) = 50 / 5 = 10.- A low P/E Ratio (less than 10) may indicate that the stock is undervalued or that the company is facing certain difficulties.
- P/E Ratio values between 10 and 20 are often considered as “normal” or “fair” valuation levels for many industries, especially in a stable economic environment.
- A high P/E Ratio (above 20) may indicate that the stock is overvalued or that investors expect high earnings growth rates in the future. Technology company stocks often trade with high P/E ratios due to investors’ expectations regarding their growth.
Tools for Working with High-Yield Stocks
When choosing high-yield stocks, investors should use effective tools and strategies. We will explore three such tools:- high-yield stock scanners;
- high-yield ETFs;
- dividend indices.
High-yield stock scanners
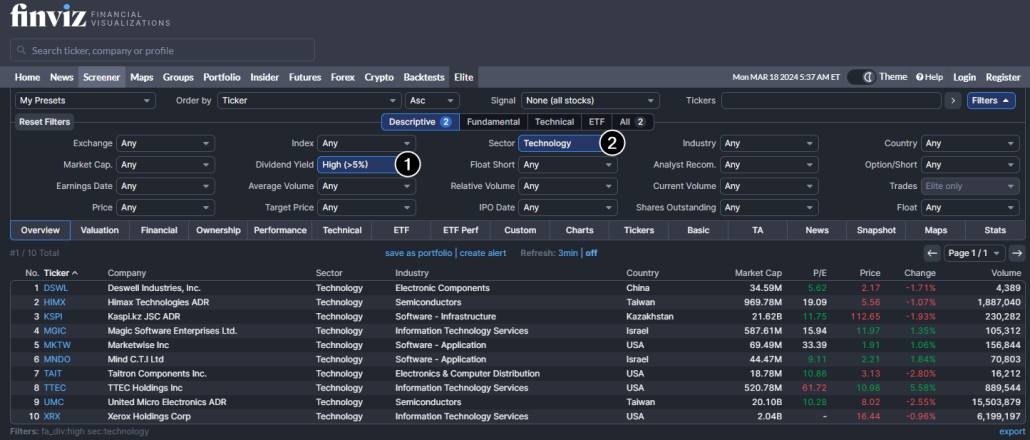
High-yield stock scanners are specialized tools that enable users to filter stocks based on various parameters, including dividend yield, dividend growth, industry affiliation, and other financial metrics. Well-known scanners include Finviz, Morningstar, and Yahoo! Finance. Finance.
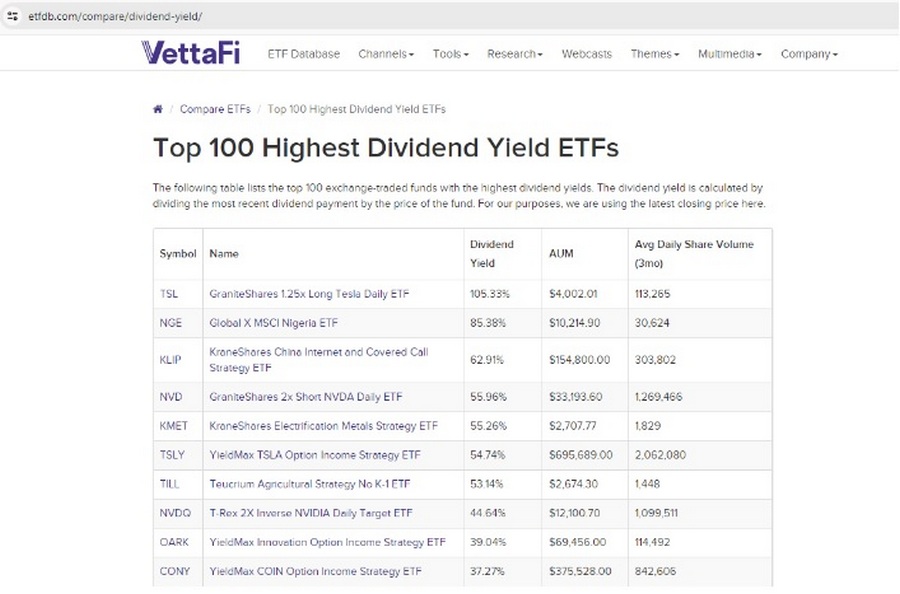
The screenshot above displays a list of ETFs that investors can use to search for high-yield assets.
Dividend indices
Dividend indices, like the S&P 500 Dividend Aristocrats, represent a list of companies that not only pay dividends consistently but also raise them over time. These indices serve as a benchmark of success for high-yield stocks and can guide investors when selecting stocks to add to their portfolios.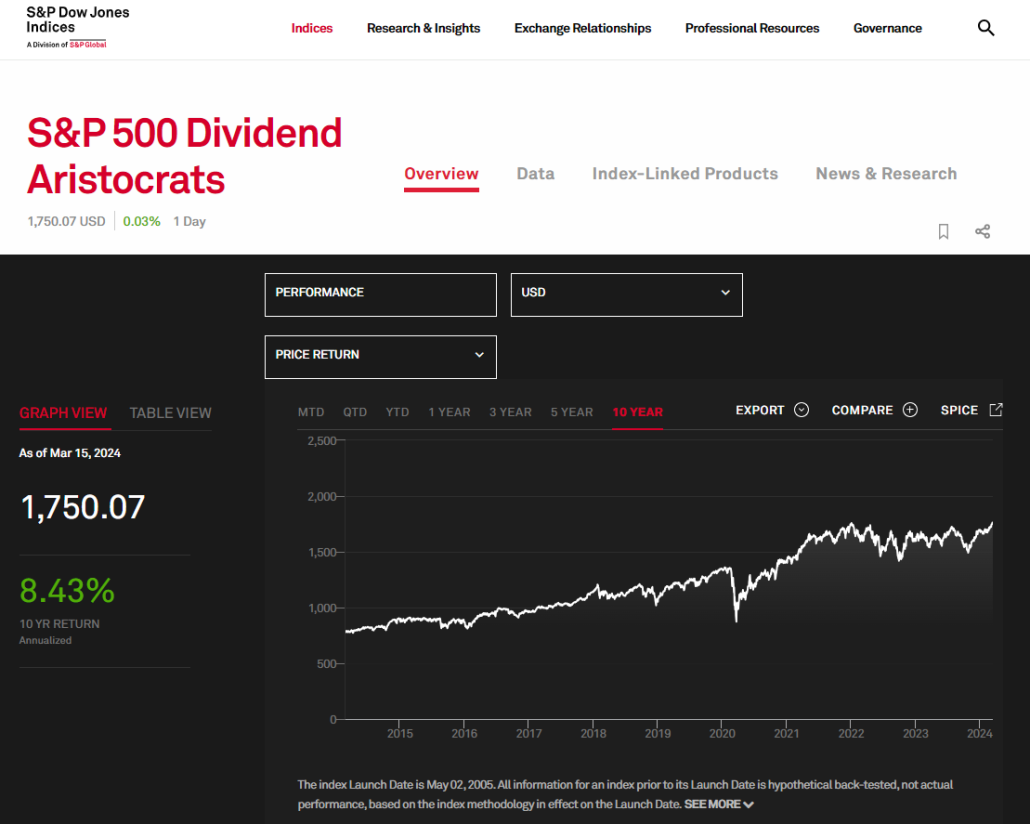
For instance, if a stock is included in the S&P 500 Dividend Aristocrats, it indicates that the company is not only a member of the S&P 500 index but has also been consistently increasing its dividends. Investors seeking stability and dividend growth can use these indices as a starting point for further exploration into stock yield.
Choosing the Right Time to Buy Stocks
Considering that the formula for calculating stock yield incorporates not only dividend levels but also the difference between purchase and sale prices, choosing the right moment to buy is a crucial factor that will substantially impact the assessment of investment efficiency. Tools for volume analysis from the ATAS platform can assist you in determining the optimal purchasing level. Example. The screenshot below shows the price chart of Verizon Communications (VZ) stock, known for generating substantial and consistent income while frequently paying high dividends.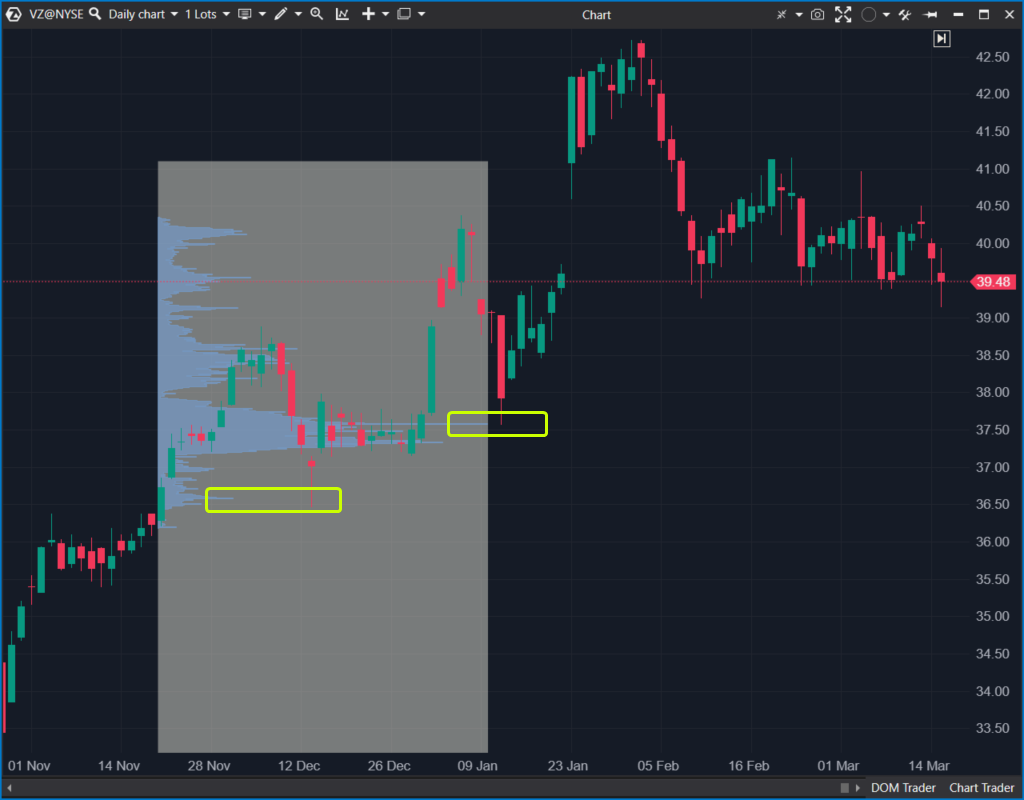
The market profile drawing tool has been used to find an entry point for a long position. It helps pinpoint levels of significant volume, the test of these levels (highlighted in yellow) presents an attractive opportunity to buy the stock, anticipating that the price of VZ will increase and dividends will be paid.
Pros and Cons of Investing in High-Yield Stocks
The desire to invest in high-yield stocks (by purchasing shares of companies that pay stable and high dividends) may be appealing to a certain type of investor. However, like any investment decision, it has its pros and cons. Pros:- Consistent income. Dividend payments can provide a reliable source of income, especially during times of economic uncertainty or for retired investors.
- Lower volatility. Stocks that regularly pay dividends tend to be less volatile compared to speculative growth stocks, thus offering more stable and predictable investments.
- Enhanced inflation protection, i.e. dividend-paying stocks often have the potential to increase dividend payouts over time.
- An opportunity for dividend reinvestment, which can accelerate capital growth over time.
- Missed opportunities. Investing primarily in high-yield stocks may result in missed opportunities, as investors might overlook the high growth potential offered by stocks of new technology companies or other rapidly expanding sectors.
- Limited growth potential – it is often evident when compared to growth stocks which are leaders in rallies but do not pay dividends.
- Tax consequences. The higher the dividend tax rates, the lower the real return on the stock.
- Risk of a dividend cut. If a company’s financial health deteriorates, it may reduce or even eliminate dividend payments, which will have a negative impact on stock returns.
FAQ
What does stock yield mean? Stock yield refers to the total return (or lack thereof) an investor gains from owning stocks. What does stock yield show? Stock yield demonstrates how effectively funds have been invested. It is measured in percentages and considers both the profit (or loss) from changes in stock price and the dividends received. How to calculate the dividend yield of a stock in percentage? Dividend Yield = (Stock Price / Annual Dividends per Share) × 100%. For example, if a stock price is $100 and the annual dividends are $5 per share, the dividend yield will be = (5 / 100) × 100% = 5%. What is considered a good yield? There is no one-size-fits-all answer. The percentage considered a good yield can vary significantly depending on market conditions, asset types, and the investor’s personal preferences. Generally, a “good” yield should exceed inflation and the average yield of similar investments. What is the dividend capture strategy? Dividend capture is a practice in which investors purchase stocks shortly before the ex-dividend date to qualify for dividends, and then sell the stocks after the dividend record date. The goal of this strategy is to receive dividends from stocks without holding them for the long term. However, it is important to note that the stock price often drops after the ex-dividend date – these and other risks should be carefully assessed before implementing the dividend capture strategy.Conclusions
The article thoroughly explains how to determine stock yield and how to consider it when investing. It offers valuable insights into evaluating the effectiveness of investing in dividend-paying company stocks. It is important to note that the yield of stocks in an investor’s portfolio primarily depends on their purchase price, so it is crucial to:- analyze the overall stock market and trends in stock indices;
- carefully select not only stocks but also the entry point into the investment position.
Information in this article cannot be perceived as a call for investing or buying/selling of any asset on the exchange. All situations, discussed in the article, are provided with the purpose of getting acquainted with the functionality and advantages of the ATAS platform.


