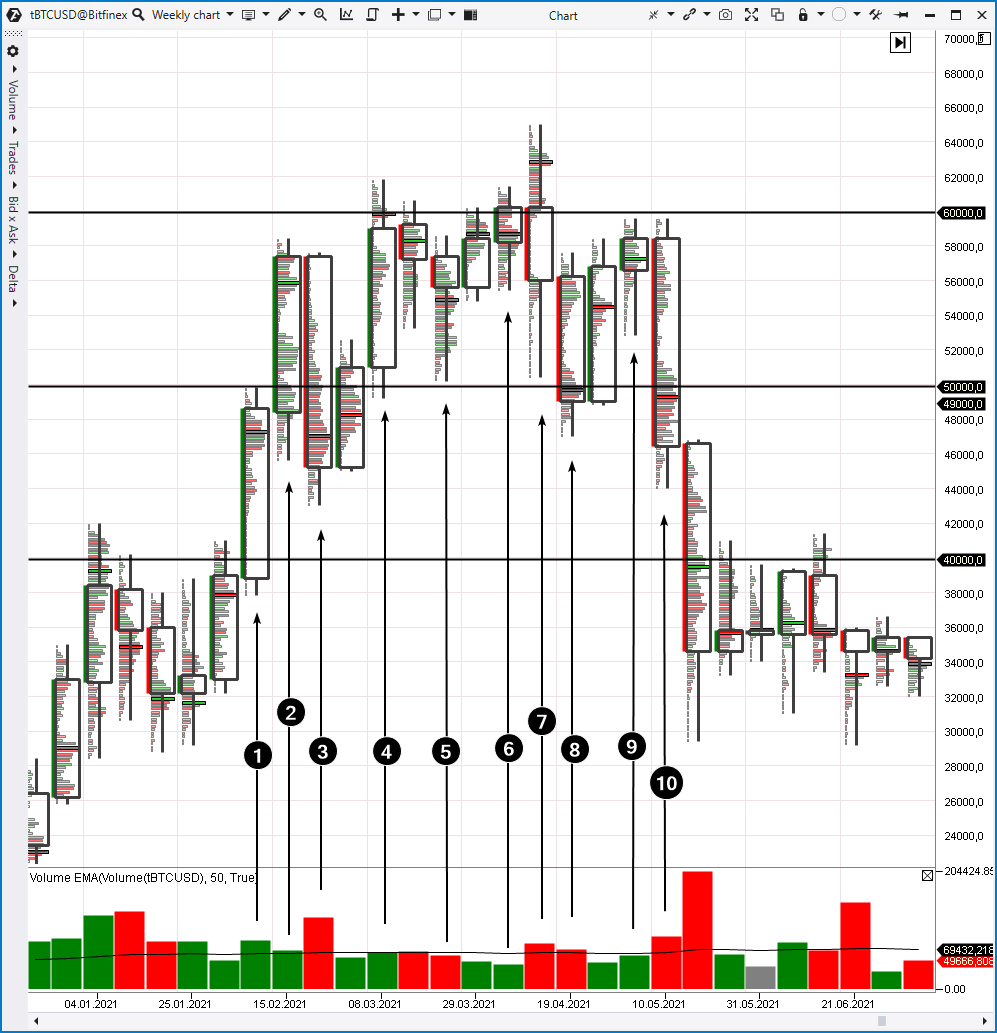
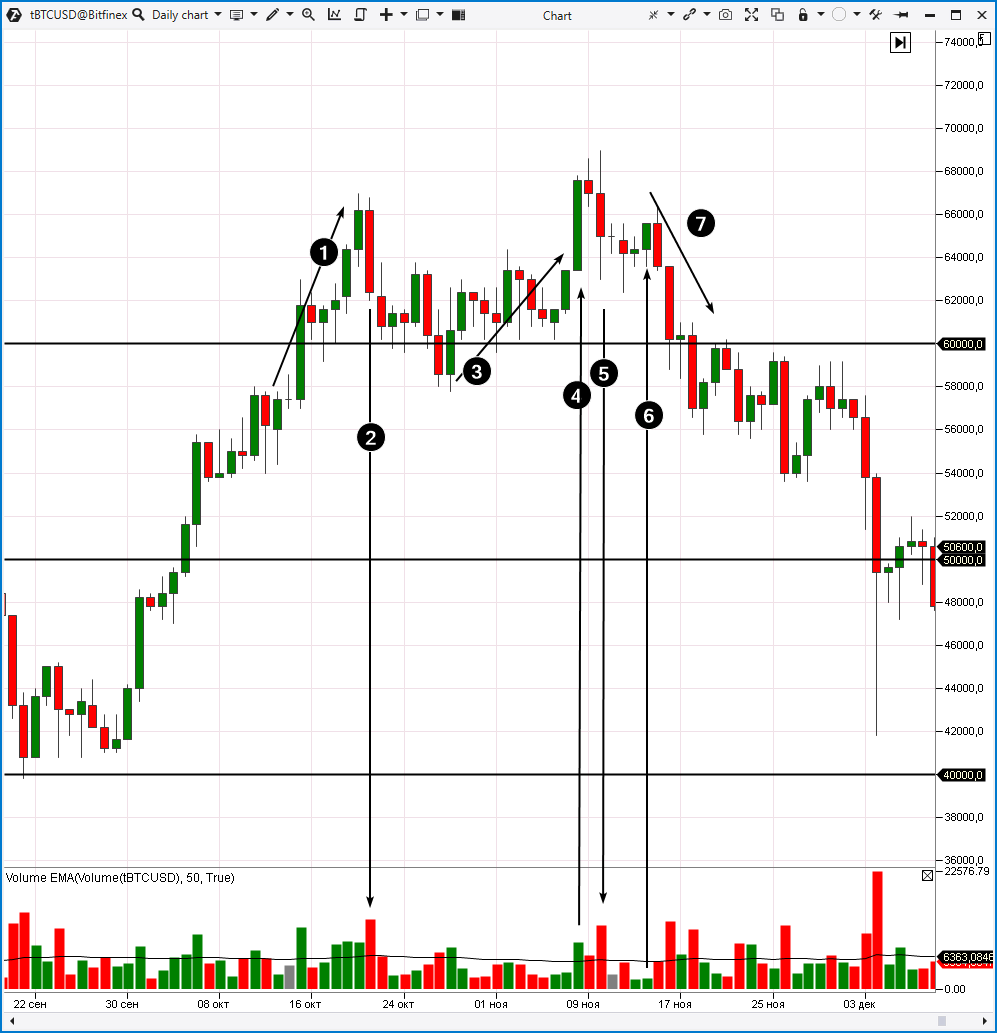
Let’s have a look at this situation step by step and start with candle number 1. It points at a candle where the market broke out above the psychological level of $40,000 per bitcoin after five weeks of fluctuations. At the same time, thin clusters inside the candle indicate a real stir in the market – the price grew very quickly without stopping. The thickening of the profile at the top of the candle indicates that a balance between buyers and sellers was formed as the price was getting closer to the $50,000 psychological mark. Apparently, market participants decided to fix profits from long positions.
Candle number 2 indicates the continuation of the bullish dynamics. Note that there are a lot of green clusters inside this candle. It looks like the market went into FOMO (fear of missing out on a profitable opportunity) after rapid growth on candle number 1. During this period of time, the headlines were full of the thesis that after breaking through the $50,000 level, Bitcoin was ready to reach a six-figure mark. The market was overheated and reached a climax.
Candle number 3 indicates a sharp change in sentiment which usually follows the peak of the stir. This candle is radically different from what happened before. It has the biggest bearish dynamics since the beginning of 2021. It completely absorbed the growth progress made on candle number 2. A bearish reversal pattern on very high volume (twice the average) is a powerful signal that the previous rally may soon end.
Candle number 4 indicates an attempt to resume the rally. Taking candle number 3 into consideration, we can predict that this attempt is unlikely to be successful. Despite the wide body of candle number 4, there are two signs that demand is weakening:
- a decrease in volumes (they are at the average level);
- the price is not able to consolidate above the 60,000 psychological mark (clusters show a lot of activity around 60,000, but the closing happens below this cluster of high volume).
Candle number 5 has a long lower tail with a large number of clusters. Therefore, we can conclude that the balance of supply and demand is pushing the price up from the $50,000 support level. It is followed by another attempt to attack the $60,000 level.
Look at the volume on candle number 6. Volumes are at a very low level, it is the lowest rate in many weeks. Apparently, it indicates low demand – market participants are in no hurry to chase the price and buy up bitcoins offered by sellers.
Bearish candle number 7 has a big difference between high and low. It means that a lot of things happened and the market was very volatile. High volatility is precisely the condition under which large market participants have the opportunity to expand their positions. In this case, we can assume that they were selling the rest of the longs to those buyers who believed that the price would rise above $62k. Pay attention to the density around $62k – these are the “lucky ones” who could no longer tolerate the price increase and decided to buy at the very top.
We see a bright red cluster below the $50k level on candle number 8. These market sells can be described as mass liquidation of buyers’ positions. These are not the sells that are able to push the price lower. So we see another attempt to reach $60k (again on low volume) on the next candle.
Candle number 9 shows the temporary balance. Perhaps the price of Bitcoin was growing amid the growth of other cryptocurrencies. In those days, Ethereum and altcoins were setting new records, and the price of Bitcoin was just uncertainly following the leaders.
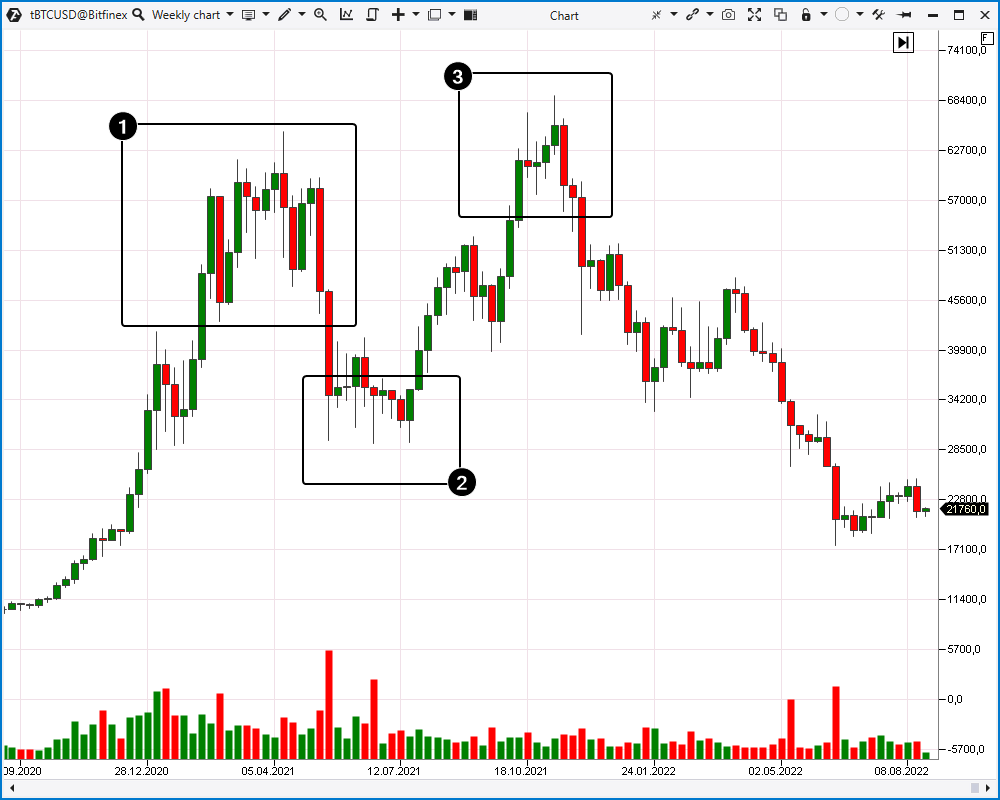
If we put the information obtained from the candle analysis into a single history, we will understand that after the breakout of $50k, the market entered the stage of euphoria which gradually subsided. Volumes on upward impulses were decreasing, and attempts to overcome the $60k level turned out to be a failure. In a nutshell, this situation can be described like this: “there are no buyers already, but there are no sellers yet.”
The balance formed on candle number 9 shifted down sharply on candle number 10. Notice thin clusters between $52k and $54k. The price was falling down without any support. Bright clusters in the $48k-$50k area are sellers’ activity that was breaking through all the support levels on its way. The price was falling lower and lower amid buyers’ weakness. The liquidation of buyers’ stop-losses accelerated the fall even more.

