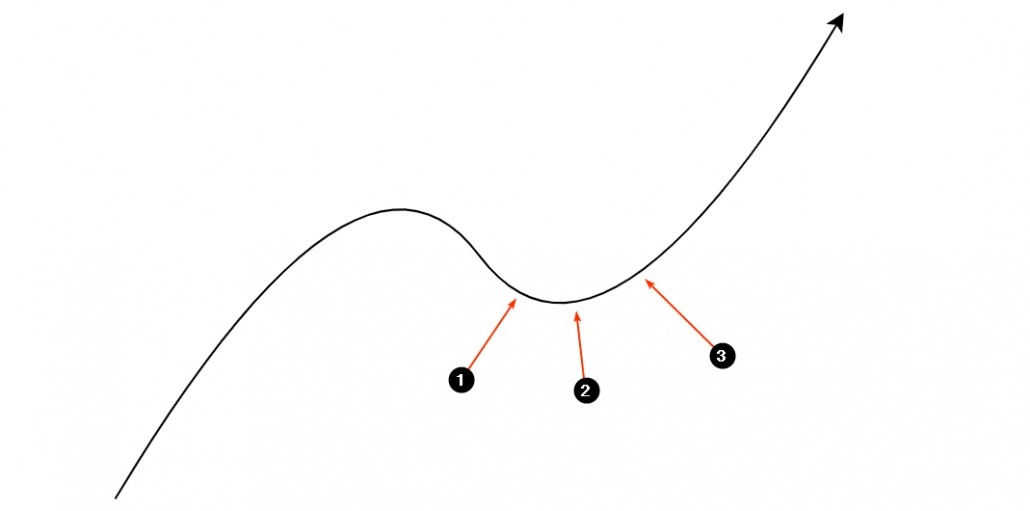
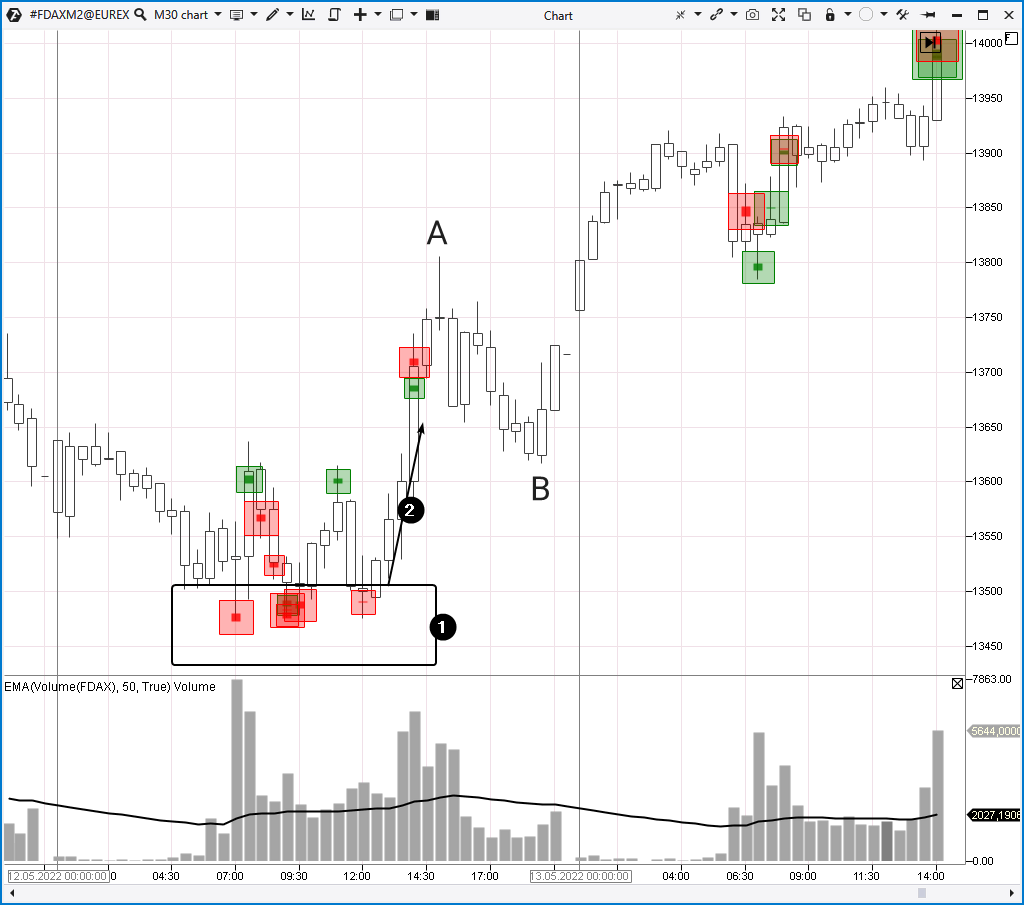
Number 1 indicates big sales that took place just below the 13,500 level. However, the price refused to decline any further even though large sell orders had been executed. It was likely to happen because large market sells were actually stop-losses set above the 13,500 level. They are not capable of moving the price lower. We believe that they are used by professionals to accumulate a large long position at the lowest prices.
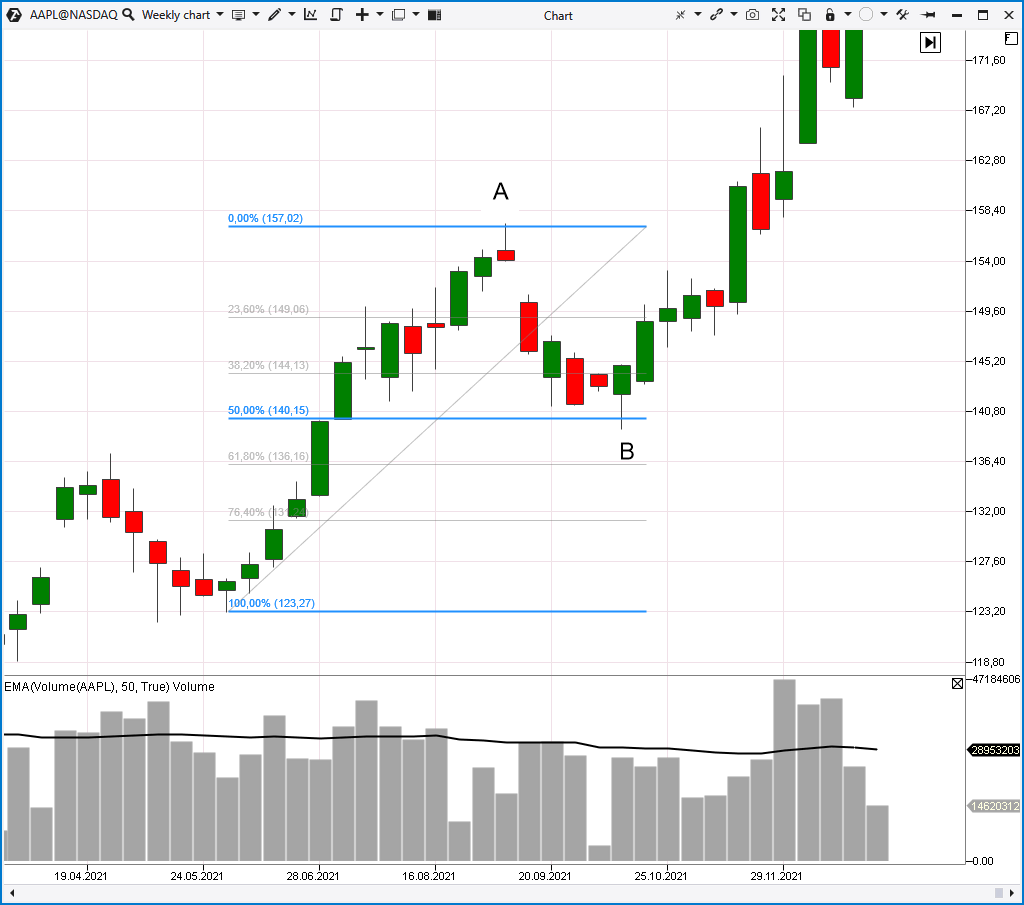
The zone marked with number 1 served as a basis for the impulse price growth (2). Note that the growth towards point A was accompanied by volume spikes. This is natural since the price was overcoming local resistance levels.
А→В decrease is a correction itself. Small volumes can be explained by the fact that the correction took place during an additional trading session. But even so, the activity was still low.
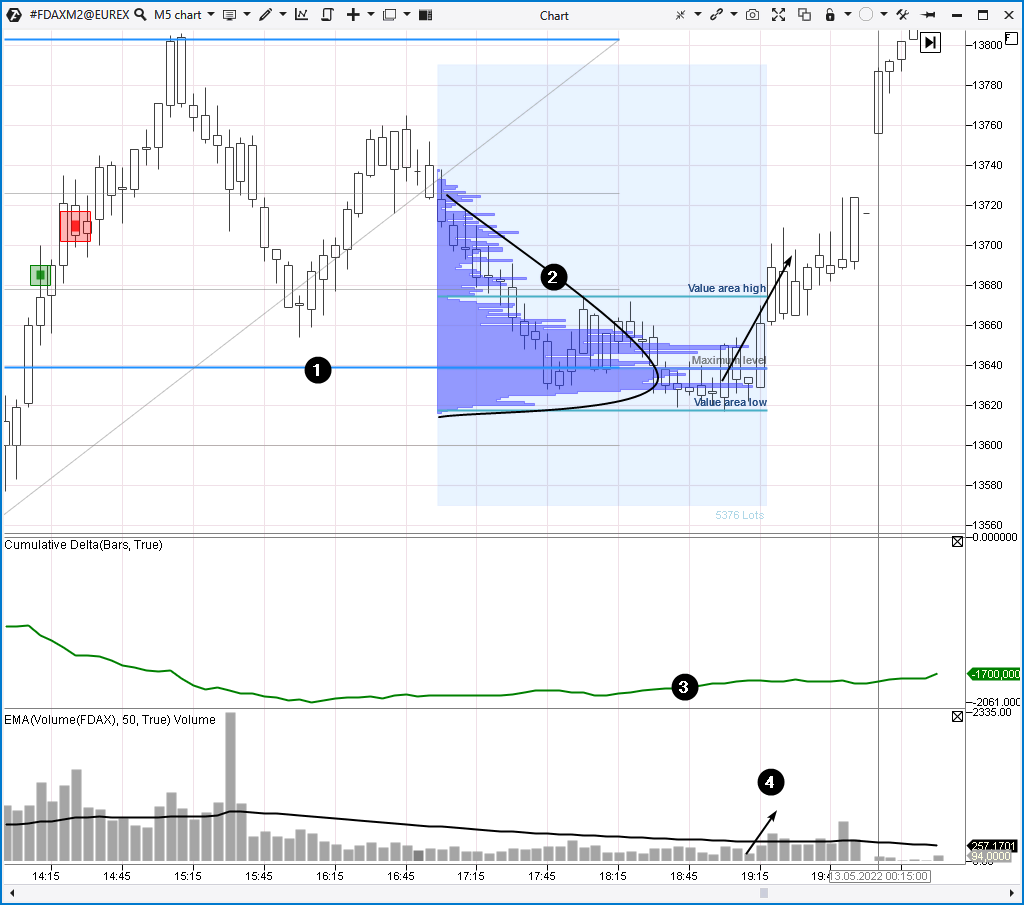
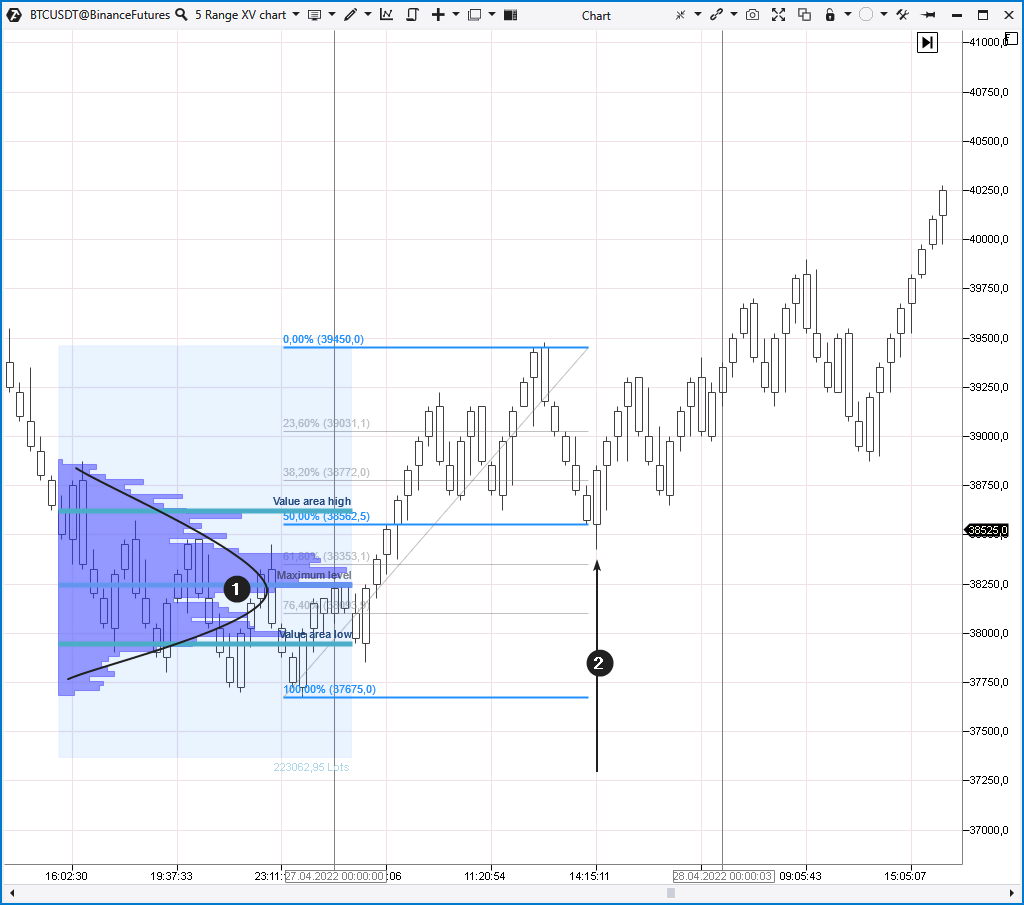
The Fibonacci levels worked out close to the gold standard in this example, the correction low is just below the 50% level.
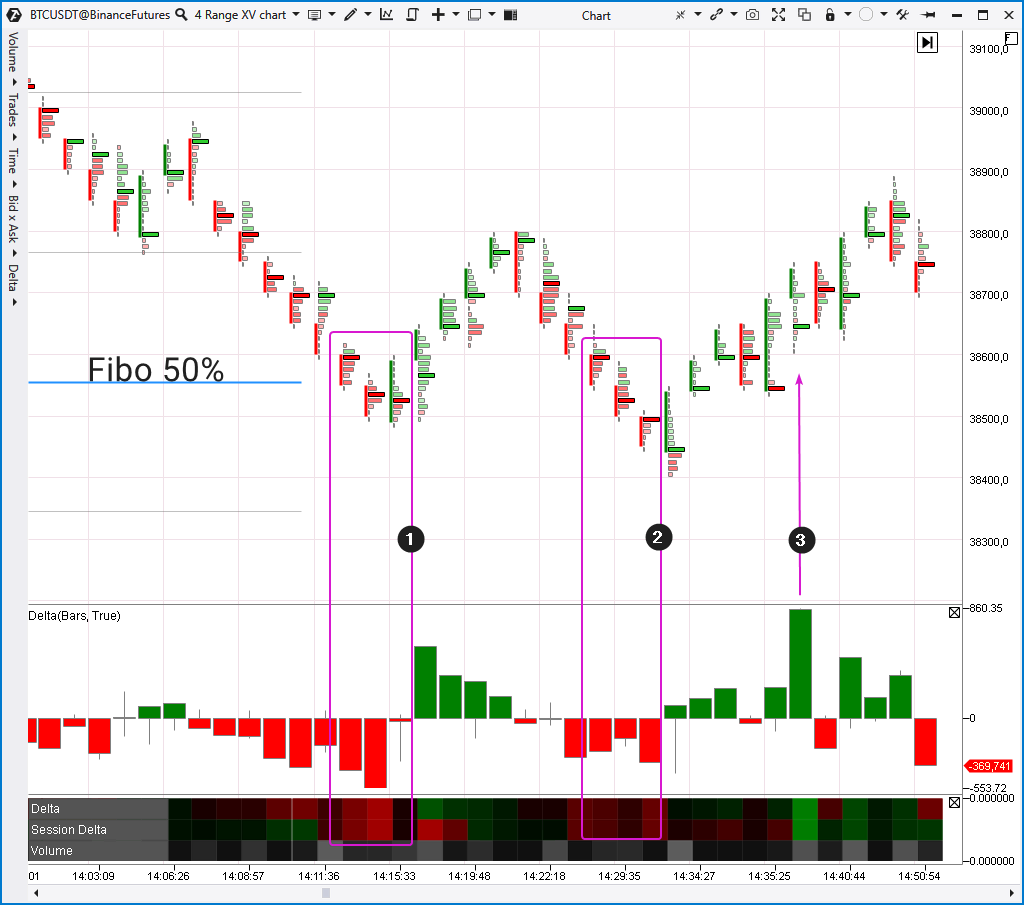
Let’s switch to a faster time frame to see the end of the correction better.