What Is Volatility?
The word “volatility” comes from the Latin “volātilis” (meaning flying, quick, temporary, changeable). In the context of financial markets, volatility refers to the ability of a financial asset’s price (such as stocks, futures, or cryptocurrencies) to fluctuate. Different assets have varying levels of volatility due to their risk levels and market dynamics. For example, Bitcoin is known for being highly volatile, with daily price swings typically ranging from 3% to 5%. In contrast, 10-year U.S. government bonds are considered low-volatility assets, with daily price changes usually around 0.2% to 0.5%. Read more:Key Takeaways
- Volatility in trading is a statistical measure of a financial asset’s price fluctuations and can serve as an indicator of market risk.
- It is a fundamental part of trading and is not always negative.
- High volatility is a condition that can present opportunities for short-term gains, but it also raises the risk of losses.
- There are two main types: historical volatility, based on past price movements, and implied volatility, which predicts future fluctuations using option prices.
- The VIX index (often called the “fear index”) is a key measure of implied volatility for the stock market over the next 30 days.
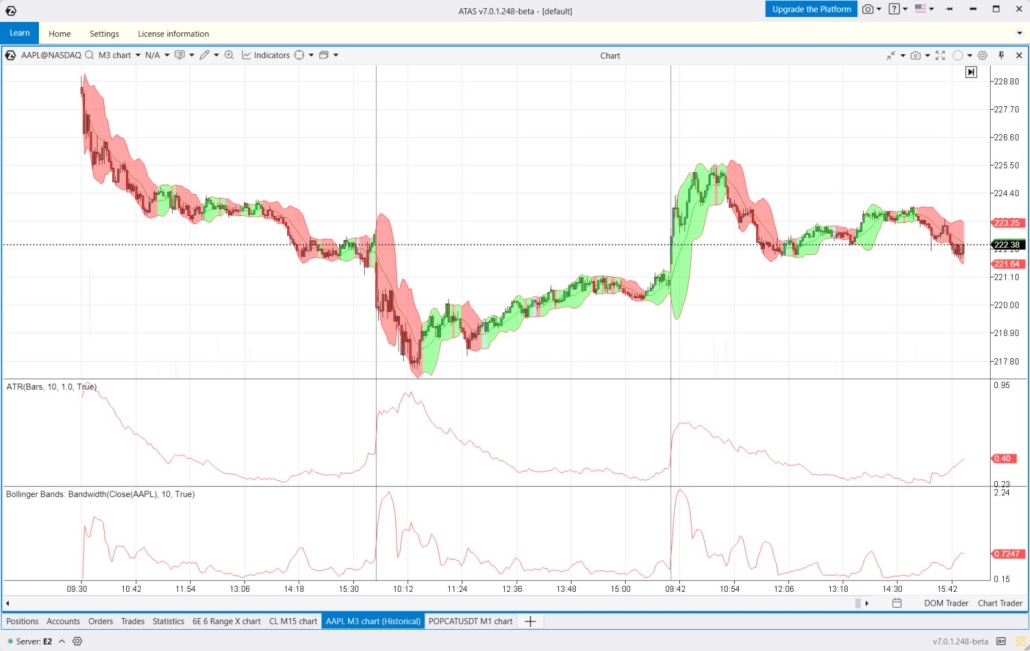
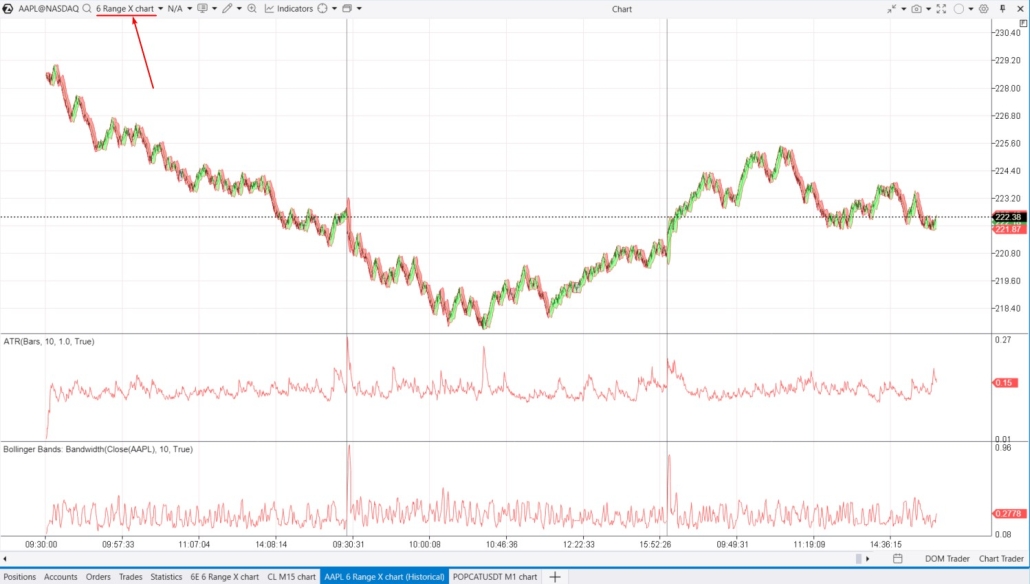
- Indicators like Bollinger Bands and ATR are also used to assess the magnitude of price swings.
Understanding Volatility
Volatility in the non-financial world describes a tendency to fast and unpredictable changes. This definition is approximately the same in application to financial markets – it is just a bit more technical. Market volatility is a statistical measure of the asset price deviation from the established standard or own average indicators. It means a measure of how big a sudden fluctuation or strong change of a stock or another asset price is. In simple words, market volatility is a frequency and range of the price up or down movement. The stronger and more frequent prices fluctuate, the more volatile the market is. Example. The picture below shows a daily chart of the British pound futures contract prices as of August 2021. If we speak about the currency rate volatility, the most volatile were August 16, 18 and 22 (these days are marked with arrows).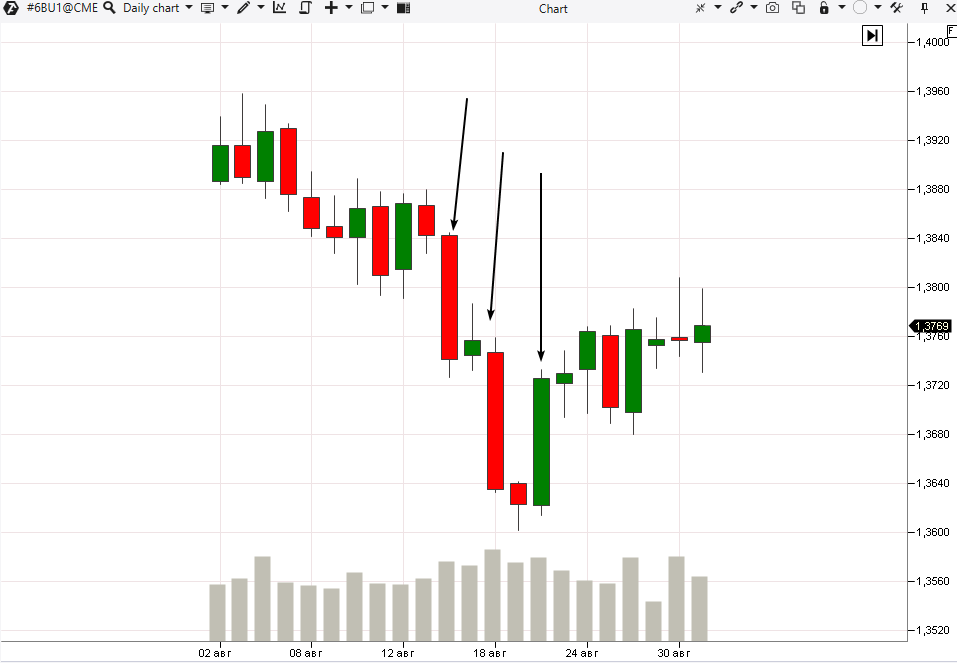
- low volatility is connected with security and predictability of results;
- high volatility points to a danger and negative consequences.
If you ride a bicycle, a safe journey is never guaranteed.
Sudden minor fluctuations are an integral part of a bicycle ride and, usually, they pass unnoticed. However, if you suddenly turn around to bypass an obstacle, it will become more difficult to adjust your route, which will increase the probability of losing your balance, falling and hurting yourself.
Some routes have less turns than others. Any specific route risk assessment and preparation of the scheme of its most dangerous turns is how investors assess and measure volatility.
And, which is even more important, understanding volatility can help you in making decisions on when, where and how to invest.
How to Calculate Volatility
Market volatility is measured by means of identifying the price change standard deviation for a certain period of time. The statistical concept of standard deviation allows seeing how something differs from an average value.
We will show you how to identify volatility through an example.
Task. To calculate volatility of XYZ stock for the past four days. The stock prices are shown below:
Day 1 – USD 10.
Day 2 – USD 12.
Day 3 – USD 9.
Day 4 – USD 14.
The volatility calculation formula will become clear from the following solution.
In order to calculate the price volatility, we need to take 6 simple steps.
Step 1. Calculate an average price:
USD 10 + USD 12 + USD 9 + USD 14 / 4 = USD 11.25
Step 2. Calculate the difference between each price and average price:
Day 1: 10 – 11.25 = -1.25
Day 2: 12 – 11.25 = 0.75
Day 3: 9 – 11.25 = -2.25
Day 4: 14 – 11.25 = 2.75
Step 3. Raise each difference from the previous step to the square:
Day 1: (-1.25) squared = 1.56
Day 2: (0.75) squared = 0.56
Day 3: (-2.25) squared = 5.06
Day 4: (2.75) squared = 7.56
Step 4. Sum up squared differences:
1.56 + 0.56 + 5.06 + 7.56 = 14.75
Step 5. Calculate dispersion:
Dispersion = 14.75 / 4 = 3.69
Step 6. Calculate standard deviation:
Standard deviation = the square root of 3.69 = 1.92
Standard deviation shows that the ABC Corp. stock price usually deviates from the average stock price by USD 1.92. This is the solution to the task.
Standard deviations are important because they do not only tell you how much a value can change, but they also provide the ground for a probability of its occurrence. Values will be within one standard deviation from an average one in 68% of cases, within two in 95% of cases and within three in 99.7% of cases.
Traders calculate standard deviations of market values based on trading values at the end of the day and intraday volatility or forecasted future value changes during a trading session. Outside market observers, perhaps, are better acquainted with the last method, which is used by the Chicago Board Options Exchange volatility index that is usually called VIX.
Volatility and Stocks
Most of the time, the stock market is rather calm and the periods of high stock volatility are short.
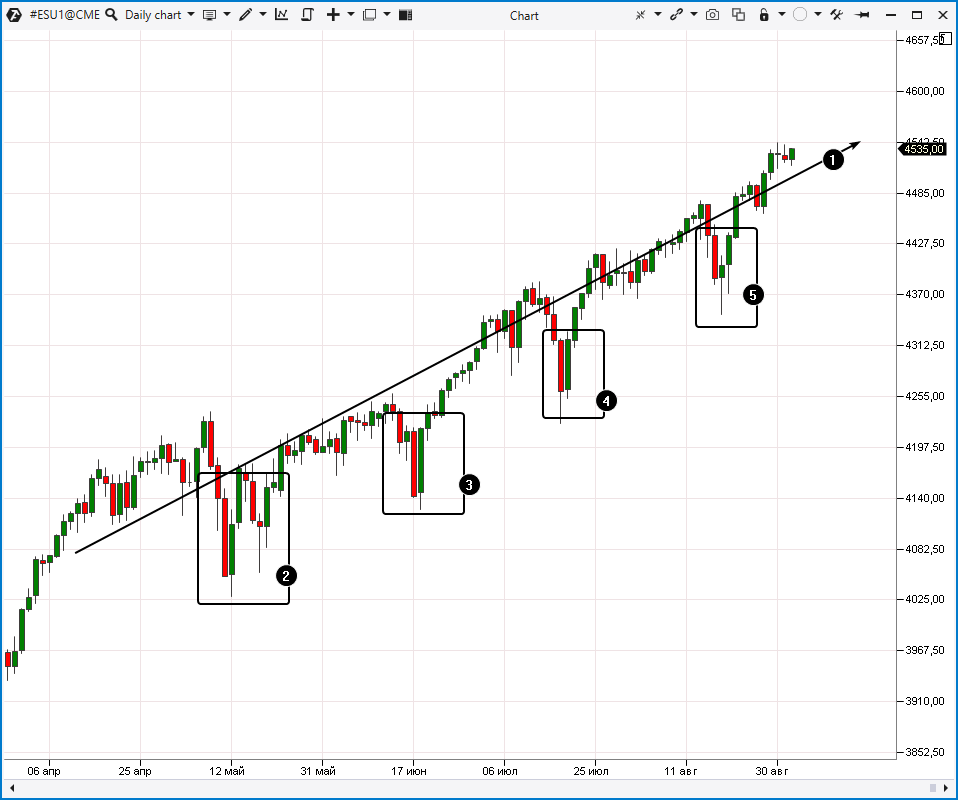
In general, up movements are usually connected with low volatility (1) and down movements are usually accompanied by unpredictable price fluctuations (2, 3, 4 and 5) as it is shown in the ES futures chart below.
It should be expected approximately once in five years that the market will fall by about 30% which is, roughly speaking, an average performance.
Besides, implied volatility for an average stock is about 15%. That is why, be careful if you see an asset with IV more than 20%.
Moreover, there is always a probability of extreme splashes of volatility like the stock market fall in 1987 when the Dow Jones Industrial Index fell by 22.6% during one day.
There are a big number of ways to respond to a sharp change of your portfolio value. However, one thing can be stated for sure: experts do not recommend panic selling after a strong market fall.
According to the Schwab Center for Financial Research analysts, during the periods starting from 1970, when stocks fell by 20% and more, they brought the biggest profit during the first 12 months of recovery.
Types of volatility
There are two types of market volatility: Historical volatility, which allows making observations by looking back. Implied volatility, which allows making forecasts by looking forward.Historical Volatility
Historical Volatility (HV), as the term suggests, deals with the past. It is identified by observations of the past time period asset price values and it shows how strongly its price has deviated from its average value. If historical volatility grows, it is a reason for concern, since it can point to a fact that something has happened to an asset or will happen in the nearest time. In case it moves down, it means that the situation comes back to a regular state and is stabilized.Implied Volatility
Implied Volatility (IV) deals with the future and is more complex. It is a forecast of the future asset activity based on the prices of its options (what options are). 5 indicators are taken for calculating implied volatility: the option market price, underlying asset price (spot price), strike price, time to maturity and risk-free interest rate. The Black-Sholes formula is used for calculating implied volatility: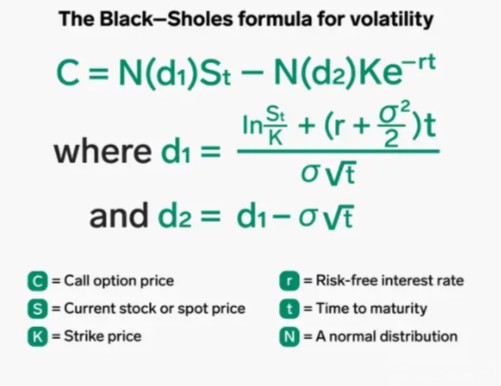
Volatility and Options Pricing
Volatility directly affects option prices by reflecting the uncertainty around future price movements of the underlying asset. This influence comes through implied volatility, which reflects how likely it is that an option will be profitable, or “in the money.” When volatility increases: A rise in implied volatility leads to higher option premiums. This happens because higher volatility increases the chances that the price of the underlying asset will move enough to make the option profitable, or “in the money,” for both types of options:- The price of a call option increases as volatility rises since there is a greater chance that the underlying asset’s price will exceed the strike price.
- Similarly, the price of a put option also rises with increased volatility because there is a greater chance the asset’s price will drop below the strike price.
Other Measures of Volatility
The main methods for measuring volatility include:- Standard Deviation. This method is used to assess historical volatility. An example of calculating standard deviation was provided earlier. Standard deviations are widely used in volatility indicators such as Bollinger Bands.
- Option Prices. A method to assess implied volatility for future periods.
- Beta – a coefficient that measures an asset’s (e.g., a stock’s) volatility or systematic risk relative to the overall market or a specific market index.
- VIX Volatility Index known as the “fear index.”
Beta
Beta (β) measures how much an asset’s price changes relative to the market’s movements. For example, Beta is used to assess the volatility of a stock compared to the S&P 500 index. This coefficient helps evaluate an asset’s risk level compared to the overall market risk:- β = 1: The asset moves in line with the market.
- β > 1: The asset is more volatile than the market. For instance, a Beta of 1.5 means that if the market rises by 1%, the asset’s price is expected to rise by 1.5%.
- β < 1: The asset is less volatile than the market. For example, stocks with a lower Beta are more stable during market fluctuations, making them attractive to conservative investors.
- β < 0: The asset moves in the opposite direction to the market. For instance, the price of gold might drop when stocks rise, which can happen if investors are optimistic about the economy and prefer to invest in companies rather than in safe-haven assets.
The VIX
VIX is the most well-known indicator of stock market volatility. This index, developed by the Chicago Board Options Exchange (CBOE), is usually called the ‘fear gauge’ of the stock market because it represents a snapshot of the market forecasts with respect to volatility for the next 30 days (which are recalculated later on an annual basis to get a set of forecasts for the next 12 months). For this purpose, VIX ‘collects’ PUT and CALL option prices for the value of the S&P 500 index, which is often used for presentation of the market as a whole. After that, these numbers are weighed, averaged and passed through the formula, which shows how confident investors are. In simple words, VIX shows how strong traders expect that the S&P 500 price will move up or down the next month. Thus, VIX is a well-reasoned indicator of stock volatility. As a rule, the higher the VIX, the more expensive options are. Why? Because the options, which are called PUT, represent agreements for traders on selling an underlying asset, S&P 500 in this case, at a certain price after a certain period of time. These PUT options become more desirable (and more expensive) with an increase of a probability that the S&P 500 price will drop. If the S&P 500 price drops below the selling prices of their PUT options, they will make a profit. Thus, the growing value of these PUT options becomes an indicator of expected market falls and, as a consequence, volatility. Historically, standard VIX levels are within the range of up to 20, which means that the S&P 500 index will differ from its average growth rates for not more than 20% most of the time.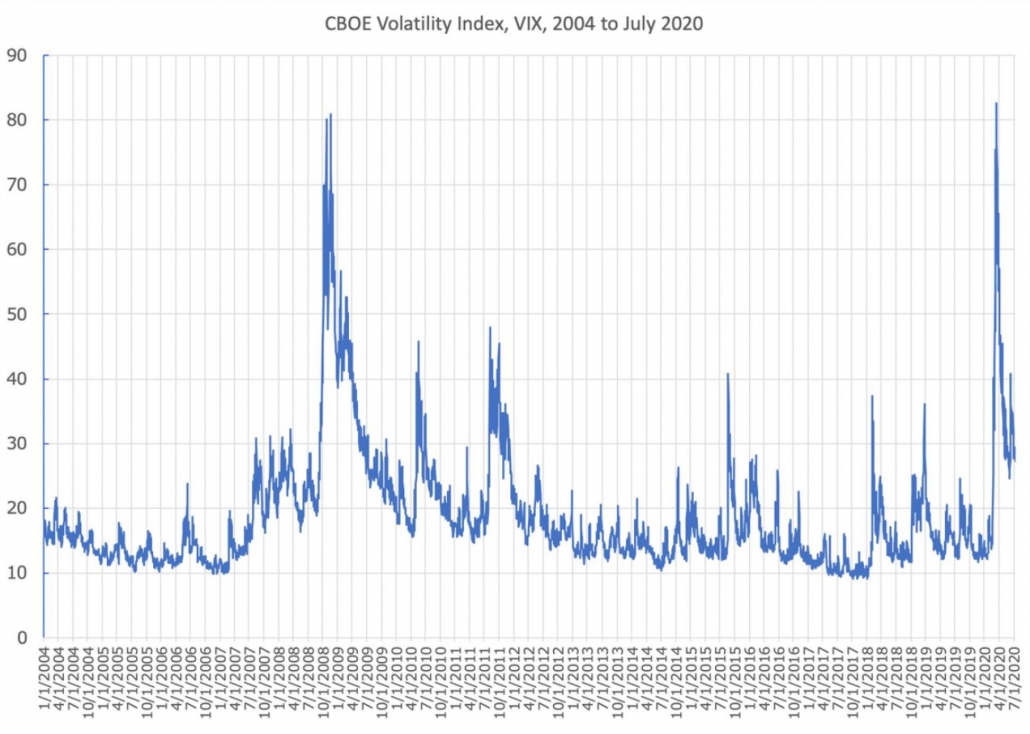
However, it can reach 80 in times of panic. It happened twice since 2004:
What Is Volatility, Mathematically?
Mathematically, volatility is usually viewed as a relative measure rather than an absolute one. It assesses how much a financial asset’s price changes compared to its average values or initial price. Therefore, volatility is often expressed as a percentage or ratio, showing how much an asset deviates from its average value.| Types of Volatility Measurements | Units of Measurement |
| Standard Deviation | Percentage (%) or numerical value |
| Historical Volatility | Percentage (%) over a specific period (e.g., day, month, year) |
| Implied Volatility | Percentage (%) per year (commonly used in options markets) |
| Average True Range (ATR) | Numerical value in the same units as the asset’s price (e.g., dollars for stocks) |
| Beta Coefficient (β) | Dimensionless ratio (compared to a benchmark index) |
| Volatility Calculated Through Variance | Numerical value (variance is the square of the standard deviation) |
Is Volatility the Same As Risk?
You can think that risk and volatility are the same, but it is not so. Volatility is an assessment of the price movement, which includes both losses and profits, while risk is exceptionally a loss indicator. It is obvious that risk and volatility are connected. Also, volatility is a useful factor when you consider the issue of how to reduce risks. However, the mixture of these two factors can seriously limit the profit-making capabilities of your portfolio.Is Volatility a Good Thing?
Volatility itself is neither bad nor good, but rather an inherent feature of each market that should be properly considered depending on specific goals. For aggressive traders, it is an opportunity to profit; for conservative investors, it is a source of risk. Advantages of volatile instruments:- They create opportunities for profit due to price fluctuations, both in intraday trading and other strategies.
- High volatility makes options trading strategies, which depend on sharp market movements, more appealing.
- High volatility signals uncertainty, leading to increased risk, which may be unacceptable for conservative investors.
- It can create stress and emotional pressure if the market moves in an unexpected direction.
- Volatility makes it more difficult to predict earnings and financial performance of companies.
What Does High Volatility Mean?
High volatility refers to the sharp and significant fluctuations in asset or financial instrument prices over short periods of time. In the context of high volatility, it is essential to consider the concept of the “Black Swan” introduced by N. Taleb. A Black Swan refers to an extremely rare and unexpected event with significant consequences, which traditional forecasting models fail to predict. Such events often lead to sudden spikes in volatility, as observed during global financial crises. For instance, while the average daily change in the S&P 500 under normal market conditions is around 0.5%, on:- March 16, 2020, the index fell by 11.98% due to the panic caused by the COVID-19 pandemic.
- October 13, 2008 (during the financial crisis), the index surged by 11.58%.
What Is the VIX?
The VIX, commonly known as the “fear index,” was developed by the Chicago Board Options Exchange (CBOE) and serves as an indicator of expected market volatility over the next 30 days. In addition to this, it is important to note that:- The VIX typically moves inversely to stock indices, increasing during bear markets and decreasing during bull markets. High VIX levels indicate market panic, while low levels suggest stability and investor confidence.
- Macroeconomic events, such as interest rate changes or political instability, can cause sharp increases in volatility and VIX levels.
- Beyond the standard VIX, there are similar indices for different assets, such as oil or Nasdaq volatility, which allow for more detailed analysis of market sentiment within specific sectors.
- Traders can use VIX fluctuations both to hedge against risk and to speculate on volatility through ETFs and futures that track the index.
FAQ
What is market volatility?
Market volatility refers to the extent of price fluctuations in financial markets. For example, the S&P 500 stock index typically sees an average daily movement of about 1.15%. Since important news often comes out in the second half of the week, it is common to say that market volatility is lower on Mondays and higher on Thursdays.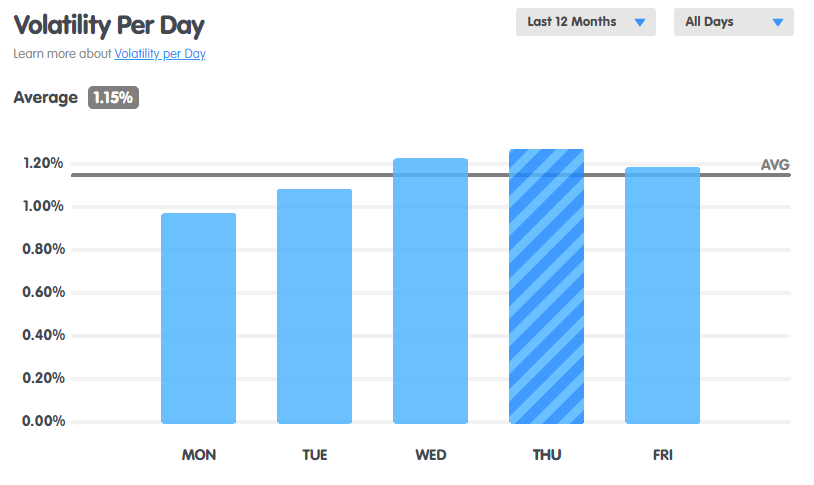
What is currency volatility?
Currency volatility is how much a currency’s exchange rate fluctuates compared to other currencies over a specific period. For instance, the chart below for the 6J futures contract (which tracks the USD/JPY exchange rate) shows that the Japanese yen’s volatility spiked in mid-July 2024, following the Bank of Japan’s decision to raise interest rates after keeping them at low levels for a long time.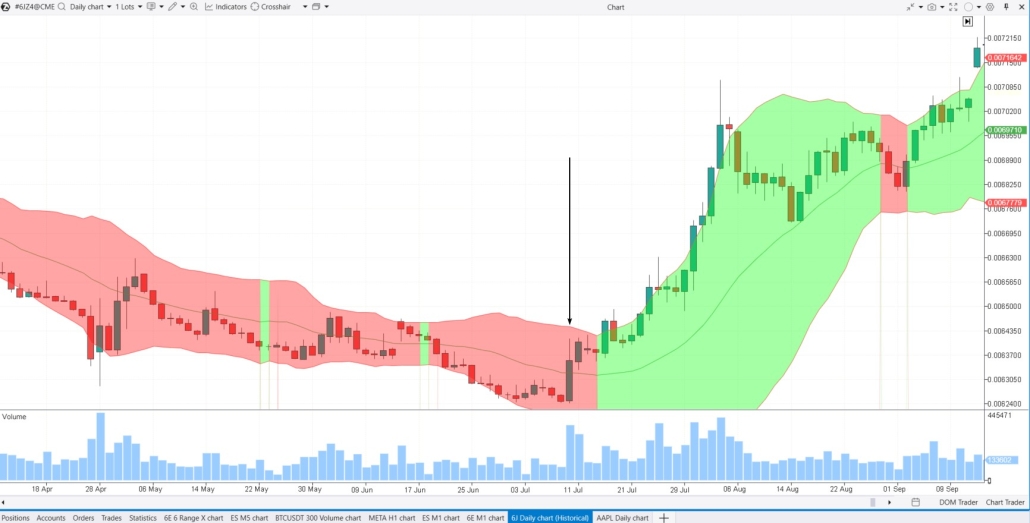
What is cryptocurrency volatility?
Cryptocurrency volatility refers to the degree of fluctuation in a cryptocurrency’s exchange rate compared to fiat currencies, typically the US dollar. Cryptocurrencies, especially Bitcoin, are known for their high volatility. For example, the average difference between Bitcoin’s daily high and low relative to the USD is around 4.6%. Volatility tends to be lower on weekends.The Bottom Line
Market volatility is an inevitable and standard element of investing and you should expect it from the market. If all markets moved up smoothly, it would be easy to invest, and we would all be rich. However, it is not so. Since making money is closely connected with price changes, volatility can be perceived as a boon to speculators. If you assess the current buying and selling balance with the help of the ATAS platform (download it free of charge from here), you can develop a profitable trading strategy and apply it in volatile markets with higher efficiency. Do not miss the next article on our blog. Subscribe to our YouTube channel, follow us on Facebook, Instagram, Telegram or X, where we publish the latest ATAS news. Share life hacks and seek advice from other traders in the Telegram group @ATAS_Discussions.Information in this article cannot be perceived as a call for investing or buying/selling of any asset on the exchange. All situations, discussed in the article, are provided with the purpose of getting acquainted with the functionality and advantages of the ATAS platform.