
- Pound sterling is the fourth popular currency in the currency market, second only to Euro, US Dollar and Japanese Yen. In this article, we will tell you about what a GBP beginner trader should know:
- Pound sterling history.
- The biggest fluctuations of the GBP/USD exchange rate.
- How to open the GBP/USD chart.
- How to make a forecast.
- Interesting facts about the pound sterling.
Pound sterling history
Pound sterling has its own symbol £ (from the Latin ‘Libra’, which is ‘weight scale’) and the word ‘pound’ derives from the Latin ‘Pondus’, which is ‘weight’ or ‘weight piece’. Origin of the word ‘sterling’ has several versions. The most popular one is that it derives from the Easterling (Eastern Land) area, where the silver alloy, from which coins were minted, was produced. King Henry the Second made this alloy a standard for coins in the middle of the 12th century, since pure silver is too mild and wears down quickly. The word ‘pound’ (as a measure of weight) was attached to the money unit name when big trades were executed and when the money quality was checked. 270 coins should have weighed 1 troy pound, otherwise, the coins either wore down or had been made of a low quality alloy. The name finally stuck in 1694, when the Bank of England started to issue banknotes for the first time, and the pound had the reserve currency status for many years when the British Empire flourished. Pound sterling was accompanied at different times with shilling, crown, pence, groat and farthing. However, the monetary system was made decimal in February 1971 and one pound sterling became equal to 100 pences (pennies). At the same time, the authorities introduced free market fluctuation of the pound exchange rate with respect to other currencies. As of today, the GBP/USD currency pair is popular and the GBP futures, which is traded on the CME, provides a lot of opportunities for speculating and hedging.The biggest fluctuations of the GBP/USD pair
March 17, 2020 – stock exchange markets faced excessive panic volatility, caused by the coronavirus pandemic spreading. The GBP/USD market wasn’t an exception. The futures opened at the level of 1.2087 and closed at 1.1647 (minus 4.27% as it is shown with the red arrow in the daily period chart below).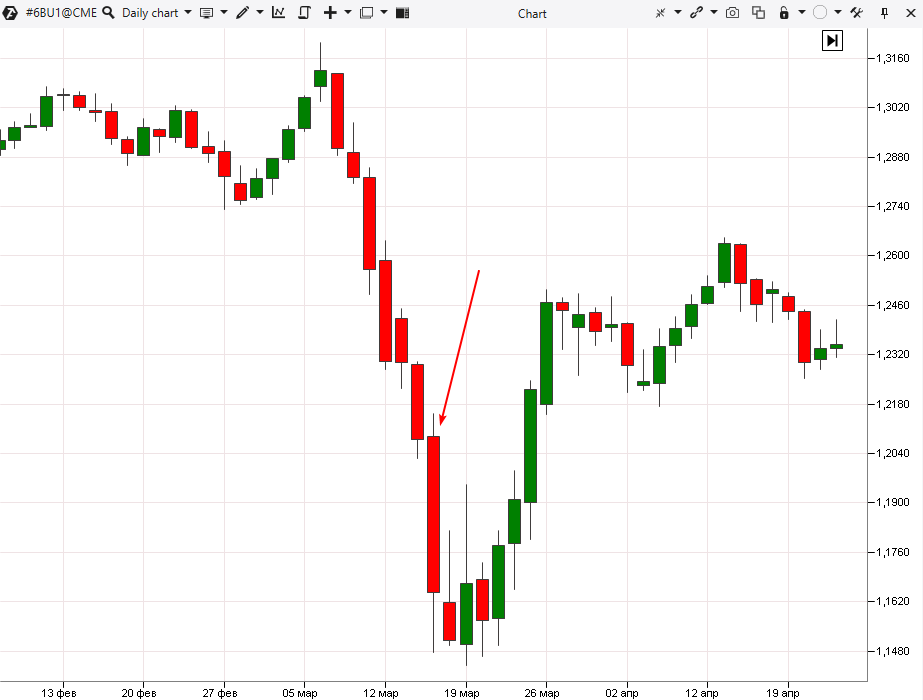
How to view the GBP/USD chart
You can view a professional GBP/USD chart after making 3 steps: Step 1. Download the ATAS platform. Step 2. Open the Chart module (shown with number 1 in the picture below). Step 3. Select ‘US and EU futures / FX / British Pound’ (shown with number 2 in the picture below) in the ‘Manage instruments’ window and press OK.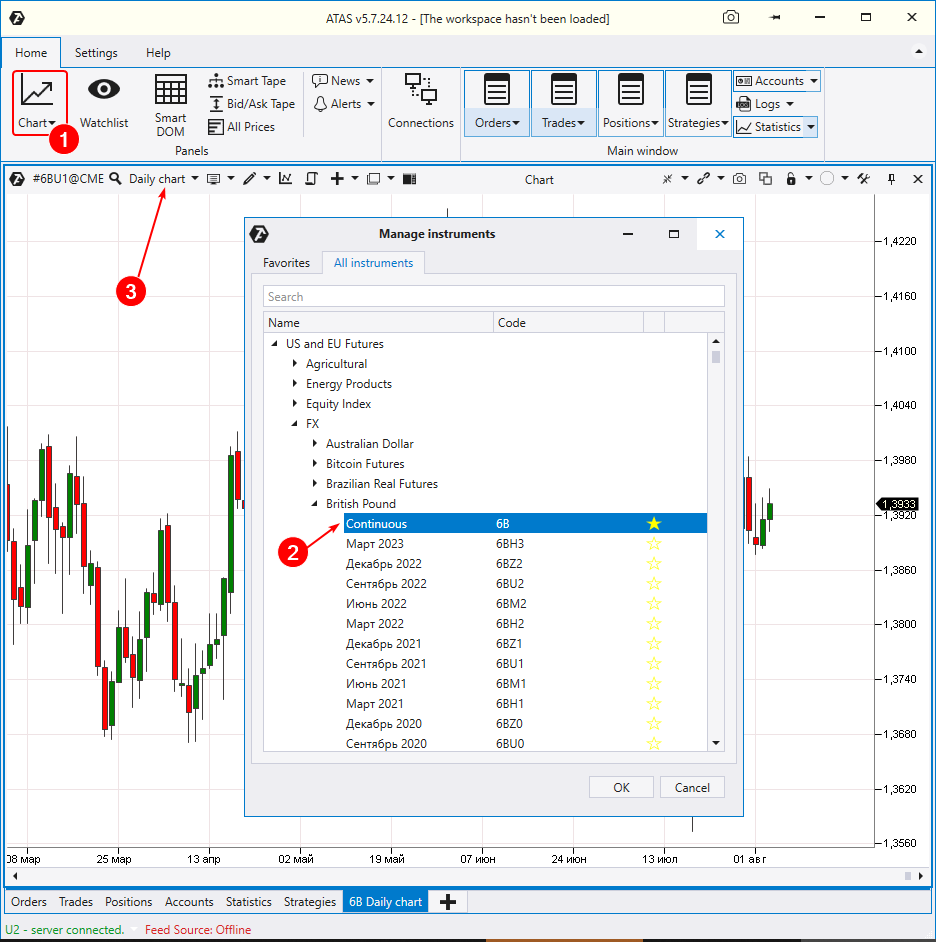
How to make the pound forecast
In order to forecast the GBP/USD dynamics during a day, we recommend that you use the trading volume analysis method, which can be applied to many instruments, including to the 6B futures. The COT indicator will be useful in the long-term forecasting.Example of intraday trading forecasting
The chart below shows the GBP/USD exchange rate dynamics for the period from July 28, 2021, until August 3, 2021.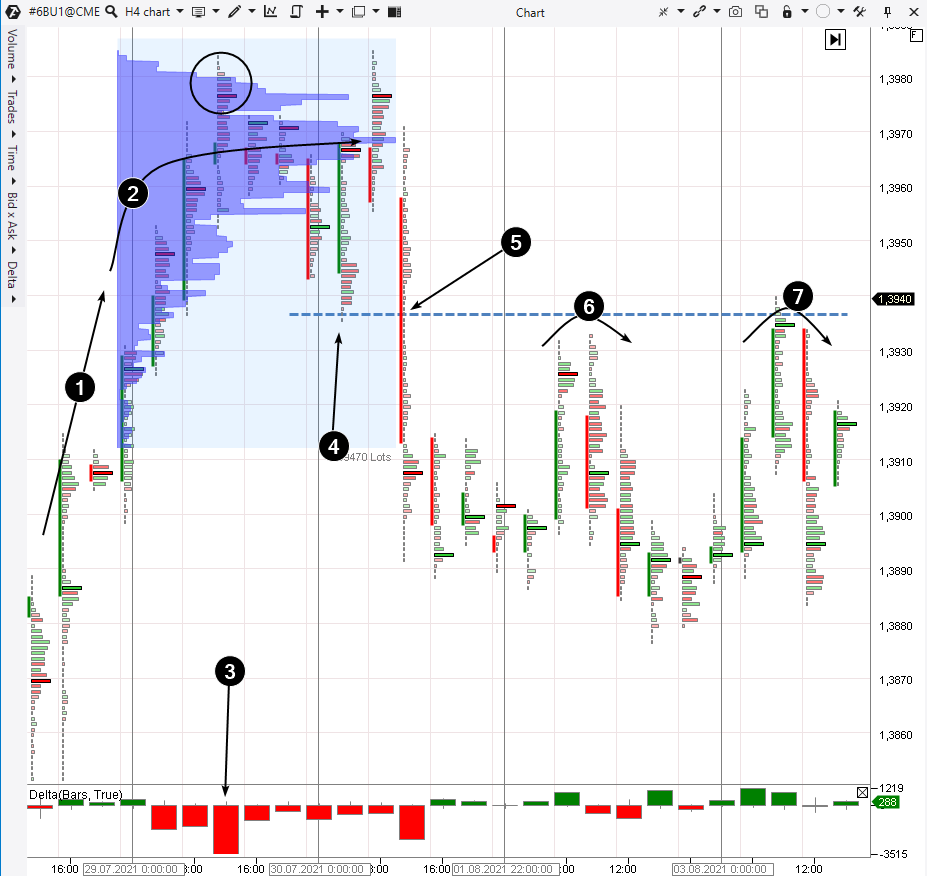
- a bulge was formed on the market profile;
- cluster charts show (marked with a circle) that active sellers (3) emerged.
Interesting facts about the pound sterling
Fact 1. The exchange trader slang has the word ‘cable’. It belongs both to the GBP/USD currency pair and just GBP. This term comes from the 1850s when a physical cable was laid under the Atlantic Ocean and the London and New York stock exchanges received a technical possibility to exchange quotations fast. Fact 2. The pound was issued by the Bank of England on the territory of England and Wales and by authorized private banks on the territory of Scotland and Northern Ireland. And although the banknotes from different issuers should be accepted in all parts of the Kingdom, it is not always so in reality. Fact 3. The Australian money unit was Australian pound from 1910 until 1966. It was practically equal to 1 British pound, because both money units were linked to gold during some time.Information in this article cannot be perceived as a call for investing or buying/selling of any asset on the exchange. All situations, discussed in the article, are provided with the purpose of getting acquainted with the functionality and advantages of the ATAS platform.


