
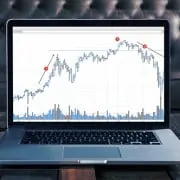
This practical article demonstrates power of the ATAS instruments. To prove their efficiency, we will show you how to find a bitcoin buying setup on the BitMEX cryptocurrency exchange. A simple logic, which is behind the price movement, will be used in the process of the market analysis. It is focused on the buyers and […]
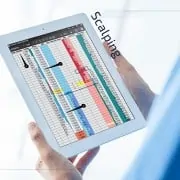
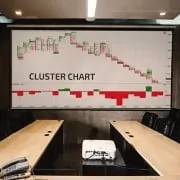
This article is a practical instruction for those who studies the market analysis with the help of such concepts as volume, clusters, footprint and delta. This method of analysis focuses on real powers that influence the price – efforts of buyers and sellers.
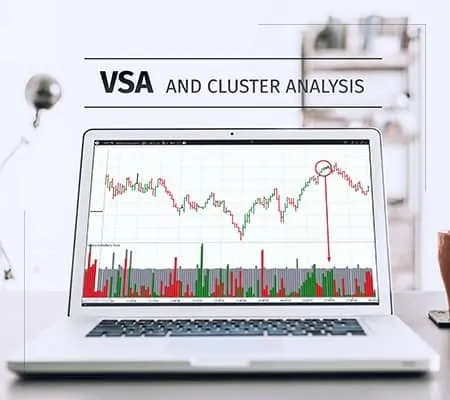
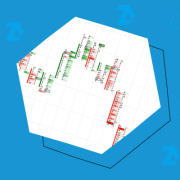
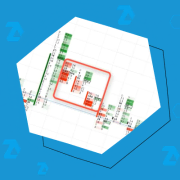
This is the first article in the series of publications in the ATAS blog on the VSA and cluster analysis topic. What is VSA? VSA – Volume Spread Analysis – is a universal approach to assessment of the strength and weakness of the market on the basis of analysis of the price and volume action. […]
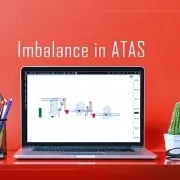
In the first part of this article we considered mostly introductory information about imbalances: what imbalances on the exchange are, how they are formed, what they are for, how to get and set them and the basic principles of use.
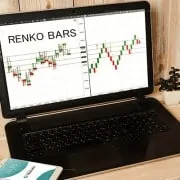
Japanese traders applied renko for the first time in the 19th century. They called them “renga”, which means “a brick”, due to their rectangular shape. Steve Nison was the first who presented both renko charts and Japanese candles to the European and American public. The main specific feature of Renko Charts is filtering out the […]
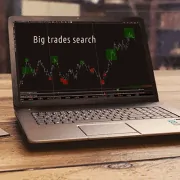
The Big Trades Indicator is an indicator of volume analysis of the current market situation, which finds big trades and shows them in a chart – at what levels, with what volume and in what direction of a trade. You might say: “Big trades manifest themselves by splashes on a standard volume indicator”. It is […]
How to use a cluster chart with an application of such a non-standard chart type as Range Bars? Try Range Bars if you cannot select a convenient timeframe. In this article we will analyze a footprint, built in the Range Bar chart, and you will see how useful it is to look at the same […]
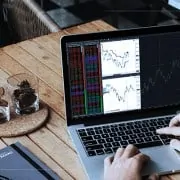
If you liked our previous article about a cluster analysis in the EUR/USD futures market, this one will also be useful for you. The goal of the article is to give you an example of a practical analysis of the market behavior using advanced instruments of the trading and analytical ATAS-Crypto platform. We will analyze […]