Tag Archive for: Technical analysis

Adding (combining) indicators in the ATAS platform

Adding indicators in the ATAS platform

Stock exchange trading and technical analysis of financial charts are closely connected with indicators. The present article is about convenience and powerful functionality, which the ATAS platform provides when working with indicators. Read in the article: What indicators and their purposes are How indicators are displayed How to combine indicators in the price window How […]

Всё про ТА. Технический анализ рынка

Everything about Technical analysis of the market

This article is as extensive as the subject itself – Technical Analysis (TA) of the market. That is why it’s quite possible that, while speaking about TA, we can miss something, which can be interesting for you. If this happens, please, ask questions in the comments or contact us in any way possible. We will […]

How to test your trading system automatically

How to test trading system automatically with Super Trend

Getting acquainted with ATAS. Trading advantages

Getting acquainted with ATAS. Trading advantages

Price, time and volume. How to analyse them?

Fractality. What the principle of fractality is

Mandelbrot fractal (in the picture above) is, perhaps, the most famous fractal among the wider community. It was named after a person who, as it is believed, made the biggest contribution into the study of the principle of fractality. In his book ‘The Fractal Geometry of Nature’ (1982), Benoit Mandelbrot introduced the term fractals and […]

Bollinger Bands. BBands indicator

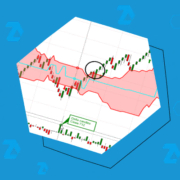
We start a series of articles about technical indicators. In this article, we will tell you about Bollinger Bands. They are better known as the Bollinger Bands indicator or just BBands.