How to combine indicators in the ATAS platform
Stock exchange trading and technical analysis of financial charts are closely connected with indicators. The present article is about convenience and powerful functionality, which the ATAS platform provides when working with indicators.
Read in the article:
- What indicators and their purposes are
- How indicators are displayed
- How to combine indicators in the price window
- How to combine indicators in the panels under the price window
- How to add one indicator to another
What indicators are
If we speak about technical analysis of financial markets, an indicator is a product of a mathematical formula, which uses the data of historical prices, volumes or (in case of futures markets) open interest. As a rule, this product can be added to a stock exchange chart in the form of lines, patterns or other visual objects.
Perhaps, the common goal of all indicators is to help traders to make correct decisions and protect them from incorrect ones.
They do it in different ways. Some indicators calculate average price values (for example, moving averages) in order to point to a trend direction and/or strength, while some focus on volatility (for example, ATR and Bollinger Bands) and other market characteristics, which can be described by formulas.
How indicators are displayed
In a majority of cases, indicators can be displayed in one of 2 ways:
- in the price window (results of mathematical calculations are added to a candlestick / bar / cluster chart);
- in additional panels – usually, under the price chart window.
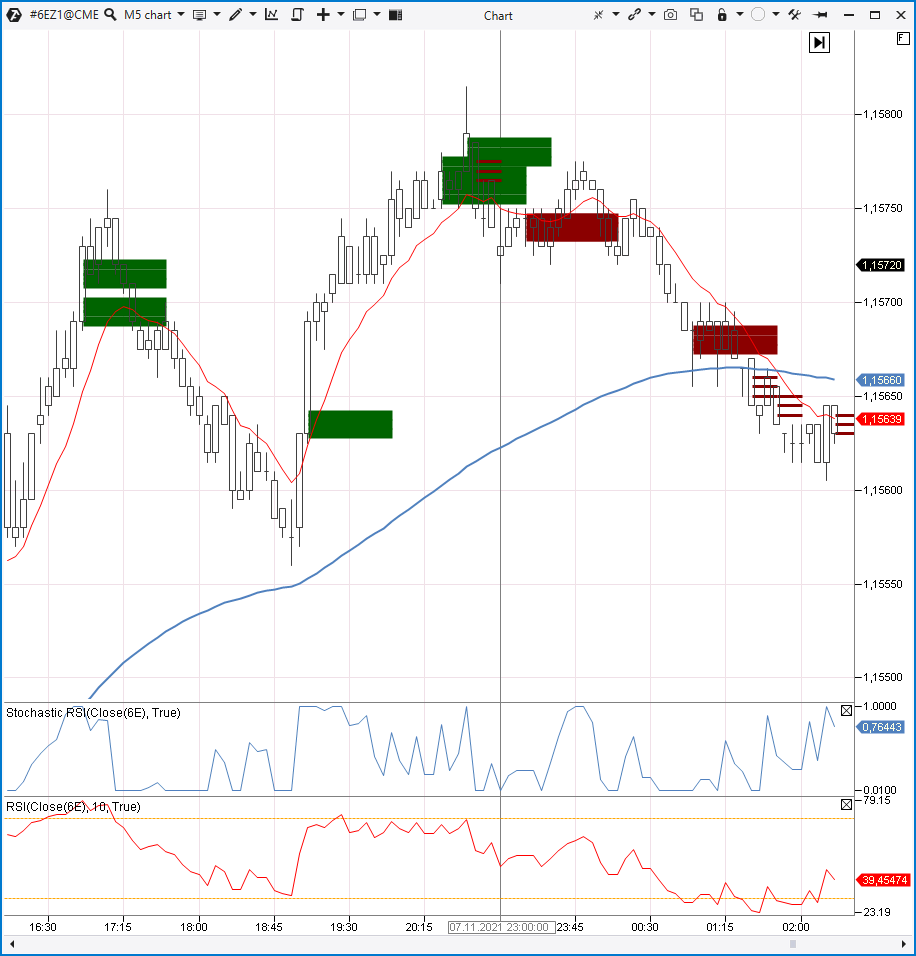
The picture below shows it (we will use the 6E Euro futures market on CME as an example):
You can see the following in the upper part in the price chart area:
- blue line of the Exponential Moving Average (EMA) (100 – ‘slow’);
- red line of the Exponential Moving Average (EMA) (10 – ‘quick’);
- red and green ‘thick’ lines of the Imbalance indicator (Volume = 10);
- red ‘thin’ lines of the Imbalance indicator (Volume = 3).
Note. The Imbalance indicator shows predominance of buyers and sellers. It ‘looks into’ every candle and compares Bid volumes at one level and Ask at a higher level. You can find more details about interpretation of this useful indicator readings in this article or in this video on our channel (do not forget to subscribe).
There is an area for indicators, which are not displayed in the price chart, in the lower part of the chart. You can see 2 panels there and:
- the blue line of the Stoch RSI oscillator;
- the red line of the RSI indicator.
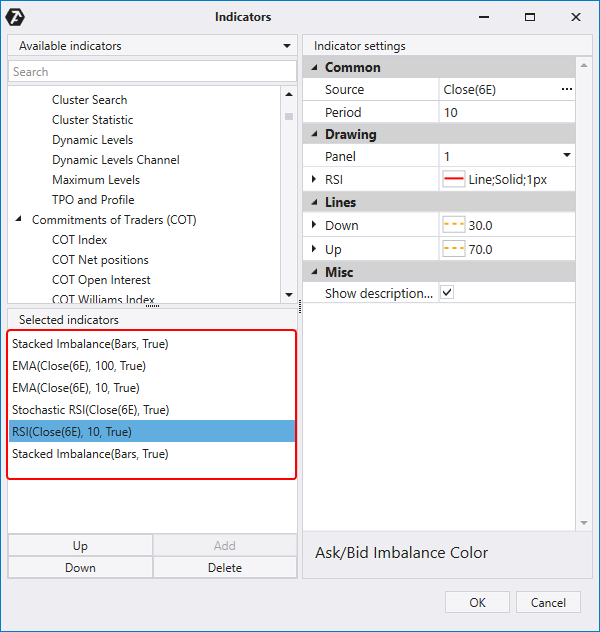
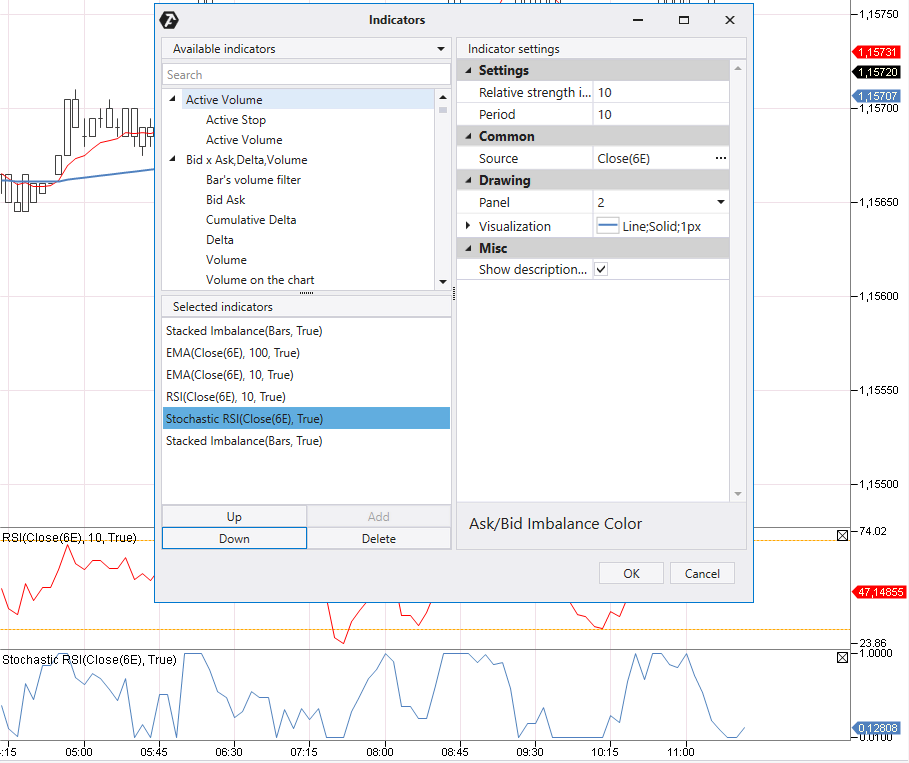
Besides, the indicator manager window looks as follows:
The red line outlines all added indicators.
Note that a majority of indicators in the ATAS platform have the Drawing / Panel setting. If the setting is:
- Chart – the indicator is displayed in the price chart window;
- Number (for example, 1 or 2) – the indicator is displayed in an additional panel under the price chart window.
How to combine indicators in the price chart
A trader / analyst quite often needs to add several indicators to the price chart. ATAS offers 3 tips to keep the chart user-friendly:
Tip 1. Use different colors and line thickness for different indicators. For example, as it is done with moving averages for different periods in the example above.
Tip 2. Use the Up / Down buttons to move indicators to the foreground / background. Some indicators include the function of moving them ‘under’ the candlestick chart.
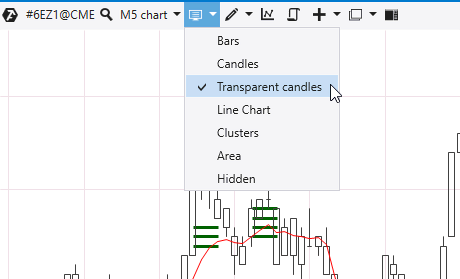
Tip 3. Use the possibility of making candles transparent so that the bright price colors will not make indicators ‘less visible’. Select the Transparent Candles menu item to turn on the candle transparency.
Moreover, you can do the following to find a proper balance between the chart elements:
- set transparency / colors of candle outlines;
- set transparency / colors of candle fillings;
- set transparency / colors of indicator objects;
- set a chart background color (including gradient);
- completely turn off candles (selecting Hidden in the menu above).
Platform advantages. The ATAS flexible visual settings allow creating practically all types of unique charts with indicators.
How to combine indicators in a panel under the price chart
As it is shown in the example above, RSI (red line) is under Stoch RSI (blue line). Use the Up / Down buttons if you need to change their positions.
We have changed indicator positions with a single click in the panel.
However, how to combine lines in one panel?
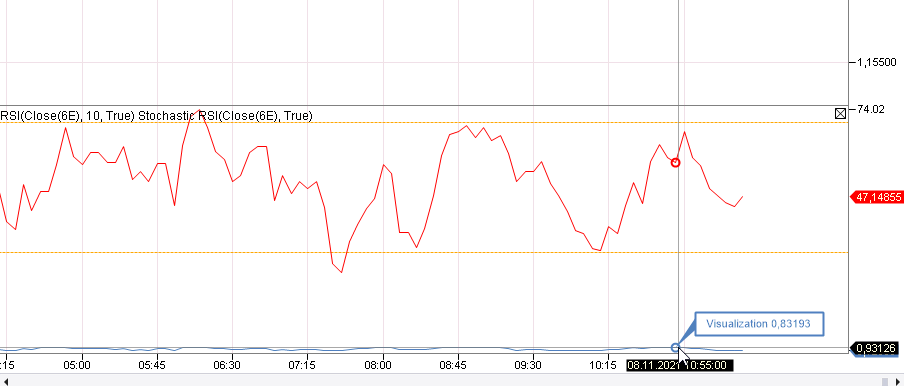
Go to the indicator settings and look at the Drawing section. The Stochastic RSI indicator shows number 2 in the Panel subsection. If we change 2 to 1, we will get the following:
The red RSI line and blue Stochastic RSI line are displayed in the 1st panel. However, you can clearly see that the picture is not easy to read, since RSI fluctuates between 0 and 100, while Stochastic RSI – between 0 and 1. We even had to mouseover the blue line to see the value.
If indicator values were homogenous, we could have saved space and set their display in one panel.
How to add one indicator to another
Sometimes, there is a need to use another indicator rather than the price history as the source data for the indicator formula. How to do it?
Let’s use a popular example by adding a Simple Moving Average (SMA) to the Volume indicator.
To do it, we:
- Add the Volume indicator to a new panel under the price chart.
- Add the SMA indicator.
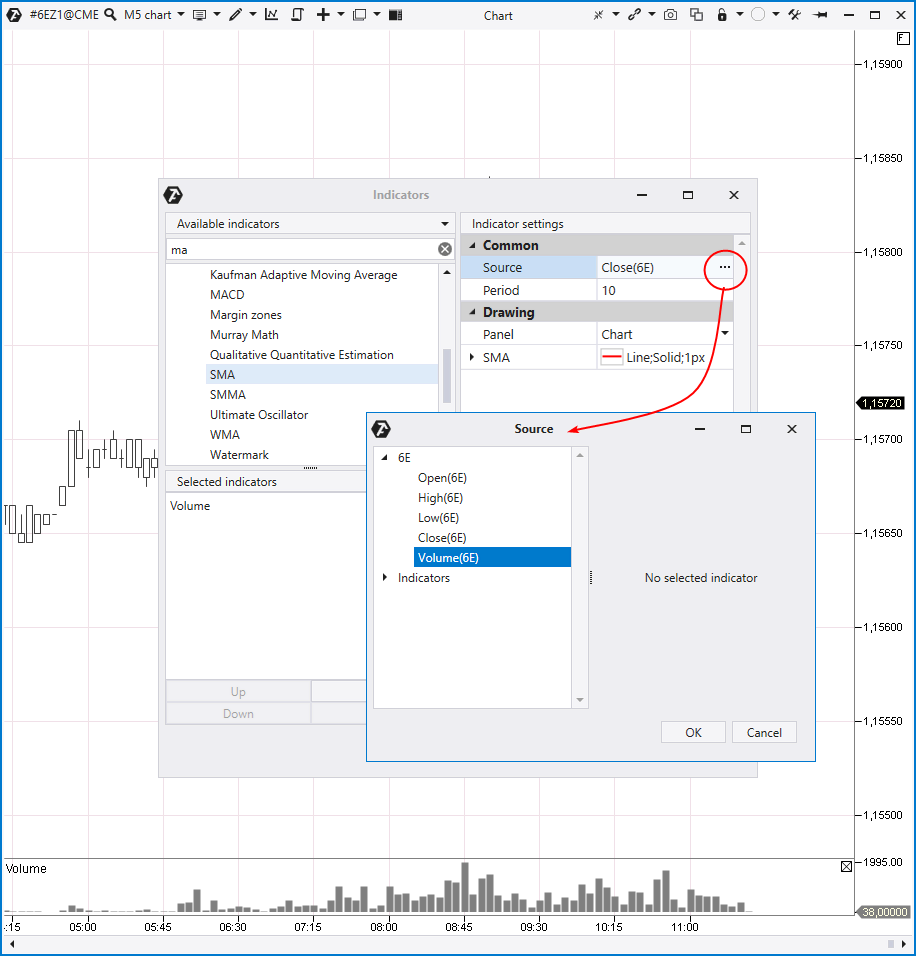
- Select ‘Source = Volume’ in the SMA settings (as it is shown in the picture below).
- Select ‘Panel = 1’ in the SMA settings (this panel contains Volume).
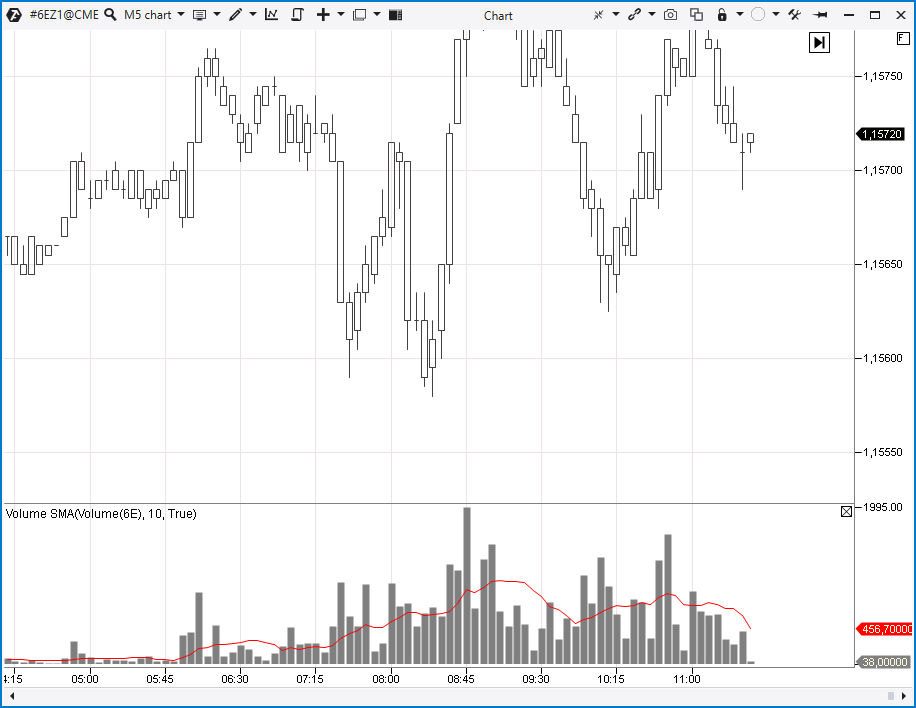
We get SMA (10), which will help us to understand how big or small the volume at every candle is with respect to 10 previous ones.
It can be useful, for example, when performing VSA analysis.
Similarly, we can add Bollinger Bands to the volume histogram.
Let’s note that the ATAS platform doesn’t provide a technical possibility to add any indicator to another indicator. However, the available combinations allow finding interesting solutions.
Example
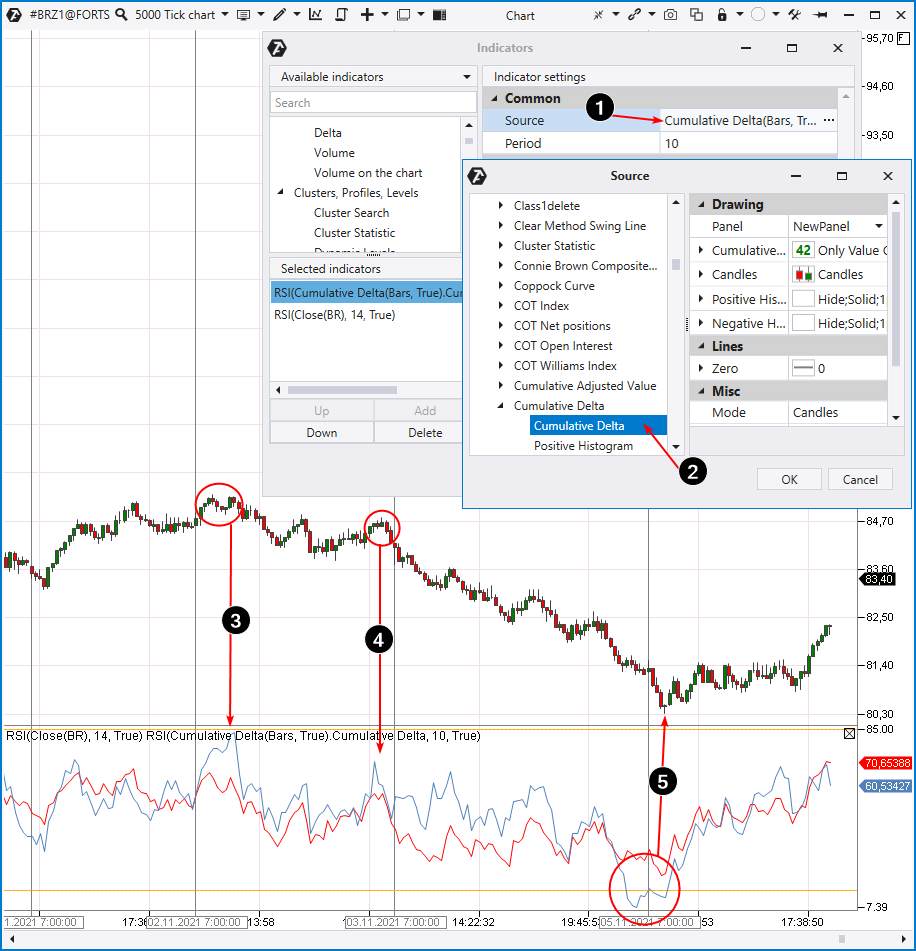
Below is a tick (5000) oil futures chart from the Moscow Exchange. The lower panel shows a combination of 2 RSI indicators and both have the Period = 10. However, one of them is classical, based on the price (red line), while calculation of the other is based on the Cumulative Delta (blue line).
Arrows 1 and 2 will help you to set RSI by the Cumulative Delta.
How to use it? Note that the blue line moves sharply up with respect to the red one at two peaks (marked with numbers 3 and 4). It can mean that the size of buys (Ask trades) is extremely big and doesn’t correspond to the price growth dynamics. Perhaps, this is sellers’ ‘stop loss activation’ and / or ‘bull entry into a trap’, which usually takes place at market peaks.
A similar situation (but a mirrored one) takes place at the market low marked with number 5. There are too many sells (Bid trades), but the price falls slower.
FAQ
What indicators does the ATAS platform have?
There are around one hundred indicators and their number grows with every update. Indicators are split into groups. If you want to get an idea what indicators are available, we recommend that you read the Getting acquainted with indicators article.
What indicators are the most useful ones?
The best and most accurate indicators, which provide the 100% guarantee of a profit, unfortunately, do not exist. We recommend that you pay more attention not to popular ones, like MACD, for example, but to progressive instruments based on the order flow: Big Trades, Cluster Search, Speed of Tape and others.
How to test a strategy, which is based on an indicator?
To do it, you will need to know the C# programming language. We showed how to test your trading by the Super Trend indicator in this article. Tick history of data and flexible type / frame settings allow performing accurate tests using unique charts.
Conclusions
Indicators allow traders / analysts to mark and find ‘support points’ in the infinite space of price and time. The ATAS platform provides maximum flexibility for working with indicators.
Download the ATAS platform free of charge in order to assess its flexibility and power of available indicators in the markets you select.
Information in this article cannot be perceived as a call for investing or buying/selling of any asset on the exchange. All situations, discussed in the article, are provided with the purpose of getting acquainted with the functionality and advantages of the ATAS platform.

