

According to the principles of classical technical analysis, a triple bottom is a reversal pattern that forms after a pronounced downtrend and signals a potential reversal to the upside. In real trading, the triple bottom pattern is rare and does not always serve as a reliable buy signal. This can pose difficulties, particularly for beginners, who often encounter false breakouts.
However, volume analysis can significantly increase the chances of accurately identifying a trend reversal. The volume analysis tools provided by the ATAS platform not only help confirm the validity of the triple bottom pattern but also enable traders to determine more precise entry points, contributing to improved trading outcomes.
What Is the Triple Bottom Pattern?
The triple bottom pattern is a bullish reversal pattern in classical technical analysis. It is applicable across various time frames and markets (stocks, futures, and cryptocurrencies). Visually, it resembles three consecutive letters “V”.
The triple bottom forms when:
- The market is in a downtrend, during which the price declines to a certain level.
- The price then rebounds from this level three times, indicating strong support. As a result, three lows are formed on the chart at approximately the same price level.
A support line (S) is drawn through the three troughs, and a resistance line (R) is drawn through the intermediate peaks.
Example of a Triple Bottom
The screenshot below shows an example of the triple bottom pattern – a technical analysis formation that, in this case, formed in the gold futures market:
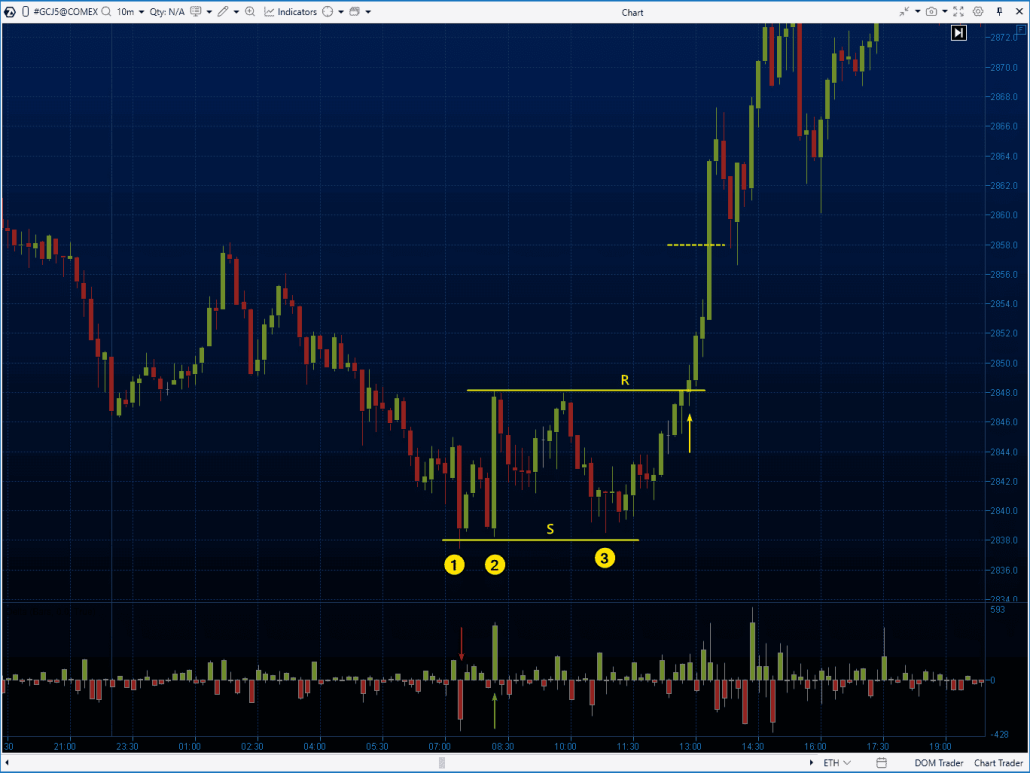
The numbers (1-2-3) indicate the formation of the triple bottom pattern around the $2838 level after a period of declining prices.
The horizontal lines mark:
- Support (S) – drawn through the $2838 level, from which the price reversed upward three times;
- Resistance (R) – drawn through the peaks between the lows (1-2-3). This is a rare instance where these peaks are approximately equal;
- Dashed line – the target price level. In this case, after reaching the target, the upward trend in the gold market continued, driven by news of increasing geopolitical tensions.
Volume indicator analysis (in this case, the Delta indicator) helps confirm the validity of the observed bullish reversal:
- The red arrow indicates a surge in market sells, signaling the formation of a selling climax in trading.
- The green arrow points to increased buying activity. On the chart, this shift in sentiment suggests that bulls are taking control.
- The yellow arrow marks a break of resistance, occurring alongside a rise in market buying volume on the Delta indicator – a sign that typically confirms the authenticity of the bullish breakout.
How to Trade the Triple Bottom
The classic strategy for trading the triple bottom pattern, often found in basic textbooks for beginner traders, includes the following rules (we will later look at how they work on real charts and how they can be improved with advanced volume indicators):
Triple Bottom Trading Rules: Step-by-Step Guide
Step 1. Identify the three lows
Pattern identification. Find three lows that are approximately at the same level. Analyze the significance of the support level where they are formed: this could be a psychological level or the Point of Control.
Step 2. Draw support and resistance levels
Mark the triple bottom pattern on the chart. Draw the support level through the three lows and the resistance level through the intermediate peaks. Ideally, these peaks should be at roughly the same level.
Step 3. Enter at a breakout point
Enter a long position once a candle closes above the resistance level, following proper risk management rules:
- Stop-loss. Place a protective stop order below the lowest of the three lows (some sources recommend placing it below the third low).
- Take-profit. Set your profit target by measuring the height of the triple bottom pattern and projecting that distance upward from the breakout level.
- Position size. Your position should be sized so that, in the event of an unfavorable outcome, your capital is not reduced by more than 1–3%.
As you can see, with this approach, the potential profit is usually slightly less than the assumed risk, which creates a challenge in achieving the desired risk-to-reward ratio, commonly expected to be 1:2 or 1:3.
The solution? Use advanced volume analysis tools, which are widely available in the ATAS platform.
Example 1. Triple bottom on the Apple (AAPL) stock chart
The candlestick chart below shows the price fluctuations of Apple (AAPL) stock on the NASDAQ exchange:
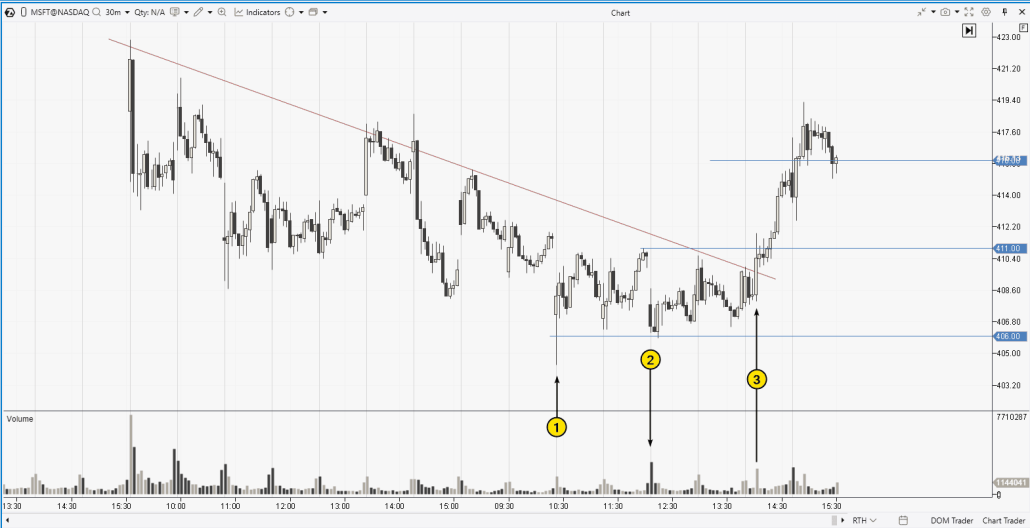
The chart highlights the following:
- Numbers 1-2-3 mark the formation of the triple bottom pattern. It emerged after a period of declining prices, indicated by the red downward trendline.
- Horizontal support is drawn at the $406 price level.
- Resistance line is marked at the $411 price level.
- Price growth potential is projected at $416, it is calculated based on the height of the pattern.
An analysis of volume indicators provides a strong basis to assume that a genuine reversal of the bearish trend is occurring here, with the formation of a valid triple bottom pattern:
1. At the first low, a long lower shadow on the opening candle suggests buying activity—possibly by traders who took advantage of heightened volatility at the start of the session to purchase the stock at more favorable prices. This may also be viewed as a sign of panic selling in the market.
2. A spike in volume carries a bullish implication. As this surge in volume could indicate selling pressure aimed at pushing the price down, but if so, the attempt did not succeed.
3. A volume surge at the breakout point, reflecting bullish momentum as buyers attempt to break through the resistance from the red downtrend line. The progress seen in price action confirms this effort.
Let’s assume a trader using volume analysis entered a long position at the breakout of the red line. In this case, placing a stop-loss below the high-volume candle (3) would be a reasonable decision. This approach aligns the trader with major market participants while also reducing risk. By contrast, placing a stop-loss below the support level (according to the standard triple bottom strategy) would result in a stop that is twice as wide, significantly increasing the level of risk.
Example 2. Triple Bottom in the Cryptocurrency Market
The chart below shows price fluctuations of the Litecoin futures contract, based on Binance Futures data. This example demonstrates a key feature of identifying the triple bottom pattern—its subjectivity, or relativity.
The lows are marked with numbers 1-2-3-4, and the triple bottom can be formed in two ways:
- Lows 1-2-3, with the second one slightly higher and resistance drawn at the $126 level.
- Lows 1-3-4, where the swings forming the triple bottom are more pronounced, and resistance is drawn at the $128 level.
Whichever option the trader considers more appropriate, the triple bottom setup would have yielded a profit, as the price did not fall below the lowest low (3) after breaking through resistance. Instead, the price increased beyond the pattern’s height by a wide margin.
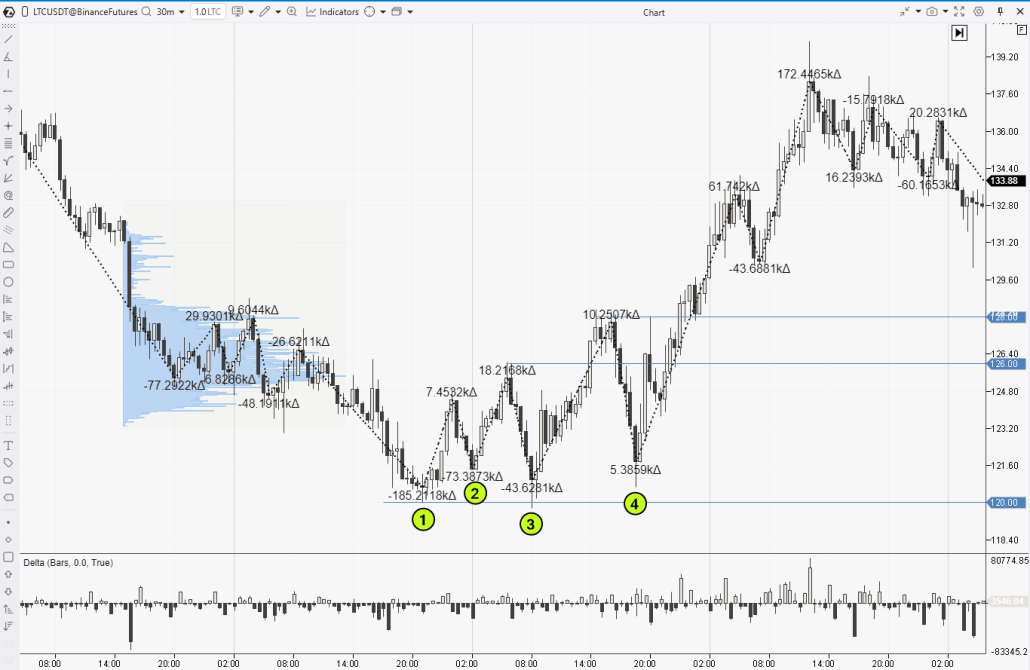
Volume analysis tools can provide valuable additional insights, offering an advantage by confirming the triple bottom pattern as well as helping to reduce risk (and even for other trading ideas). Take note of the following:
- The resistance at $126 is near the Point of Control of a previously established balance zone, which is visible on the market profile.
- The resistance at $128 is located near the Value Area High of the same balance zone.
- The delta dynamics on the ATAS ZigZag Pro indicator show a decrease in selling pressure across successive downward waves: -185k < -73k < -43k.
Did you notice that the reversal occurred near the psychological level of $120, with a false breakout at point (3)?
Example 3. Unsuccessful Triple Bottom Pattern
The main risk when trading the triple bottom pattern lies in opening a position against the trend, which could resume.
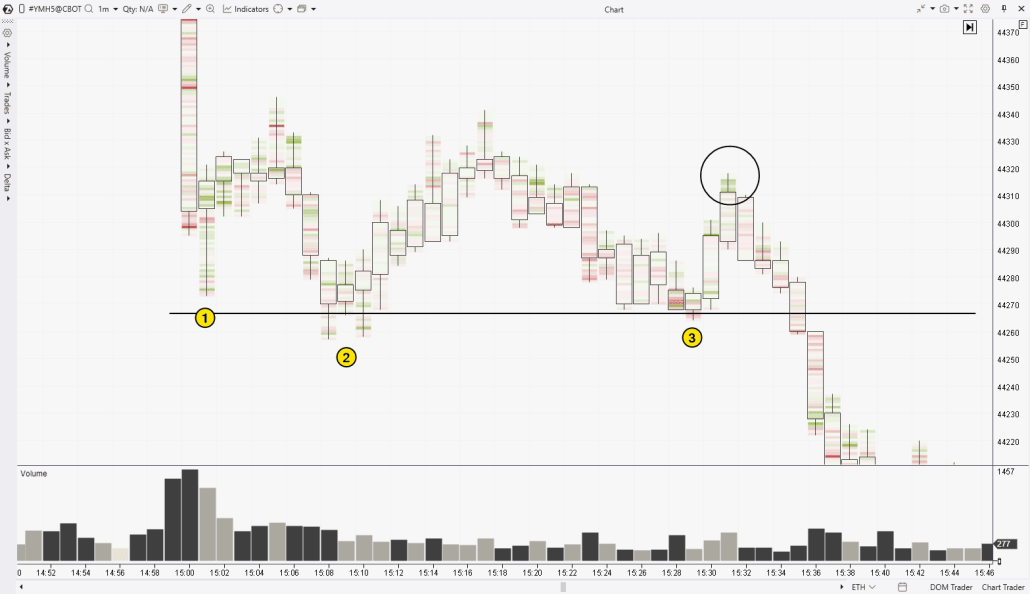
The cluster chart above shows the formation of a triple bottom pattern (1-2-3) on Dow Jones futures. However:
- There was no entry signal, as the price did not rise above the intermediate peaks.
- After a brief consolidation (which appeared as a triple bottom pattern), the downward trend continued.
- Observers of the cluster charts may have noticed an interesting detail—a bull trap (highlighted in a circle), which played a role in the continuation of the downward trend.
What Is the Success Rate of Triple Bottom?
Thomas Bulkowski, a well-known researcher of technical analysis patterns, analyzed 2,500 triple bottom patterns in stock markets.
According to his findings for the triple bottom pattern:
- Overall rank: 12th out of 39 patterns analyzed. This places the triple bottom relatively high compared to other technical analysis patterns.
- Break-even failure rate = 13%. This suggests a relatively low risk of failing to reach the break-even point after the breakout.
- Throwback Rate = 65%. This indicates the likelihood that the price will return to the breakout level for a retest.
Trading advice for the triple bottom pattern from Thomas Bulkowski. If the peak between the first and second lows is higher than the peak between the second and third lows, draw a downward trendline connecting these peaks. Then, trade the buy signal that occurs when the bulls break through this trendline.
How to Learn to Trade the Triple Bottom Pattern
To master trading the triple bottom pattern (and other strategies), consider using ATAS Market Replay. This tool enables you to replay historical market data for futures, stocks, and cryptocurrencies, providing beginner traders with a realistic trading environment to test their strategies and refine their trading skills.
Advantages of Market Replay in ATAS:
- Historical data and market visualization. ATAS enables you to load detailed tick history, allowing you to analyze price and volume movements at key trend reversal points.
- Advanced indicators for confirmation. Use ATAS tools such as footprint charts, cumulative delta, and vertical and horizontal volumes to confirm the triple bottom pattern and identify optimal entry points.
- Training in Market Replay mode. Practicing in a market simulator is one of the most effective ways to refine your skills. Take advantage of ATAS’s functionality to replay historical data in real time, track technical pattern formations (including the triple bottom), trade them on a built-in demo account, and analyze your mistakes without risking your deposit.
To quickly get started on your path to professional trading, download the ATAS platform for free, install and launch it, and then:
- Open a chart of a financial instrument.
- Click on the Market Replay button in the main ATAS menu.
- Activate the Replay mode (the icon should turn green).
- Adjust settings (date and data type).
- Start the replay and look for three minimums at approximately the same level.
- Have you spotted the setup? Trade it on the built-in Replay demo account.
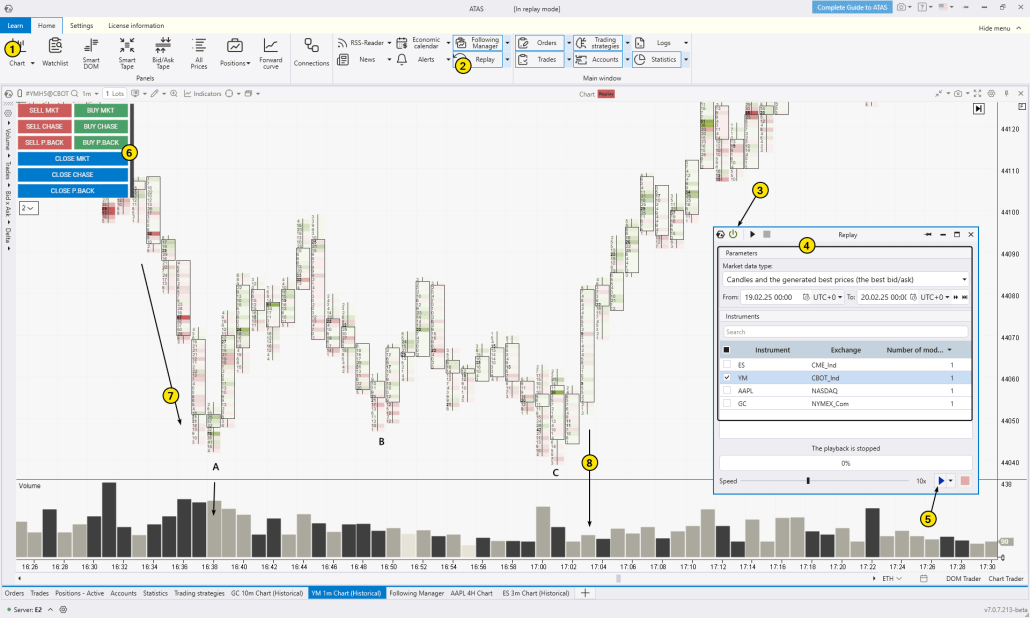
The footprint chart above illustrates an example of the triple bottom pattern (A-B-C), which formed after a period of price decline. Key points to note:
- Look at the formation of the first minimum. The price accelerated its decline (7), but then the downward movement slowed, with volumes above average—this indicates a bullish Bag Holding pattern, which serves as an early signal of a bearish-to-bullish trend reversal.
- The ease (8) of the price rise after the third minimum. Low volumes on a wide bullish candle suggest that there were few sell orders, allowing buyers to make progress with little effort.
Download ATAS to see how advanced volume indicators can give you a trading edge over those relying solely on traditional technical analysis.
We hope you now have a better understanding of the triple bottom pattern. Additionally, there is a mirror pattern – the triple top, which offers a chance to study the same concept but in an inverted form.
FAQ on the Triple Bottom Pattern
How is the triple bottom formed?
This pattern is characterized by three lows, which occur as the price rebounds from roughly the same level, indicating it as a significant support level. Technical analysts identify this pattern and then draw the upper and lower boundaries that frame it.
What does the triple bottom pattern mean?
It can signal a potential market reversal for traders. However, there is a risk that the triple bottom could appear as a consolidation phase before the downtrend continues. Therefore, it is crucial to implement risk management techniques to protect your capital from excessive losses (just like with any other trading strategy).
How is the triple bottom different from other patterns?
Identifying the triple bottom pattern on a chart (like other chart patterns) is a subjective process, which can sometimes lead to confusion: where one trader sees a triple bottom, another may interpret it as a symmetrical triangle or something else.
Inverse Head and Shoulders
The inverse head and shoulders is a variation of the triple bottom pattern, where the middle low is lower than the two surrounding lows. For more details on this pattern, refer to the article Head and Shoulders in Trading.
Double Bottom
The double bottom is very similar to the triple bottom but, as the name implies, consists of only two lows. Both patterns signal a potential reversal of a bearish trend, though the triple bottom is generally considered a more reliable indicator (but it occurs less frequently).
Symmetrical Triangle
The triple bottom typically forms after an extended price decline and often represents a phase of consolidation, where supply and demand are temporarily in balance. The symmetrical triangle is another type of consolidation pattern. Unlike the triple bottom, which features horizontal support and resistance levels, the symmetrical triangle is characterized by converging trend lines, indicating a gradual decrease in market volatility.
Conclusion
The triple bottom is a well-known technical analysis pattern used by traders to identify potential long entry points in anticipation of a bearish trend reversal. It is interpreted as a sign of seller exhaustion after three failed attempts to break through a key support level.
Advantages of the Triple Bottom Pattern:
- Clear and easy to identify. The triple bottom is easy to recognize on a price chart.
- Versatility. This pattern can be applied in various trading environments and across different markets, including stocks, futures, and cryptocurrencies.
- Effective when combined with volume analysis. The use of volume indicators can enhance confidence in the validity of trading signals and assist in accurately determining entry and exit points, thereby reducing risk.
Disadvantages:
- False signals. As with any technical pattern, the triple bottom may generate false signals, particularly when traders do not use additional confirmation tools such as volume indicators or broader market context analysis.
- Risk-to-reward ratio. Traditional trading methods for the triple bottom often involve equal distances to the stop-loss and take-profit levels, which can limit the ability to achieve recommended risk-to-reward ratios, such as 1:3.
- Infrequency. The pattern occurs rarely, even on intraday charts, making it unlikely to serve as the sole setup a trader follows.
- Subjectivity. If there is no clear trend, traders may mistakenly interpret random market fluctuations as the early stages of a triple bottom formation, which increases the risk of losses.
To enhance signal accuracy when trading the triple bottom, consider incorporating additional tools such as footprint chart patterns or other advanced indicators. While this may add complexity to your trading process, it can also elevate your performance to a more professional level.
Do not miss the next article on our blog. Subscribe to our YouTube channel, follow us on Facebook, Instagram, Telegram or X, where we publish the latest ATAS news. Share life hacks and seek advice from other traders in the Telegram group @ATAS_Discussions or on Discord.
Information in this article cannot be perceived as a call for investing or buying/selling of any asset on the exchange. All situations, discussed in the article, are provided with the purpose of getting acquainted with the functionality and advantages of the ATAS platform.


