
Perhaps, it is connected with the fact that information about volumes, as well as the ability to interpret it correctly, could give a significant competitive advantage.
We will tell you in this article:
- what exchange volumes are;
- what types of volumes exist;
- with the help of what instruments you can analyse them.
What exchange volumes are
The volume is a number of exchange assets, which pass from some traders to other traders during a certain period of time. The volume is measured in money, contracts and stocks. For example, the securities volume is a number of stocks or bonds.
Every trade increases the volume. The more volumes an instrument has, the more liquid and attractive to the traders it is. Since the spread (what a spread is) is smaller in liquid instruments, it is more profitable to trade them, since market orders will be executed with a smaller slippage.
Specific features of exchange volumes:
- As a rule, volumes are bigger during the first hour after opening and the last hour before closing.
- Volumes usually decrease before holidays.
- Recently, HFT trading exerts a big influence on market volumes. It is responsible for more than 50% of all trades on American exchanges.
What types of volumes exist
There is no specific classification as such. We will consider 3 most popular types of exchange volumes, which traders work with:- tick;
- vertical;
- horizontal.
The tick volume shows the price changing activity.
A tick is the price increase or decrease during a certain period of time or from one trade to another. The tick size is different for different instruments. You can learn about the tick size in the futures contract specification on the exchange web-site. Thus, the tick volume shows a number of price changes during a certain period of time without taking into account the number of trades. See Picture 1.
The vertical or quantitative volume shows how many contracts were traded during a certain period of time.
Trading platforms often show the vertical volume as a histogram. It could be placed below the chart or in a separate window.
Useful articles on this subject:
The horizontal volume shows how many contracts were traded at each price level. It emerged relatively recently and is not available in some trading systems.
The ATAS platform shows the horizontal volume to the left or right from the chart along the horizontal axis if you turn on the fixed TPO and profile indicator. Unlike the quantitative volume, this one takes into account both time and price.
It is possible to present the scheme of the futures market volumes as following:
Tick – Second – Minute – Hour – Day – Week – Month – Contract
Advice. Since futures contracts are closely connected with underlying assets, you should pay attention to the volumes in underlying assets.
How to analyse exchange volumes
Types of market volume analysis:- Technical analysis.
- Volume Spread Analysis (VSA).
- Cluster analysis.
- Order flow analysis.
- Market profile.
Let’s consider each of them in detail.
Technical analysis
Technical analysis is one of the oldest and most famous variants of working with information from exchanges.
Technical analysis helps traders to confirm the price movement strength or weakness with the help of indicators and oscillators. If the volumes grow proportionally, it means that major players (so-called managed money) stay behind price movements.
If the volumes decrease, it means that participants are not interested in these price levels. The volume growth, as a rule, confirms the current trend. The price decrease or increase, along with the volume reduction, warns about a possible reversal, since traders are not interested in this movement.
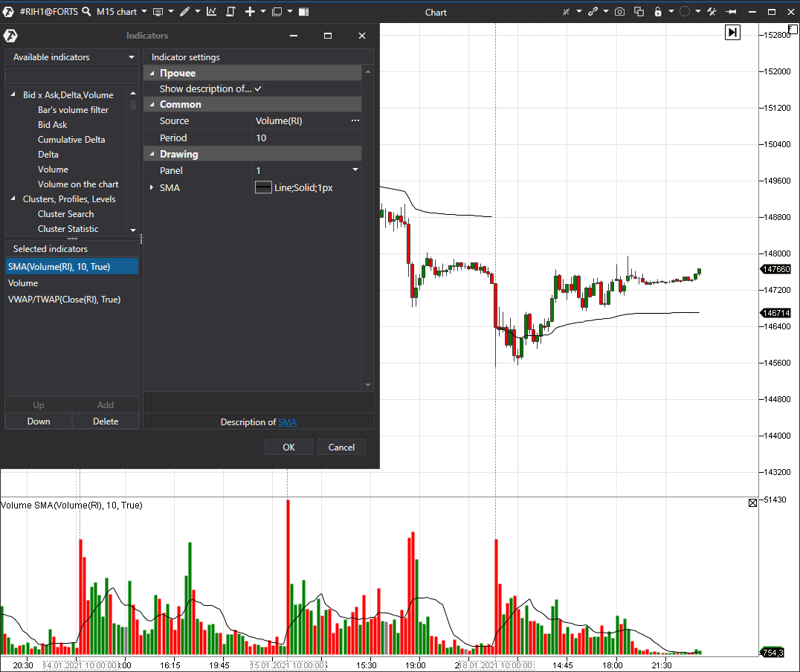
Moving averages could be applied to the volume chart in ATAS in order to assess whether the volume indicator is above or below the average.
To do it, you need to select the volume rather than price in the settings as the source. Then, a line will appear in the volume chart as it is shown in our example in the 15 minute RTS RIH1 index futures chart (see the picture below).
Traders should pay attention to high volumes at that trading session time, when, usually, there is no activity – for example, at noon. See Picture 2.
For example, the price grows and the indicator stays at the same level – such discrepancies are called the divergence. It warns that the current trend may change. Trend lines, channels and other technical analysis instruments could be used for instrument analysis.
Let’s consider an example in the 15 minute S&P 500 E-mini index futures chart. We will analyse an American session, since it accounts for main volumes. See Picture 3.

Volume Spread Analysis
VSA is such a type of volume analysis where traders compare the bar range, volume and closing position. VSA could be referred to as graphical analysis.Most often traders do not use additional indicators but identify patterns or certain combinations of bars. We have a series of the articles about basic VSA patterns in our blog.
ATAS allows using the more modern and advanced cluster analysis for confirming VSA signals.
Cluster chart analysis
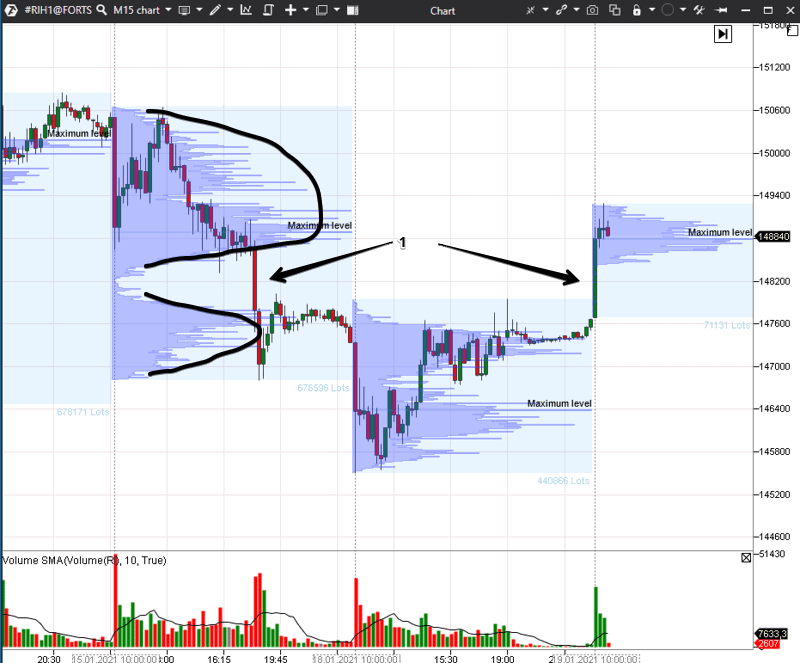
The cluster analysis emerged a bit more than 20 years ago when it became technically possible to split every bar into clusters and see how many contracts were sold at what price level. At this moment of time, it is the most modern type of analysis, because traders study the ‘skeleton’ of every bar in real time.Apart from visual analysis, such indicators as, for example, Maximum Levels or Cluster Search could be used.
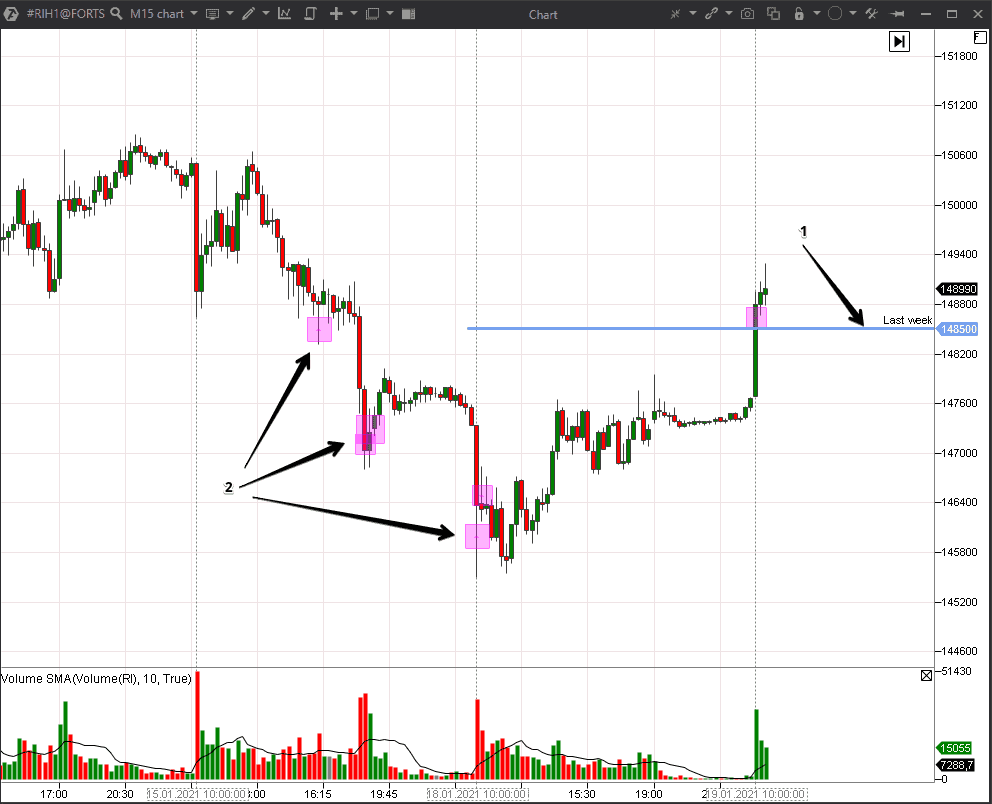
Let’s consider the 15 minute RTS RIH1 index futures chart. We added two indicators to the chart – Maximum Levels and Cluster Search. Our Maximum Levels shows the previous week’s maximum volume level, while Cluster Search looks for the levels with more than 1,500 contract volumes. See Picture 4.
Useful articles:
- Cluster analysis with the Cluster Search indicator.
- 6 useful settings of the Cluster Search indicator.
Cluster chart analysis
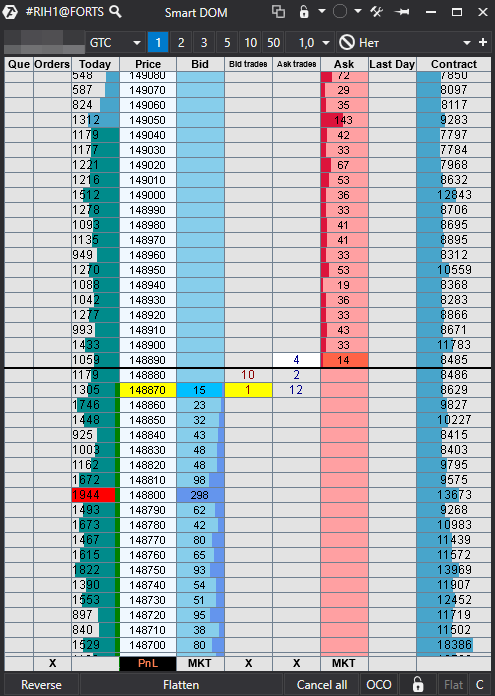
The order flow analysis is the work with limit and market orders with the help of the order book, Time & Sales and indicators.The ATAS order book is called Smart DOM and this instrument shows the limit orders and traded volume simultaneously.
Traders post limit orders and show their intentions. However, limit orders are not always executed. Sometimes, traders try to manipulate them and exert influence on other trading participants. That is why, it is important to see the real traded volume and levels, at which the price might slow down in the future. See Picture 5.
Useful links:
- How to read Time & Sales.
- Trading with the Smart DOM module.
Market profile analysis
The market profile is yet another modern method of volume analysis. Peter Steidlmayer was the first one who presented this method to the Chicago Exchange traders. He offered to consider the price movement on the exchange as an endless succession of focused and balanced movements.When the market is in balance, the volume distribution has the bell shape and when the market is in the trend movement, the volumes expand and are distributed unevenly. The market profile takes into account prices, volumes and time.
ATAS has several instruments for working with the Market Profile. For example, we added the Market Profile indicator to the 15 minute RTS RIH1 index futures chart. See Picture 6.
Useful articles on the subject:
- Strategy of trading by disbalance levels.
- Top strategies of trading by volumes.
- How to improve trading by Market Profile.
Conclusions
Traders analyse volumes in different ways and build trading strategies based on their beliefs. ATAS allows you to combine advantages of modern cluster analysis and market profile with the technical analysis methods, which were tested and confirmed by time. Download the free test version of the ATAS platform right now.Information in this article cannot be perceived as a call for investing or buying/selling of any asset on the exchange. All situations, discussed in the article, are provided with the purpose of getting acquainted with the functionality and advantages of the ATAS platform.


