How Wolfe Waves Work
The Wolfe Waves principle is similar to Newton’s Third Law: “For every action, there is an equal and opposite reaction.” As Bill Wolfe explained, the balance between forces often reveals a pattern that offers significant profit opportunities to those with a trained eye Wolfe Waves are not related to Elliott Wave Theory, even though they might look similar at first glance. Unlike Elliott Wave Theory, which is based on specific market wave patterns and phases, Wolfe Waves are purely a chart pattern. The Wolfe Wave pattern: ✔ works on any market and timeframe; ✔ can be either bullish or bearish; ✔ is effective for both trend-following and trend-reversal trading.How to Identify Wolfe Waves
Bill Wolfe initially focused on the “Rising Wedge” pattern. Through his studies, he developed a new pattern that he later showed to a friend who worked as a rocket scientist. It was this friend who suggested naming it the “Wolfe Wave.” The Wolfe Wave pattern consists of five waves:- the first four waves often form a narrowing wedge;
- the start of the fifth wave signals the entry point, suggesting a strong potential move ahead.
Bullish Pattern
A bullish Wolfe Wave pattern occurs when the price drops to a new local low at point 5, indicating a potential upward move. Points 2 and 4 should be higher than points 1 and 3, and by the end of the fifth wave, the price should touch the line connecting points 1 and 4. Below is an example of a Wolfe Wave, provided by its creator. It is applied to a 30-minute chart of the S&P 500.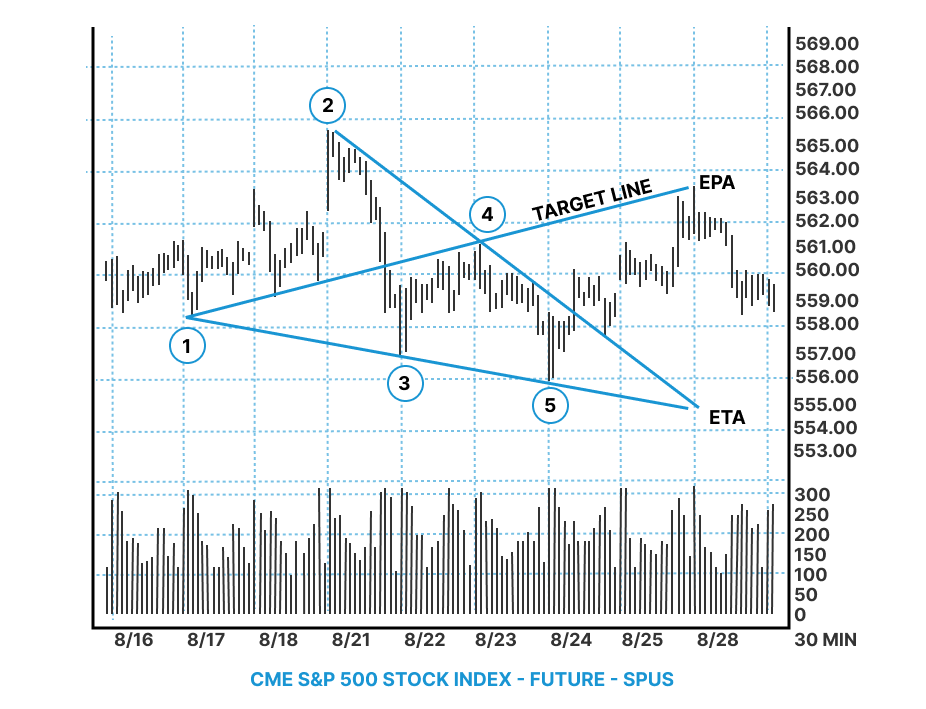
Bearish Pattern
The bearish Wolfe Wave pattern is the mirror image of the bullish pattern. Below is an original example of a bearish Wolfe Wave as demonstrated by its creator.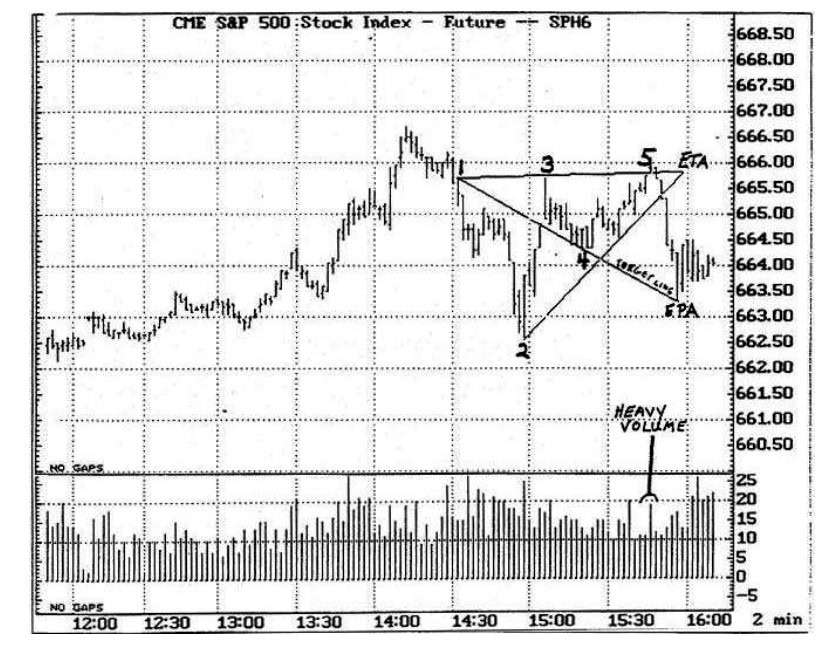
Wolfe Wave Indicator
While there are third-party platforms that offer automated Wolfe Wave detection, we cannot guarantee their accuracy. As an alternative, we suggest using the ATAS ZigZag indicator along with range charts (to reduce noise). These tools will not do all the work for you, but they can help identify the key extrema that may lead to the formation of a Wolfe Wave pattern. Example. A bullish Wolfe Wave pattern on an oil futures chart.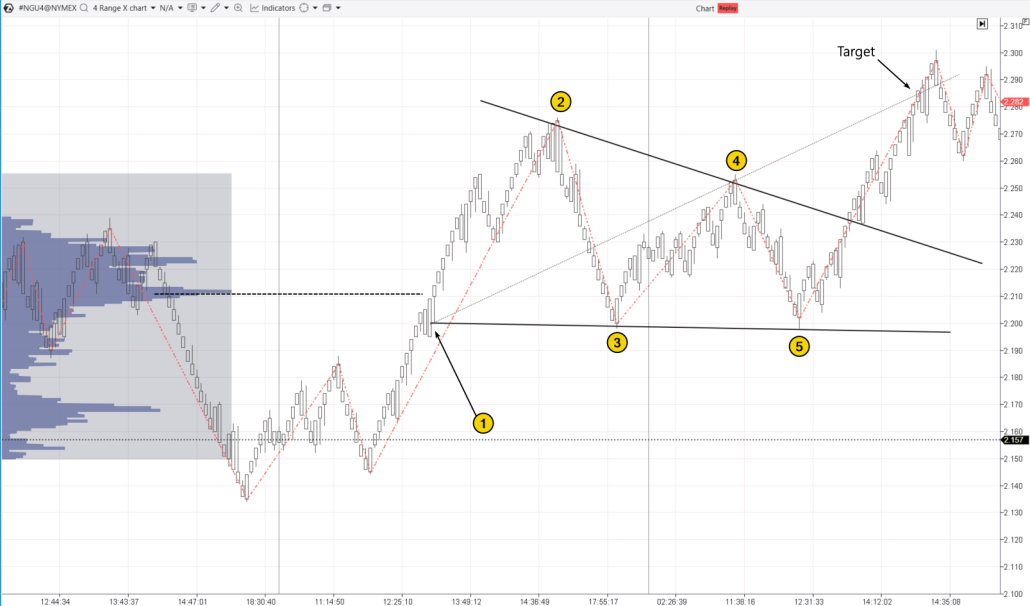
How to Trade Wolfe Waves. Entry and Exit Rules
Trading Wolfe Waves involves the following basic steps: Pattern identification. Use the criteria described above to spot a Wolfe Wave. Make sure the pattern is fully formed and the price is in the process of completing the fifth wave. Entry. Entering a trade at point 5 may involve certain nuances (details are provided in the examples below). Stop-loss. Bill Wolfe did not offer strict guidelines for setting stop-losses, emphasizing the importance of “knowing yourself.” If you are unsure of how to manage risk in a worst-case scenario, a protective stop order is essential. Example. How to calculate a stop-loss level. If you buy a stock at $100 with a target price of $105, a reasonable stop-loss can be set by dividing the distance to the target by 2 or 3. In this case, a stop-loss around $97.75-$98.33 would be appropriate. You might also consider placing the stop-loss below (for a bullish pattern) or above (for a bearish pattern) the reversal formation on a range chart at point 5. Exit. The price target is usually determined using the line connecting points 1 and 4. Sometimes traders might choose more conservative targets based on nearby support and resistance levels. Bill Wolfe also advised considering “emergency” exits if unexpected events start impacting the price.Examples on Charts
The creator of the Wolfe Wave pattern emphasized the importance of trading volumes as a key factor in validating the pattern.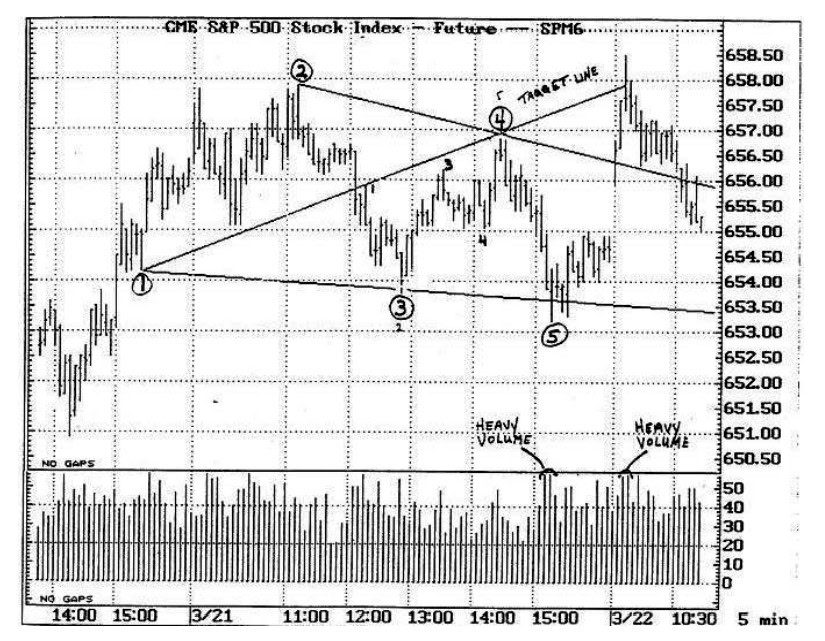
Trend Reversal Trading
The example below demonstrates how the Wolfe Wave pattern can be used to trade cryptocurrencies, specifically for entering a short position when an uptrend reverses into a downtrend. In this example, the price of Litecoin was rising steadily until it surpassed the $66 mark. Then, the Wolfe Wave pattern began to form.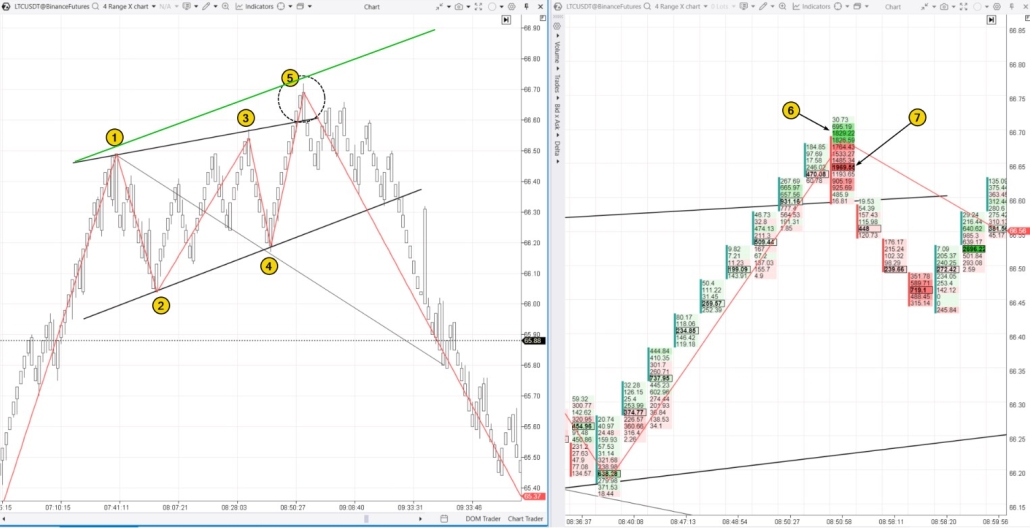
- the short entry is backed by the Wolfe Wave pattern;
- the clusters show a shift in market sentiment.
Trend Trading with Wolfe Waves
Trading with the Wolfe Wave pattern while following the trend involves the following approach: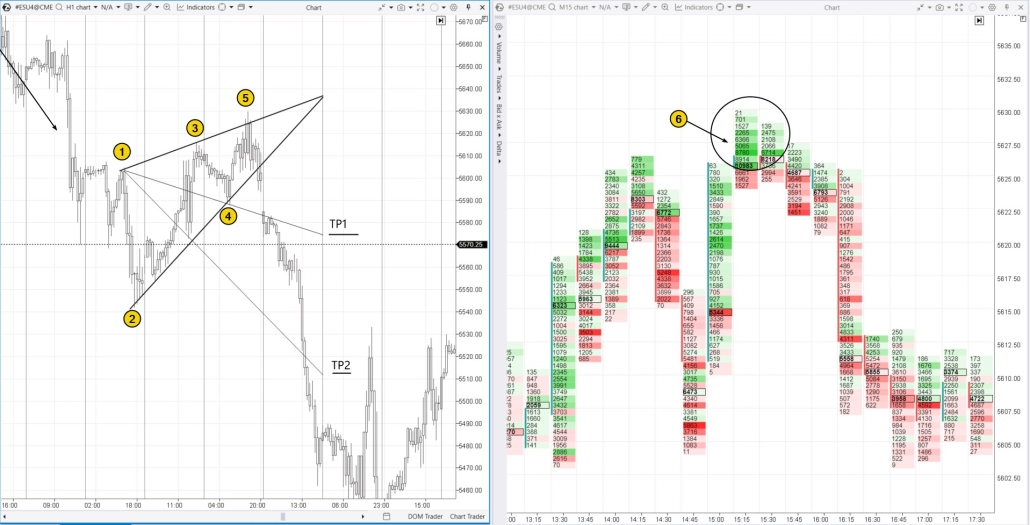
What Is the Best Wolfe Wave Strategy?
The Wolfe Wave pattern can be combined with various approaches and technical analysis tools, such as:- Trading using Fibonacci.
- Multi-timeframe analysis (reading charts across different timeframes).
- Support and resistance levels determined through various methods.
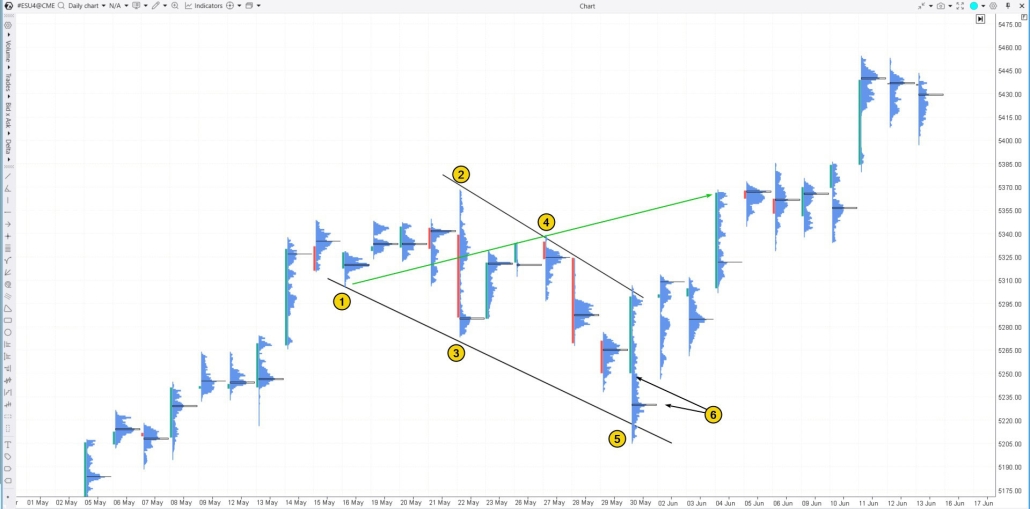
Upon spotting the pattern and noting that the price closed above the maximum level (6) on the profile, the trader could use this information to open long positions, targeting the level indicated by the line drawn through points 1 and 4.
Pros and Cons of the Wolfe Wave Pattern
Pros:
✔ High risk-to-reward ratio. ✔ Can be combined with other methods, such as support and resistance levels or footprint patterns. ✔ Applicable across various markets and timeframes. ✔ Clear entry and exit rules.Cons:
✘ Rarity. Finding a Wolfe Wave pattern in historical data can take considerable time. ✘ Subjectivity: accurate pattern recognition requires experience. ✘ Risk of false signals. Wolfe Wave often involves trading against the trend, which carries higher risk.FAQ
What is the Wolfe wave pattern?
Wolfe Waves are a five-wave price pattern used to predict market reversals. The creator of this pattern highlighted that it reflects the market’s natural tendency toward equilibrium.What is Wolfe wave condition?
To spot a valid Wolfe Wave, certain criteria must be met, such as the correct alignment of waves and the crossing of key price levels. When identifying the entry point 5, it is crucial to watch for the price as it nears the line connecting points 1 and 3. It is also helpful to confirm the formation of points 2 and 4 and analyze volume data for a more informed trading decision.How accurate is the Wolfe wave?
Linda Raschke, in her book, was impressed to note that Bill Wolfe’s son, Brian, was successfully trading stock indices using the Wolfe Wave pattern as a teenager. She did not detail the extent of his success, but since Wolfe Waves are a visually identified pattern, collecting reliable statistics can be challenging. This challenge stems from the complexity of describing the pattern in a format suitable for trading algorithms.What is the difference between Weiss Waves and Wolfe Waves?
Weiss Waves and Wolfe Waves are both methods of technical analysis, but they differ in their formations and principles. Wolfe Waves are based on a five-wave pattern that signals potential trend reversals, while Weiss Waves offer a more complex approach that involves analyzing the volume at each wave. You can learn more about Weiss Waves in a separate article.How to Learn to Trade Using Wolfe Waves
Is trading Wolfe Waves or another chart pattern worth it? How many setups can you expect, and what is the potential profit? To get answers to these questions, use the ATAS Market Replay simulator for traders. This feature of the ATAS platform uses historical data to recreate real-time trading conditions. It is easy, financially safe, and highly effective for learning. To try the simulator, download the ATAS platform for free, install, and launch it, and then: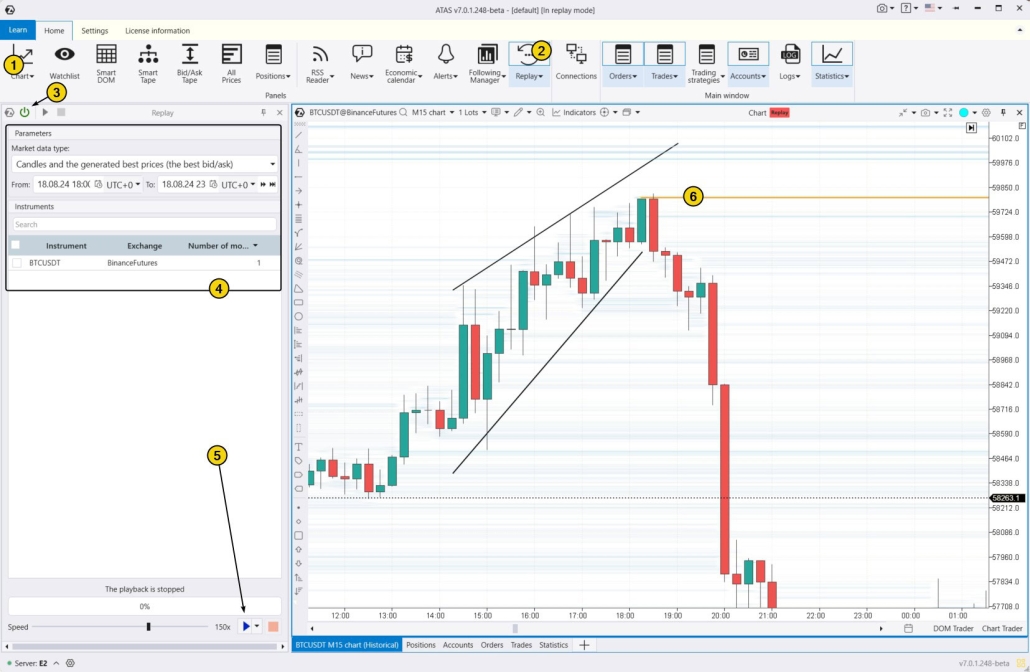
- adjust the playback speed, and pause;
- analyze footprint charts;
- use more than 400 indicators;
- use Chart Trader and other features to trade on the built-in demo Replay account and then analyze your performance;
- use drawing objects, for example, mark support and resistance levels;
- use various chart types (e.g., non-standard Range XV);
- use exit strategies;
- use various techniques to identify Wolfe Waves and other patterns.
Conclusions
Wolfe Waves are a chart pattern that the creator links to physics principles. When the price moves in one direction, it might be followed by an impulse pushing it the other way. Bill Wolfe learned to identify such points using his eponymous five-wave pattern, which resembles a narrowing wedge. In practice, while Wolfe Waves can offer a strong reward-to-risk ratio, identifying them can be tricky due to the subjective nature of pattern recognition. To improve your trading with Wolfe Waves and other patterns, professional volume analysis tools can be very helpful. Download ATAS. It is free. Once you install the platform, you will automatically get the free START plan, which includes cryptocurrency trading and basic features. You can use this plan for as long as you like before deciding to upgrade to a more advanced plan for additional ATAS tools. You can also activate the Free Trial at any time, giving you 14 days of full access to all the platform’s features. This trial allows you to explore the benefits of higher-tier plans and make a well-informed purchasing decision. Do not miss the next article on our blog. Subscribe to our YouTube channel, follow us on Facebook, Instagram, Telegram or X, where we publish the latest ATAS news. Share life hacks and seek advice from other traders in the Telegram group @ATAS_Discussions.Information in this article cannot be perceived as a call for investing or buying/selling of any asset on the exchange. All situations, discussed in the article, are provided with the purpose of getting acquainted with the functionality and advantages of the ATAS platform.

