Markets constantly develop, change and ‘grow’. If you will not ‘grow’ in your ability to trade in a system manner, sooner or later it will end with losses.
Regular analysis of your trading helps to improve your trading system (TS) and adapt it to the market. In this article, we will speak about types of coefficients for TS analysis and how to use them for achieving a stable capital growth.
Read in this article:
- How to analyse your trading.
- What average profit-making and average loss-making trades are.
- What the profit factor is.
- What the recovery factor is.
- What the Sharpe ratio is.
- How to increase stability of your trading.
How to analyse your trading
It is important for a beginner trader to understand that it is necessary to summarize results of your trading at least once a month, faithfully answering the following questions:
- What was bad during the past month?
- What mistakes were made?
- What was good during the past month?
- What could be updated and improved in the trading system?
In which 3 important factors exist:
- number of analysed trades;
- period;
- psychology.
Why is the trade number factor important?
A representative selection is required for the analysis results to provide faithfulness. The recommended number of trades, which should be analysed with the help of statistical methods, is minimum 100.
Certainly, these trades should be executed by common rules. If you traded under influence of emotions and changed the entry/exit, capital management or risk management rules, the resulting data will not be correct for assessing efficiency of the trading system.
Why is the time factor important?
Seasonality, periods of holidays and vacations, and periods of high volatility, flats and trends exist in all markets. You need sufficient time for collecting adequate data, so that the system could pass all these periods and show its efficiency under different conditions.
2-3 months might not be enough. The optimum period could be 1 year. The most recent year data will have priority, since if the system has worked for 2-3 years, it might not give the same results in today’s market.
Why is psychology important?
Because the pain, caused by loss, fear, greed and other psychological vices of a trader, could influence the quality of the collected trading system data.
We recommend you to collect statistical data on the demo account or on a small real account, losses on which would not be painful.
How to analyse the collected system data?
Statistical analysis allows you to understand how stable and efficient the trading system is.
You may calculate basic statistical indicators in:
- Excel on your own;
- specialized services for traders;
- trading platforms.
For example, the trading and analytical ATAS platform has the Statistics module under the Accounts tab:
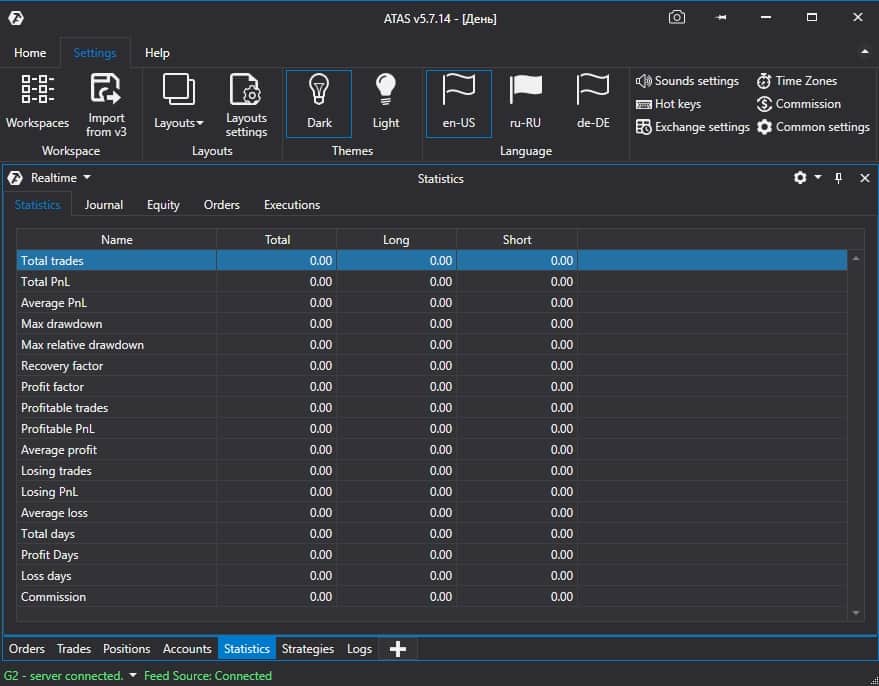
Let’s consider several important statistical indicators, which show the system stability and its readiness for trading on the real account.
Average profit-making trade and average loss-making trade
Average Profit-making Trade (APT) is calculated as a sum of all profitable trades in dollars or ticks, divided by a number of profitable trades.
Average Loss-making Trade (ALT) is calculated as a sum of all negative trades in dollars or ticks, divided by a number of negative trades.
You should analyse APT and ALT and compare dynamics of their correlation at least once a month.
It is preferable that:
- APT is bigger than ALT in dollars;
- APT is bigger than ALT in ticks;
- APT to ALT correlation both in ticks and dollars is more than 1.5. It would mean that the average profit exceeds the average loss in 1.5 times and the system has the ‘strength margin’.
Of course, the system could be profitable even if APT is less than ALT. Then, the resulting profit is formed due to a significantly more frequent occurrence of profitable trades.
However, we recommend APT > ALT. This would mean that the system has the so-called ‘alpha’ or trading advantage, which, in its turn, means that entry/exit points are selected correctly.
Why is the APT to ALT correlation in ticks important?
Because there could be a situation when the system shows a profit due to the risk capital management. Gamblers behave like this when they want to ‘win back’ and they increase the trade amount if they feel that the next moment will be lucky. This is not the system trading and we recommend you to avoid such decisions.
What is the profit factor?
Profit Factor (PF) is a statistical indicator, which shows how many times the profit is bigger than loss. It is calculated through dividing the sum of all profitable trades by the sum of all loss-making trades.
This simple indicator helps a trader to see a prospective trading system and make a choice when comparing. If PF > 2, the TS could be considered stable and prospective for the use.
The minimum acceptable value of the trading system profit factor could be 1.6. If PF is lower, the system is vulnerable and it might cease to be profitable if the market situation changes.
What is the recovery factor?
Recovery Factor (RF) is a statistical indicator, which is calculated through dividing the aggregate profit by the maximum drawdown. This indicator is important in assessing the TS stability.
In fact, RF shows how fast the trading system may exit from the maximum drawdown.
- If RF is more than 2, the system has a certain profit margin and you might consider this system for trading.
- If RF is less than 2, it is better to update it, since its stability is questionable.
- If the system’s RF is more than 10, you can consider this system stable and use it with a bigger capital.
What is the Sharpe ratio?
Sharpe Ratio (SR) is a statistical indicator for risk assessment. It is calculated as a relation of the trading system returns to the standard deviation of returns.
SR shows what profit a trader could make with relation to the assumed risk under the TS.
Example. If the Sharpe ratio is 0.5, it means that for making USD 50 profit a trader may put at risk potential USD 100 of losses.
This ratio could be a good assistant when you make a choice between two TS.
- If SR < 0.1, it is better to continue updating this system, since the risks are too high in relation to the potential profit.
- If SR > 0.1, you could use the system on the real account but with a limited amount of funds.
- If SR > 1, you can consider the system to be stable and use it to the utmost with your whole working capital.
How to increase stability of your trading?
Let’s assume that you conducted analysis of your TS and it showed unsatisfactory results.
Then it becomes evident that you need to improve your system’s efficiency by increasing profit and decreasing risks:
- Collect the TS statistics on various time-frames and instruments;
- Change the TS parameters;
- Compose portfolios of several TS. Statistical indicators of a portfolio could be higher than statistical indicators of an individual system.
Conclusions
System trading is a path to your gradual long-term survival under tough competitive conditions.
Before you invest serious money into the system, check it for stability, since if the TS shows bad statistical indicators, it may bring losses in the event of a slightest market change.
This is like a car, which is designed to ride on good roads in cities. If it moves off the road, it might get stuck. So, a TS with good statistical parameters is like an off-road vehicle, which can safely ride on-road and off-road.
The following main thoughts of this article will help you to increase quality of your trading system:
- collect the TS data on the demo account for not less than 12 months;
- APT should be bigger than ALT;
- profit factor should be more than 1.6;
- recovery factor should be more than 2;
- Sharpe factor should be more than 0.1;
- compose portfolios of several TS on various time-frames and instruments, increasing, in so doing, your trading stability.
Develop stable trading systems – the market off-road vehicles!
Information in this article cannot be perceived as a call for investing or buying/selling of any asset on the exchange. All situations, discussed in the article, are provided with the purpose of getting acquainted with the functionality and advantages of the ATAS platform.