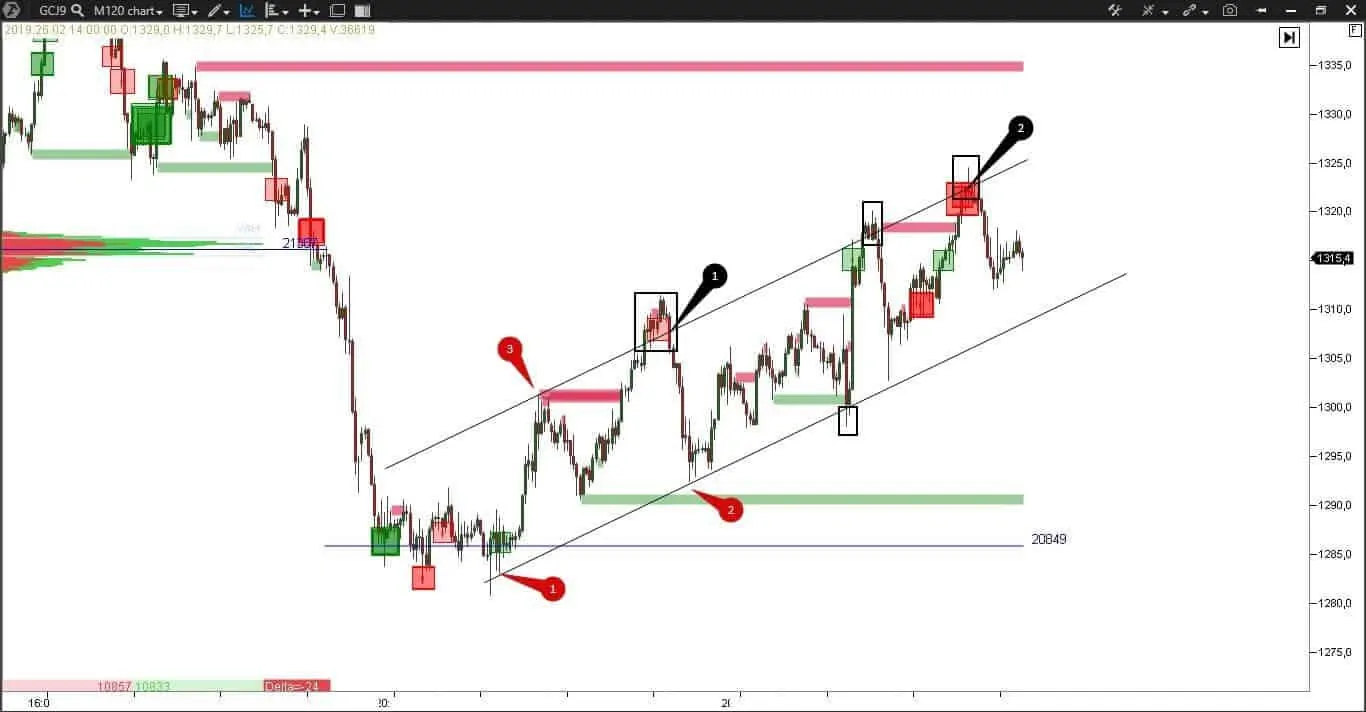
Gold price analysis with indicators for volume analysis.
“Without a doubt, more people follow the price of gold than any other commodity in the world” Larry Williams
In this article, we will discuss what indicators are the best for efficient analysis of a gold futures.
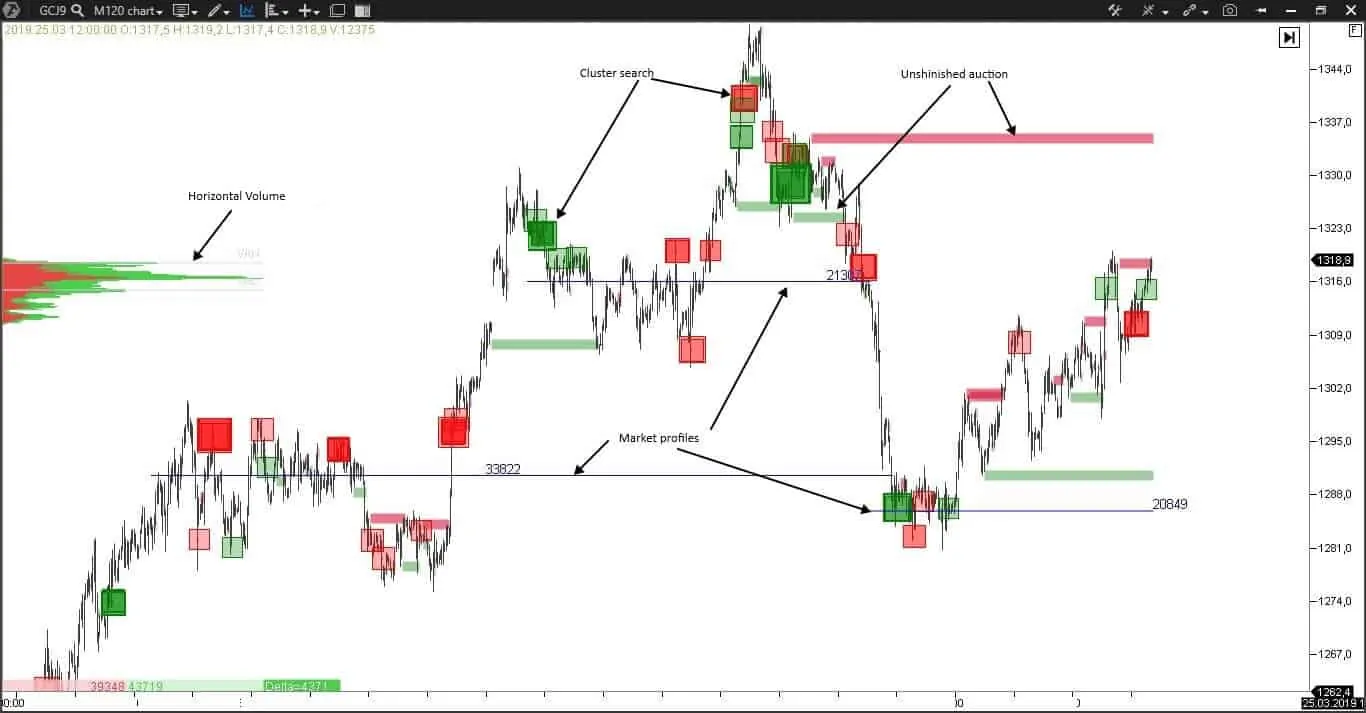
We have a 120-minute gold futures (GCJ9) chart with the following indicators: cluster search, market profile, unfinished auction and horizontal volumes.
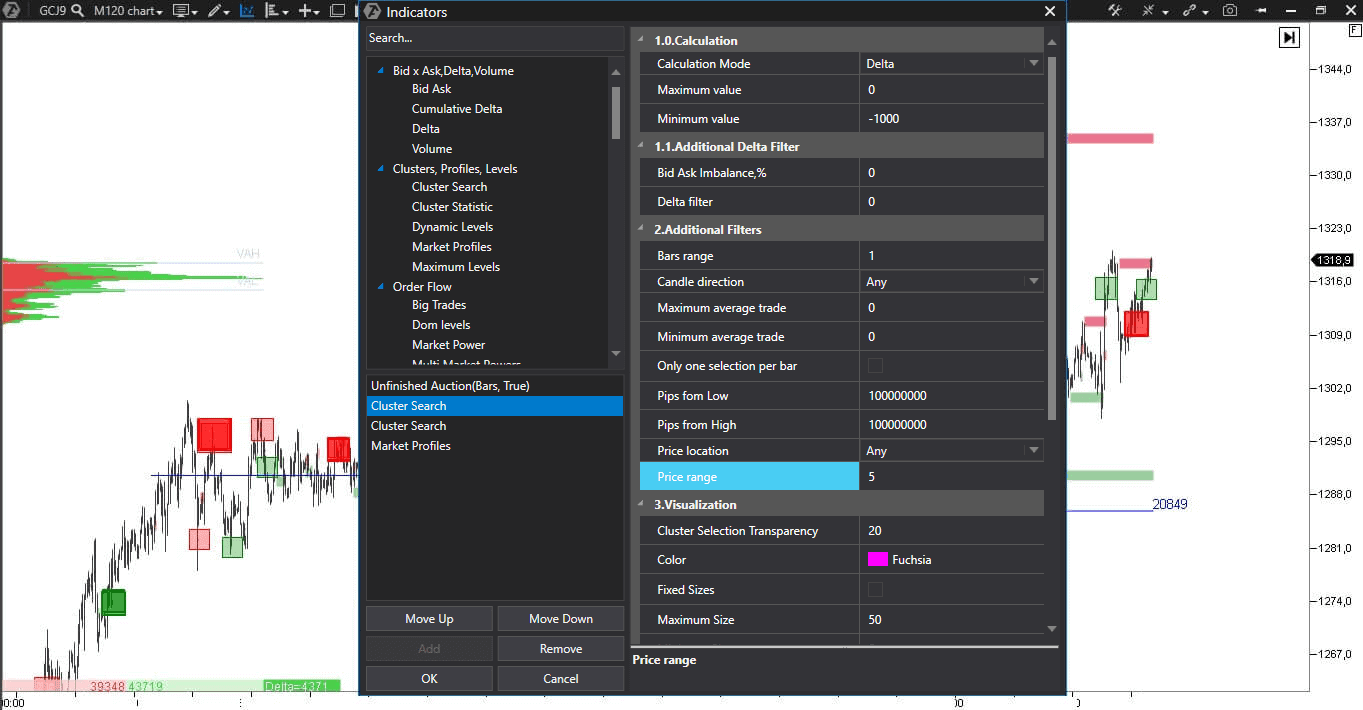
It is important for us, as traders, to understand what sellers and buyers do in key points in the chart. For this purpose we will use the cluster search indicator, which searches for the clusters we need using the set criteria. We set two cluster search indicators:
- the first one searches for clusters with the delta of more than 1,000 contracts and marks them with a green rectangle. The bigger the rectangle is, the higher the delta value in this cluster is. It will help us to see where the overweight of buyers over sellers was.
- the second one searches for clusters, where the delta is less than 1,000 contracts and marks them with a red rectangle. The bigger the rectangle is, the lower the delta value in this cluster is. It will help us to see where the overweight of sellers over buyers was.
Remember that the delta is a difference between aggressive orders, that is market buys and sells. Aggressive orders should move the price, that is why we additionally need to trace the price reaction to emergence of big clusters. Any chart has levels, which are of special interest for traders and the cluster search indicator visualizes such levels. It is easy to set the indicator and, if you are not sure in yourself, you can use readymade templates in the ATAS platform.
Looking at the current price dynamics and big clusters, we can make a conclusion that the sellers still cannot change the ascending tendency, since big sell clusters either move into the loss-making zone or the price starts to grow again after a short-term fall. Buyers win at the moment in this fight between the buyers and sellers.
The market profile indicator builds market profiles on different time periods. Here we use this indicator for displaying monthly levels of the maximum volume. Systematic growth or reduction of levels tells us about the trend state. The current location of monthly levels of the maximum volume warns us that the price is in the range, that is we observe neither gradual growth nor gradual reduction.
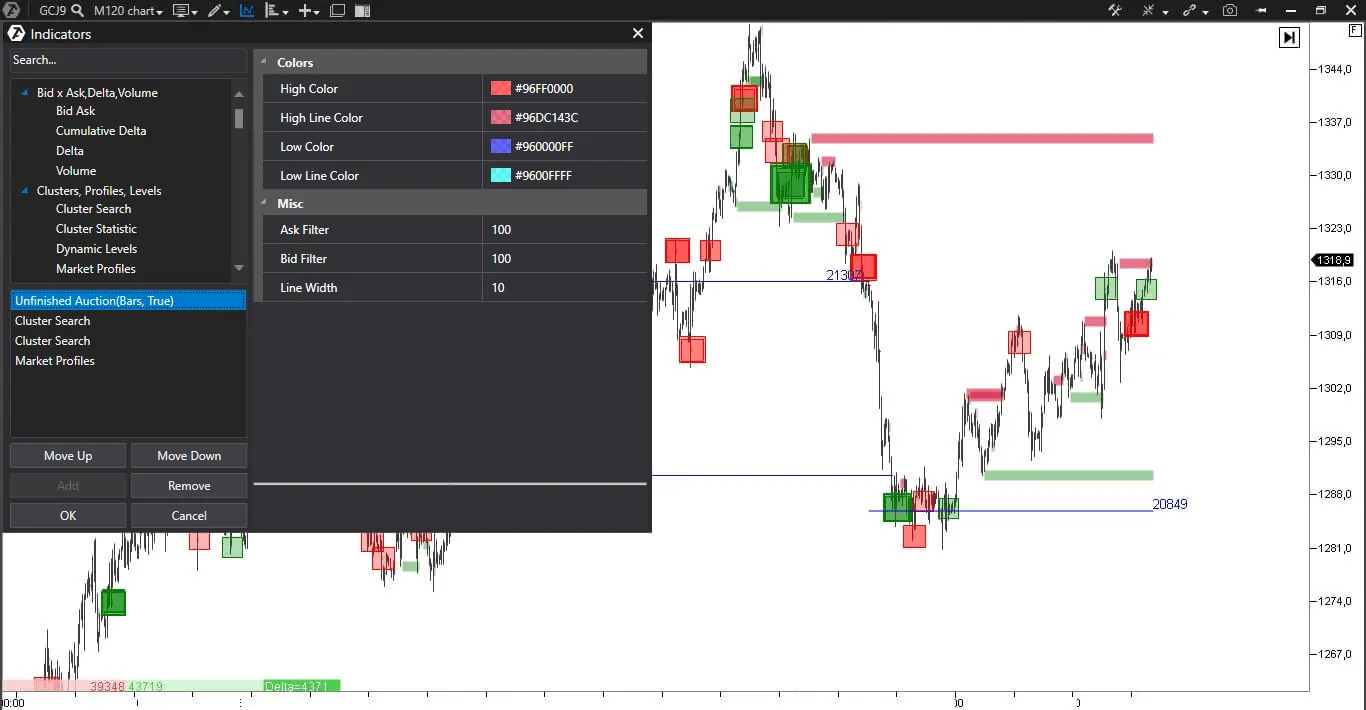
The unfinished auction indicator highlights levels at the candle high and low, where there are simultaneous buys and sells. These levels are called an “unfinished auction” and, with high probability, the price will come back to them “to finish the auction”. Levels at candle low are green and they are red at candle high. You can find this pattern only in the footprint charts. For gold we use values from 100 contracts in the indicator for asks and bids.
We use different indicators in order to visually mark those levels, which attracted attention of major players. The price will slow down at these levels, test them and, perhaps, reverse. Coincidence of several indicators at one level increases its significance for the market.
A gold futures is traded within the range of USD 1,280-1,350 on a middle-term period of 3 months. This range is reduced to USD 1,290-1,335 with the help of the unfinished auction indicator. We should monitor these levels more attentively, since we can enter here into a trade on a level bounce with a low risk level.
A short-term picture is a bit different – the price is in the ascending channel from the beginning of March. The bullish trend persists until the highs increase. Note big sells, which emerge at the upper boundary of the channel. Such clusters could be used for confirmation of the position opening in the required place.
Note that despite the emergence of big trades at the channel resistance, the price still continues to move upwards to the level of 1,335, where we have an unfinished auction. This level will be an important goal for the growth, since the price often reverses at such levels and a bounce takes place.
Long-term traders might also take into account a seasonal nature of gold.
Based on the historical data, the gold becomes more expensive in the second half of the year, starting from July.
Drawing a conclusion we can say that gold is in the ascending trend with the goals in the area of 1,335 and 1,330 with a major splash of buy clusters, which failed to protect the market from going down. Actions of sellers should be monitored at the test of these levels. The ascending trend could be broken again if they win.
You are ahead of other traders if you have modern software, since you are able to use unique indicators instead of a classical technical analysis.

