How the order book works. A BitMEX example with explanations.
In this article we will speak about a very interesting subject – interaction between the Time and Sales Tape and market depth (order book). To do that we will use an example of the XBTUSD cryptocurrency pair behavior in the ATAS Crypto platform. A highly volatile XBTUSD futures is traded on the Bitmex exchange and is similar to the Bitcoin/USD pair.
You can download the ATAS Crypto clicking this link: https://atas.net/atas-crypto/
Setting the Time and Sales Tape
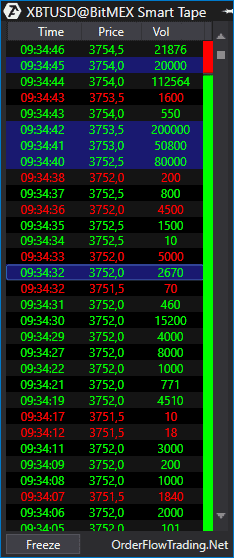
To analyze the market we would need a time and sales tape. This tape is a chain of successive buy and sell trades, which is displayed in the form of a table where new trades push the previous ones downward.
Create a new chart of the XBTUSD cryptocurrency pair from the Bitmex exchange. In order to open the tape, mouseover the chart, click the right mouse button and select New Linked Window > Tape.
By default, the tape shows the following data:
- Time;
- Price;
- +/-;
- Vol (Volume);
- Bid;
- Ask;
- Sizes;
- Avg (Average Volume);
- OI (Open Interest)
In order not to overload the tape with data, we will keep the necessary columns only. Mouseover the tape and click the right mouse button, select Columns and uncheck all columns except for Time, Price and Vol (Volume).
The tape movement speed depends on a liquidity of the instruments, number of market participants and number of high-frequency software robots. The tape moves very fast on popular instruments and it is necessary to adjust the filter, which would filter out small trades, in order not to miss an important moment.
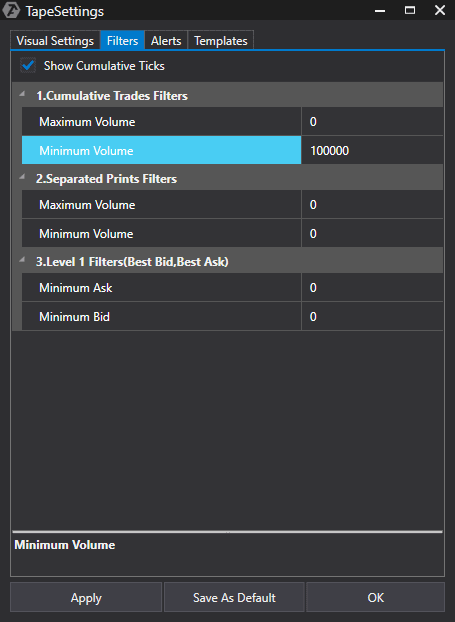
To do that mouseover the tape, click the right mouse button, select Settings, select the Filters tab and set Minimum Volume in the Cumulative Trades Filters to 100000. This setting will be different for other currency pairs and could be selected experimentally.
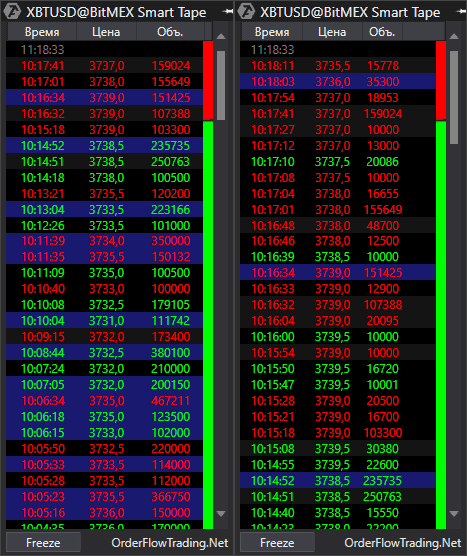
Now the tape reflects only those trades, the aggregated volume of which is more than 100,000 contracts. This setting allows concentrating on major aggressive volumes. For your convenience you can create several tapes where the filter of aggregated trades will infiltrate trades with a higher or lower volume in order to break the major aggressors down for clarity.
This is how we set visualization of aggressive market trades.
Setting the Order Book
Now we need to visualize passive limit orders in the order book. To do that, make the following steps:
- Download the BitMEX DOM Levels Snapshot using the link: http://bit.ly/2N9wB7n;
- Put the downloaded file into the following folder: …DocumentsATAS Cryptosnapshots;
- Mouseover the XBTUSD@BitMEX chart in the ATAS Crypto platform, click the right mouse button and select Template;
- Select the Snapshots tab and then select the BitMEX DOM Levels Snapshot and press the Load button.
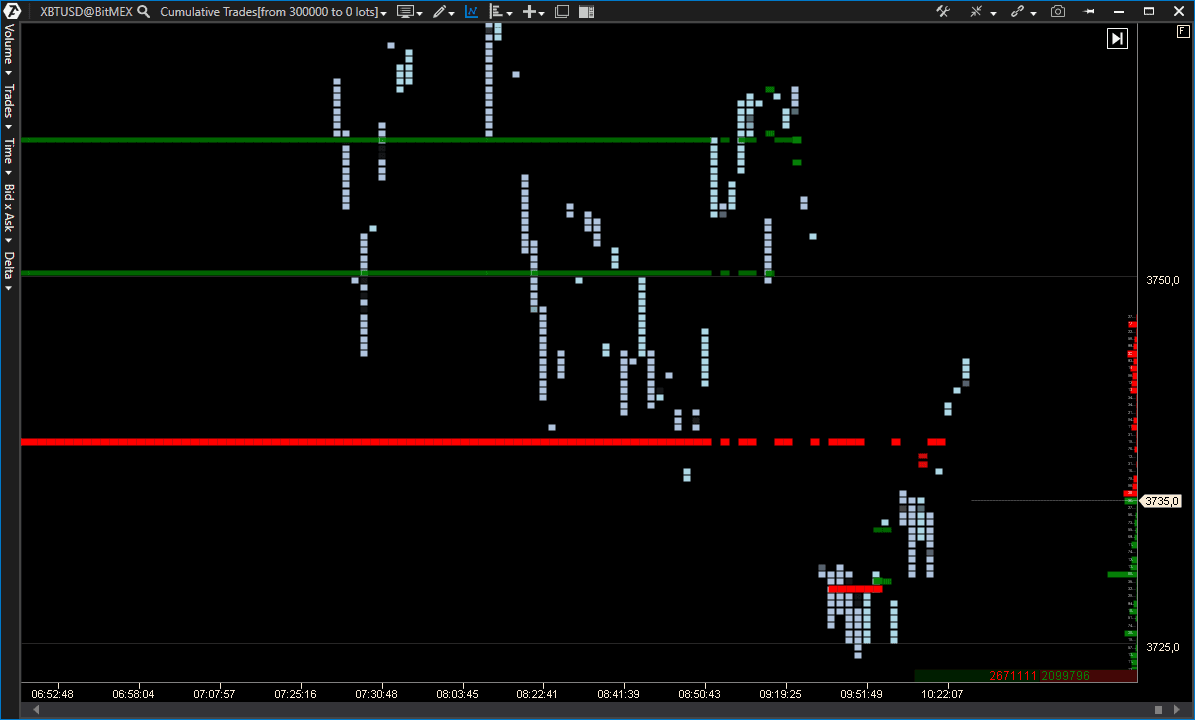
Perfect. Now your chart should look like this:
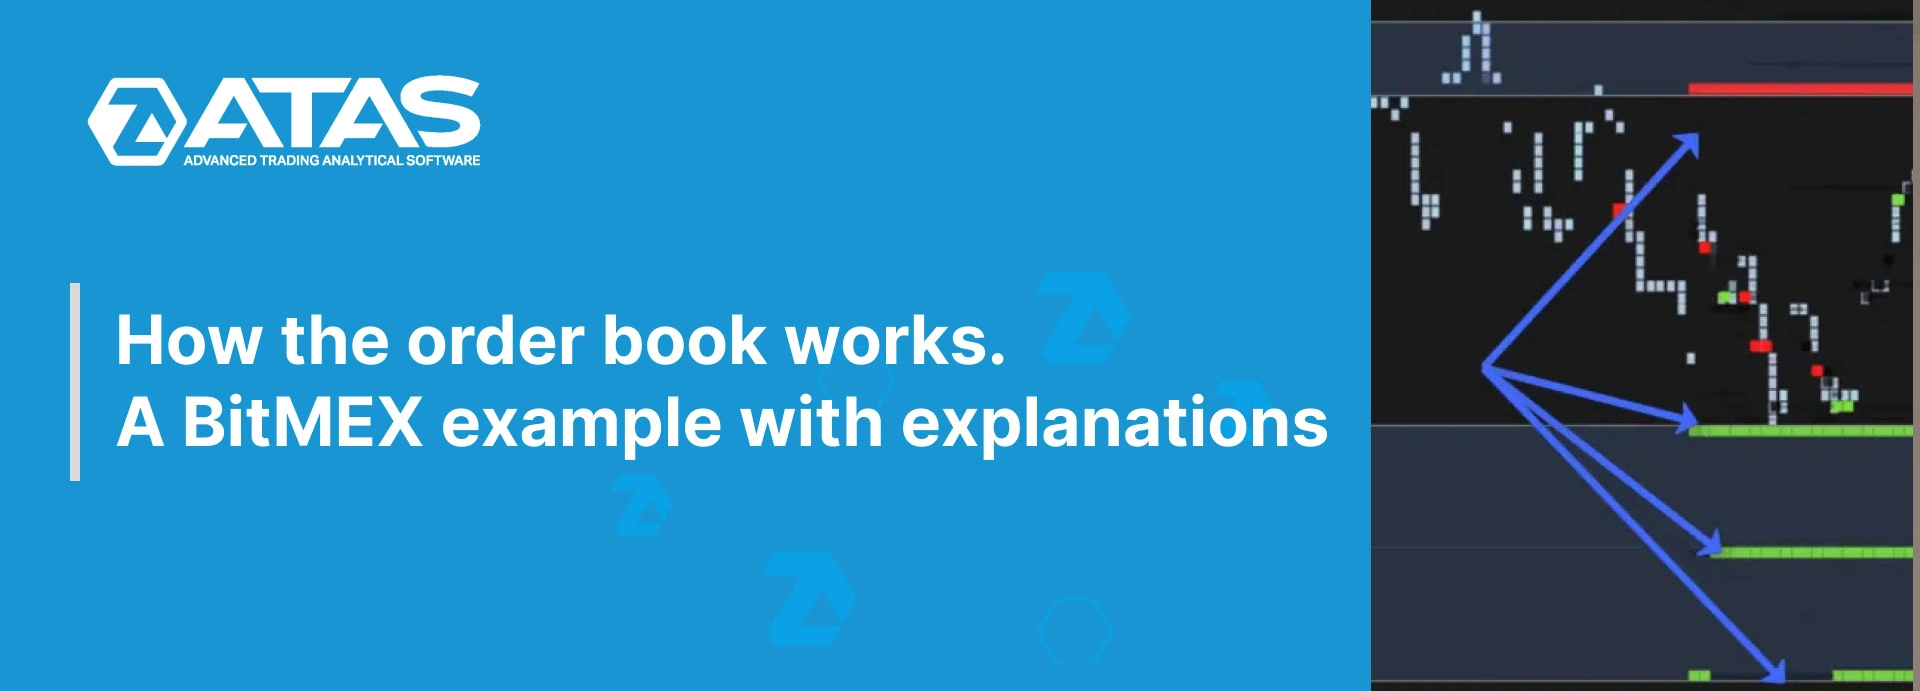
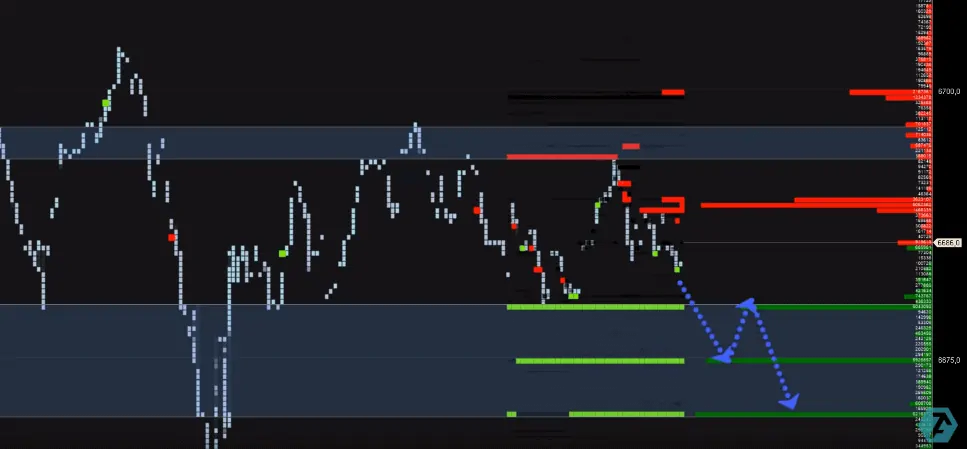
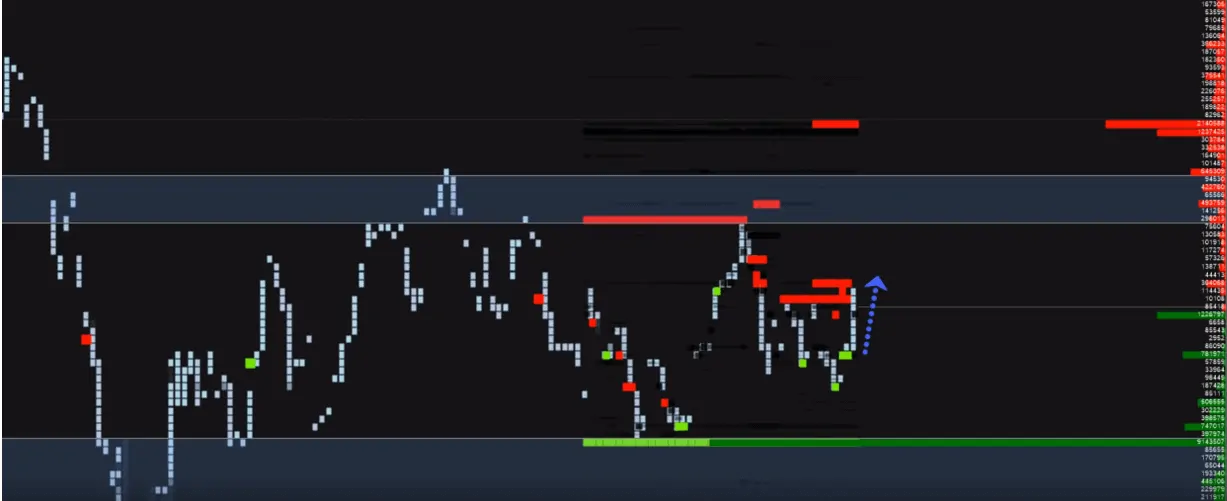
A specific feature of this template is the DOM Levels indicator, which visualizes major limit orders from the order book in the form of horizontal green and red lines (levels). A filter is set for the DOM Levels indicator for more than 1,400,000 contracts, so that the chart would show only those levels, which have a big number of limit orders. Later, such levels might stop the price movement.
The order book is shown along the right edge of the chart. It is presented in the form of a red-green vertical bar chart. The green horizontal bars below the current price show accumulation of the buy limit orders. The red bars above the current price show accumulations of major sell limit orders. This bar chart is static in the picture, but in real time, in a “live chart”, it changes permanently, reflecting the market activity.
When the price approaches such an accumulation, it is important to pay attention to the tape and monitor how buyers and sellers act at these levels.
Analysis of the order book levels
If we look attentively at the chart and DOM Levels indicator, which reflects major orders in the order book, we may notice that the levels could be conditionally divided into two categories:
- Levels with major limit orders, which stay in the chart for a long time, and the market participants do not withdraw major orders.
- Levels with short-term limit orders and very often they emerge after breakouts or during focused trend moves, thus offering support or resistance.
It is important to understand, when you monitor the tape, that when big aggressive orders enter the market, the price should respond. And if you see that the price does not respond and does not move towards the market orders, it means that the price is held by limit orders from the opposite side.
That is why, when the price tests levels with a big liquidity, you should pay attention to the tape and interpret the price response after emergence of aggressive market orders.
It is necessary to see a breakout of the red level of DOM Levels for confirming the strength of aggressive buyers.
A breakout of the green level of DOM Levels is required for confirming the seller’s strength.
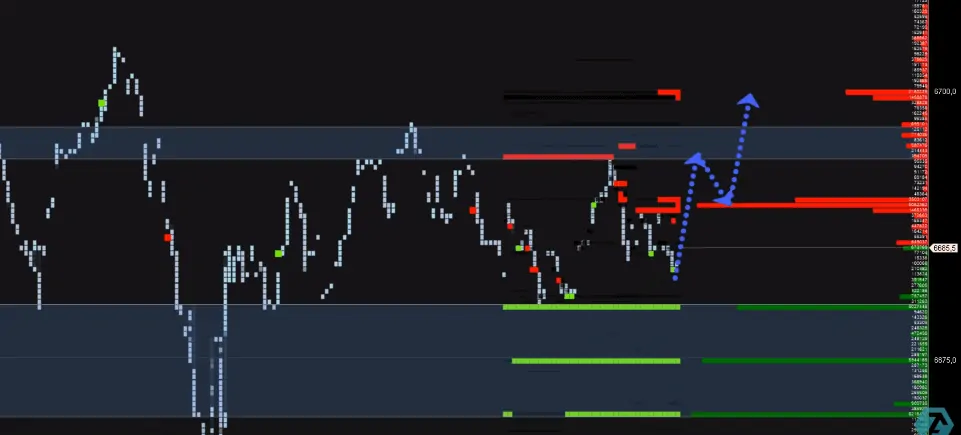
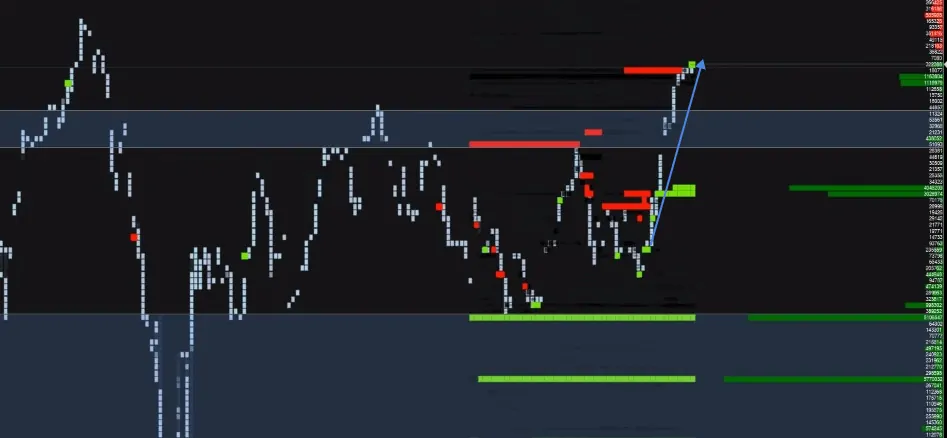
Also, please, pay attention to emergence of short-term support levels of the DOM Levels indicator, which usually appear after the upward breakout, that is a limit buyer tries to support the price. If this short-term support level in the order book manages to hold the price for some time, we can expect emergence of a wave of new aggressive buyers, who would join the starting price increase and would “race” the market upward.
A vivid sign of the market control by a buyer or seller is that all major cross limit orders are broken by the price.
If, at the same time, you observe pronounced bounces from the support levels and the market supports major buy limit orders during the whole period of growth, it is a bullish market behavior. And usually we could state a change of moods on the tape during attenuation of short-term downward movements (pullbacks) and predominance of major buy orders, which resume the growth.
Now the tape displays only those orders, the aggregate volume of which exceeds 100,000 contracts. This setting allows to focus on the large aggressive volumes. For convenience, you can create several such tapes, where the filter of aggregated orders will skip the orders with a larger or smaller volume, to divide the large aggressors, in other words – to compartmentalize them.
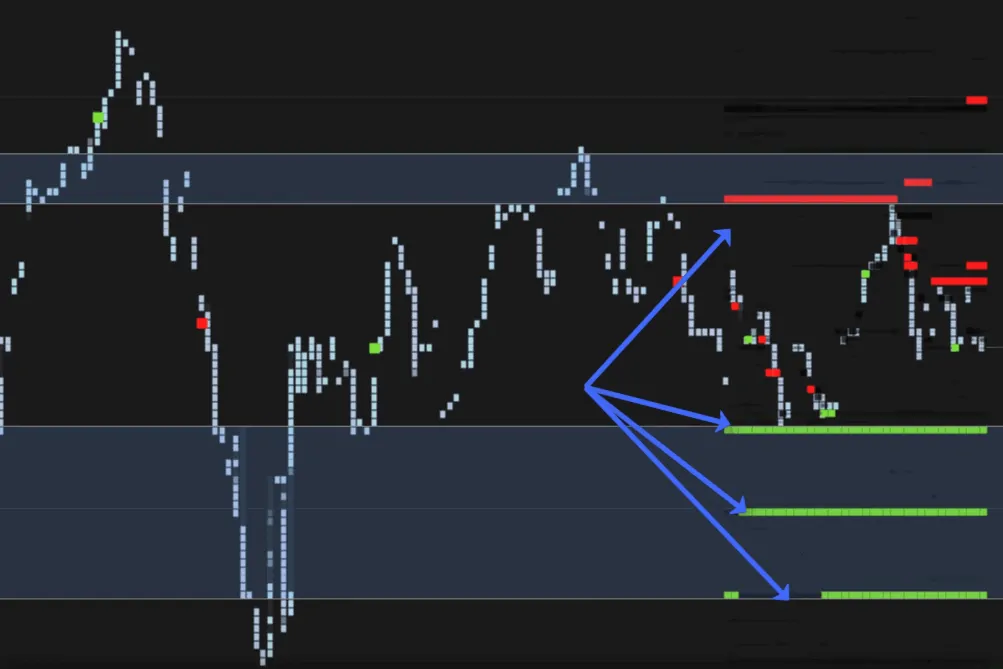
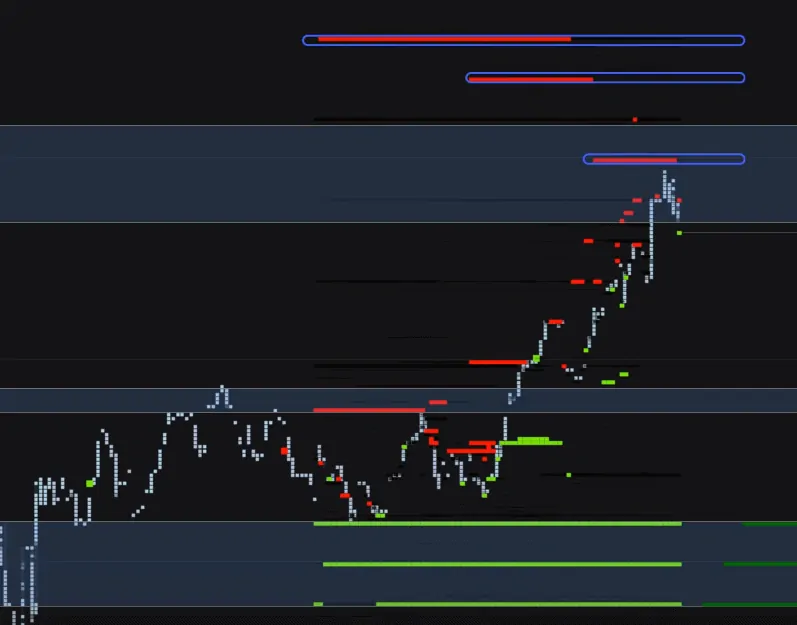
The price reached the levels, where major orders of a limit seller were posted in the order book, after a just another bullish impulse. Moreover, they were posted long before the price reached them.
Let us mark these levels with blue color in the chart below.
These levels might be reversal rather than short-term, that is why it is worth to concentrate on the buyers and sellers behavior at this level and attentively monitor the tape.
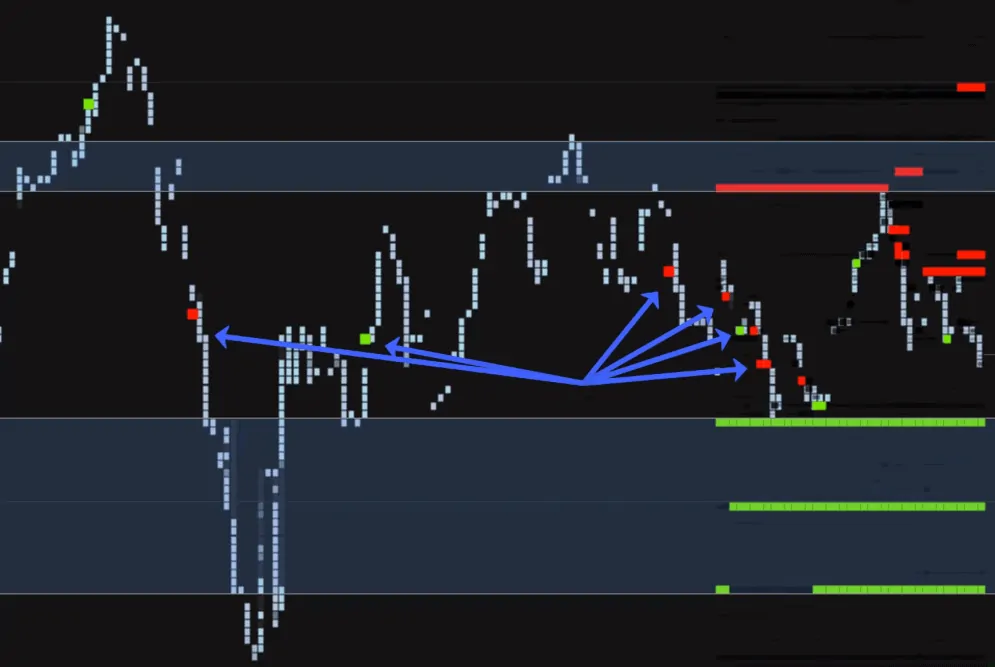
If this level is really interesting to the seller, we can see on the tape a reaction of an aggressive seller and reaction of the price after emergence of these major sells. Then the tape will be saturated with red color. Such a flow of aggressive sells should result in a downward impulse. Then we will understand that the seller snatched the initiative and the market entered into a correction.
If aggressive orders of the buyers enter the market, and it does not result in a growth and all buys at the market price would be consumed without increase of price quotes, this would tell us that a reversal can take place at this level soon. A major limit order for buying below the current price may serve as an additional argument in favor of the reversal. It is a fake support, which helps a major player to exit from buys and/or enter into sells.
Thus, analyzing activity in the order book with the help of the DOM Levels indicator, you can receive information about various key levels. Some levels would reverse the price movement. Breakout of other levels would point at domination of one of the acting parties.
Setting more rigid filters in the DOM Levels indicator would filter really strong levels, from which you should expect a pronounced bounce.
Using the levels, which are built on the basis of especially major orders in the order book, would allow focusing namely on those areas, which can produce a reversal.
Summary
So, understanding the principle of order consolidation and having such instruments of analysis as the Time and Sales Tape and DOM Levels Indicator at hand, an intraday trader can:
- track really important levels;
- find good points for entry with a minimum risk;
- notice, in due time, those moments when the market passes from the buyer’s control to the seller’s control and vice versa.
This allows acting in harmony with the market, managing your position, when the initiative changes.
One more note: the presented review of the crypto market is multipurpose. The described approaches to the tape and order book analysis can be applied in other platforms and for other time periods, since they act in the crypto market the same way as in the stock or futures markets.

