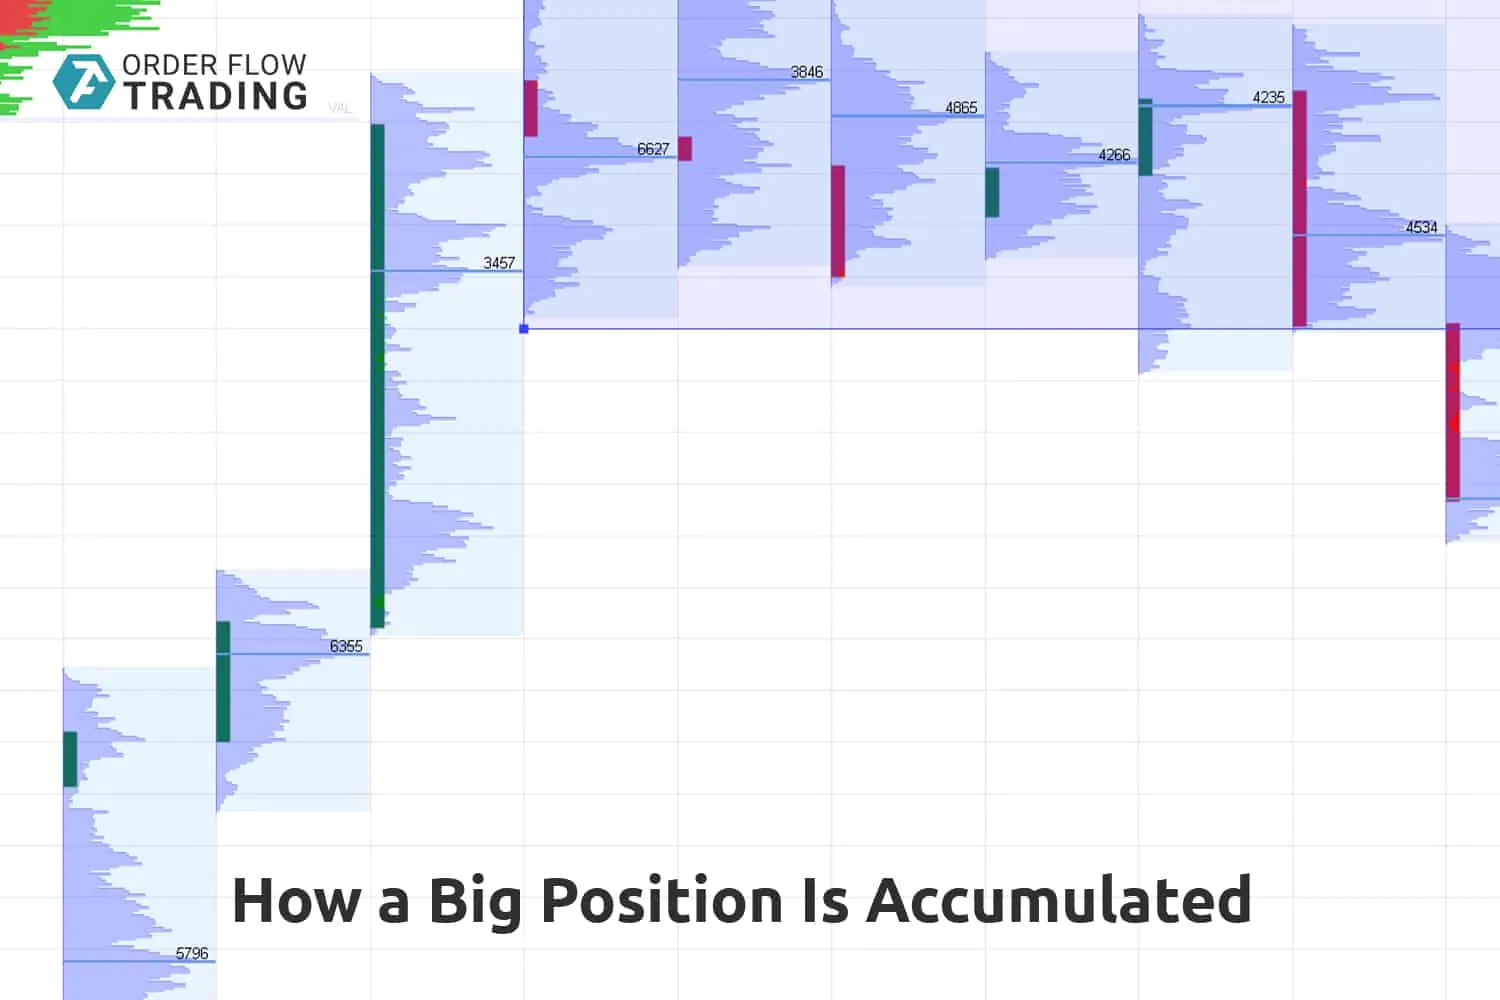
How a large position is framed
To catch a major player, you need to think like a major player.
In this article, we will try to put ourselves in the shoes of the manager of a big capital, so that we could read the chart better being a regular trader.
It is not difficult to notice a splash of volume in the chart, but it is not a trivial task to understand what it means. So, we will speak about how to solve this task.
Read in this article:
- Working logic of major market participants.
- How does a trend end?
- How does a position accumulate at the top (bottom) of the market?
- How does a new trend start?
Working logic of major market participants
It is very difficult for big investment funds, which manage billions of dollars, to permanently generate a significant profit for such big capitals. In order to provide their customers with a competitive yield, the capital managers have to handle very big positions. And it is more difficult than trading a couple of E-mini contracts.
What difficulties arise when trading big volumes:
- Noticeability in the market. If everybody notices what position a major market participant opens, the other major participants may start to lead the market in the opposite direction in order to make the competitor close his position with a loss.
- Sufficient liquidity. Any trade in the market has two sides – somebody buys and somebody sells. If some fund needs to buy a big position, there should be enough sellers in order to execute such a trade. The majority of markets have a limited liquidity within a short period of time.
- Price shift in the direction of accumulation of a big position. Active buys result in the asset increase and, consequently, in buys at higher unprofitable prices.
So, how should major market participants accumulate big positions at the most profitable prices, staying barely noticeable and having sufficient liquidity?
You need several factors for this:
- Time. A big position could be accumulated rather successfully only during a long period of time – from several hours to several days or weeks. Everything depends on the position size. Namely due to this reason we periodically see flats in the market, which could last rather long. Position accumulation by major players usually takes place during such periods.
- The other side of a trade. In order to accumulate a buy position, somebody needs to sell constantly. But how to involve more and more new market participants into trades, which a major player needs for accumulating his own position? He has to make false movements and imitate level breakouts, so that the majority of market participants would assume that the price would move, for example, down, while the major player accumulates the buy position. Namely that is why false breakouts of the range boundaries take place in bands – the major capital uses them for accumulating its position at the expense of other market participants.
- Relatively stable price. A major market participant tries to hold the price within a narrow range in order to accumulate the position at the optimum price.
- Media support. Quite often, splashes of activity in the market, which occur after publication of important news, are used by fund managers for executing big orders.
If you observe a band with clear boundaries, which stays steady for a long time, in the market within a narrow price range, there is a high probability that a position accumulation takes place before a strong trend.
How does a trend end?
Let’s see how the cycle stages take place: trend completion -> position accumulation -> new trend commencement.
We will use the ATAS trading platform for analysis. We will use its instruments to analyse:
- What takes place with volumes?
- How is a big position accumulated?
- How should this information be used in trading?
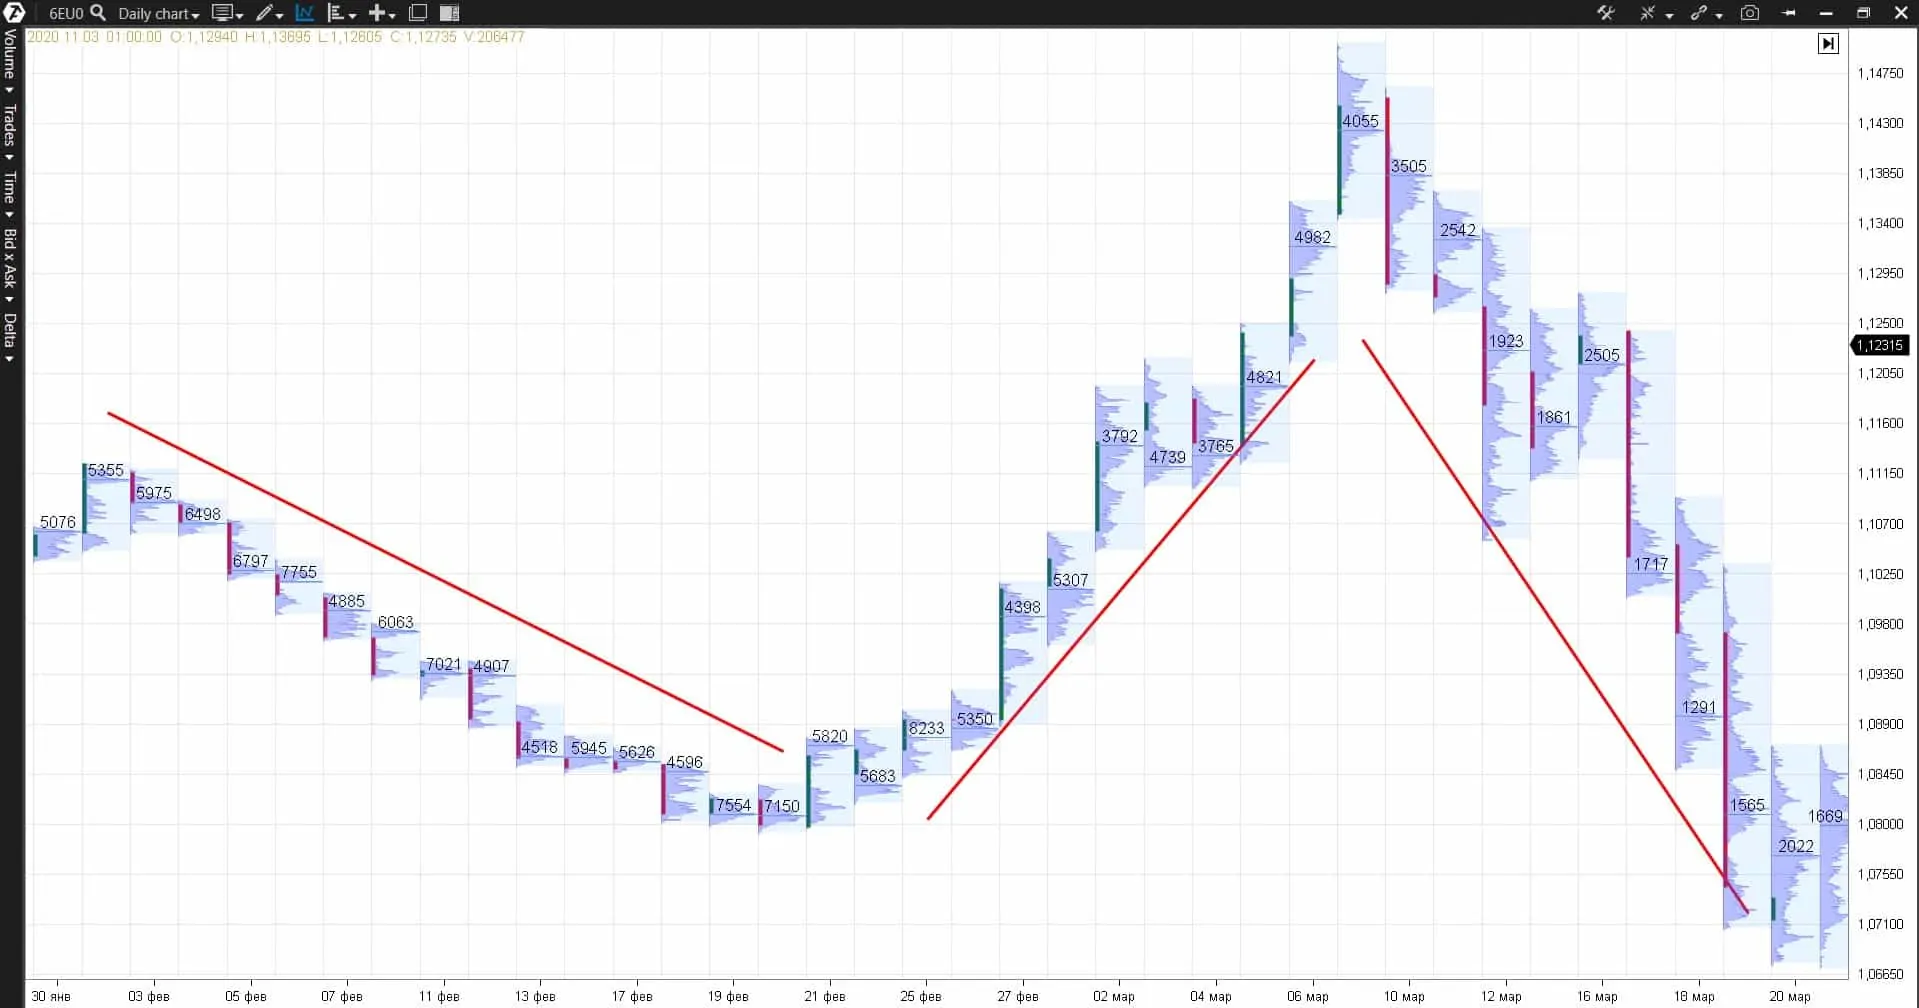
So, we take the EUR futures as an example. There is a steady bearish trend in the daily chart:
Characteristics of a steady downtrend:
- every next low is lower than the previous one;
- every next high is lower than the previous one;
- the day closure tends to be closer to the low;
- Point of Control (POC) is the level of the day’s maximum volume (marked with a number in the chart) located below the previous days’ POC levels.
What could be a warning signal of the trend completion:
- daily candles cease to be trend ones and start to be flat ones;
- the price stands still making false breakouts of previous extreme points. Daily candles start to cast long shadows but the trend doesn’t renew;
- POC stays, approximately, at the same place.
All these signs tell us that, perhaps, a major market participant stops to move out of the current trend and starts to accumulate his position for the reversal movement.
Every such stop in a trend could be a reason for you to be more careful, since a reversal probability increases. Often, the best solution in such cases would be to shift the stop loss for profit protection and not to open new trades along the trend.
So, how does a market reversal take place?
- POC moves above the previous days’ maximum volumes;
- the price renews the high and doesn’t renew the low;
- the closure takes place closer to the day’s high.
A reversal at the market peak takes place similarly.
Further on, a new trend may immediately start to develop or the price may go into a flat for continuation of the position accumulation process.
How does a position accumulate at the top (bottom) of the market?
Big position accumulations should take place before big movements.
However, it is also important to understand that when we speak about the market, we always speak about probabilistic events. Events may develop one way in 60% of cases but the scenario could be absolutely different in 40% of cases.
However, if you understand the market development and you are able to forecast it with the 60% probability, you can make money on a stable basis if you also add the correct risk management and capital management.
So, how does a position accumulate at the market peak?
When a position accumulation takes place at the peak, we can see in the chart:
- POC moves in the chequer-wise order – higher one day and lower the next day – but all of them fluctuate in a rather narrow range.
- There are many inside bars (daily ranges are between the previous day’s extreme points) with long shadows.
- There could be several false breakouts of levels during a day.
It would be a proper thing to apply intraday ‘band’ trading strategies, which look for entry points on the breakout from levels, during the periods when the range boundaries are clearly seen. However, you shouldn’t set long-term goals with this approach but should exit from trades on the other side of the accumulation band.
Daily trend strategies will not work properly during accumulation, since there are no big movements in the market and false breakouts are possible. That is why it is better not to trade by daily strategies during such periods.
How a new trend starts
The price moves out of the ‘band movement’ and a new trend starts after a sufficient position has been accumulated.
How a new trend starts to develop:
- exit from the accumulation trend takes place in the form of a trend unidirectional candle (marked with an arrow in the picture above);
- POC moves below the previous POCs and further on under the accumulation range low;
- closure of the candle, which broke the range, often takes place near the extreme point;
- cumulative delta for accumulation often shows direction of a probable range breakout.
Quite often, strong and steady trends occur in the volatile market and holding the trade during the whole trend could bring a significant profit. That is why, it is good if you have daily trading strategies, which follow the trend, in your trading strategy portfolio.
Conclusions
In order to be a steadily successful trader, you need to:
- understand action methods of major market participants;
- assess the current state of the market. Has a trend started or is there a preliminary position accumulation? Is the market under study inactive (you should avoid such markets).
When a position accumulation takes place in the market, then you’d better hold back from trading along the trend on the basis of daily charts and trade during the day on the basis of reversal strategies.
If a new trend started in the market, you should trade only in the trend direction, trying to hold your position as long as possible.


