
Volume trading strategy is one of the most popular search queries. Google produces more than 77 million results for this query.
And it is not an idle interest.
Study of the volume trading strategy extensively develops beginners. Future traders learn to:
- read charts and understand the market. Even negative experience is useful. If you learn that something does not work, you cut it off and become closer to the knowledge of what really works;
- keep discipline and control risks;
- develop plans and respect money management.
Classification of strategies
All strategies, with certain reservations, could be divided into 5 types:
- Trading in a range.
- Trading of a false breakout.
- Trading on a breakout.
- Trading on a trend rollback.
- Trading against a trend.
It could be conditionally stated that the first two are flat strategies, the next two are trend strategies and the last one is a counter-trend strategy.
Volume trading strategies are not an exception. The above classification is also true for trading with application of volume indicators.
In this article we will consider each of the strategy types and discuss:
- principles of their use;
- signals for entering into a long and sell on the basis of cluster and volume analysis.
Each of the strategies will contain a chart example from the real-life market. Apart from a standard indicator of exchange volumes, we use the following instruments:
- Delta (what Delta is);
- Zig Zag Pro. To get ideas for using the Zig Zag indicator, read the article about Weiss Waves;
- Market Profiles (what the Market Profile is);
- Cluster chart. This is a progressive type of presentation of information about the course of market trading, which reflects activity in the form of clusters;
- Fibonacci Levels (how to trade using Fibonacci retracement levels).
Let’s make an important statement before we start our review of volume trading strategies.
We will not consider the general market context in each example. In real trading, it is important for a trader to keep in mind the current market state from the point of view of a general picture. However, if we do it, the article would be too long and subjective.
Our goal is to collect various trading strategies and show the logic of possible trader’s actions and practical methods of use of the ATAS platform instruments.
Value judgement is applied in the strategy discussion. If you look for a strategy of the ‘sell when the red lamp is on and buy when the green lamp is on’ type, this article is not for you. We agree with a forgotten expert of the stock market George Selden, who wrote in the beginning of the 20th century:
“I believe that the desire to find a simple mechanical formula takes responsibility for the majority of losses on the exchange”.
One more thing. All trading strategies, which are considered further, are universal ones, which work in any markets/periods, of course, taking into account specific features of each instrument. Setups could be visualized in the charts in an endless number of variants, but the basic principles (such as demand and supply, and effort and result) stay the same.
No. 1. Volume trading strategy. Trading in a range
Logic. The strategy of trading in a range means that the market is inactive and the balance of demand and supply is stabilized. A trader doesn’t expect that the situation would change radically in the near future and decides to trade from the support and resistance levels, which manifested themselves in the chart:
- buying from the support level (lower boundary of the range) with the aim of take profit at the resistance level;
- selling from the resistance level (upper boundary of the range) with the aim of take profit at the support level.
Example. Buying Gazprom stock.
The Gazprom stock formed a long-term support level of about RUB 150 in November-December 2018. When the price moved down to this level in March 2019, the market became interesting for those who believed that the price would reverse up and enter the same range with peaks at about RUB 165.
We will consider the March reversal into the range from the support of RUB 150 in an hourly timeframe chart (remember that it is done without analysis of the general historical context).
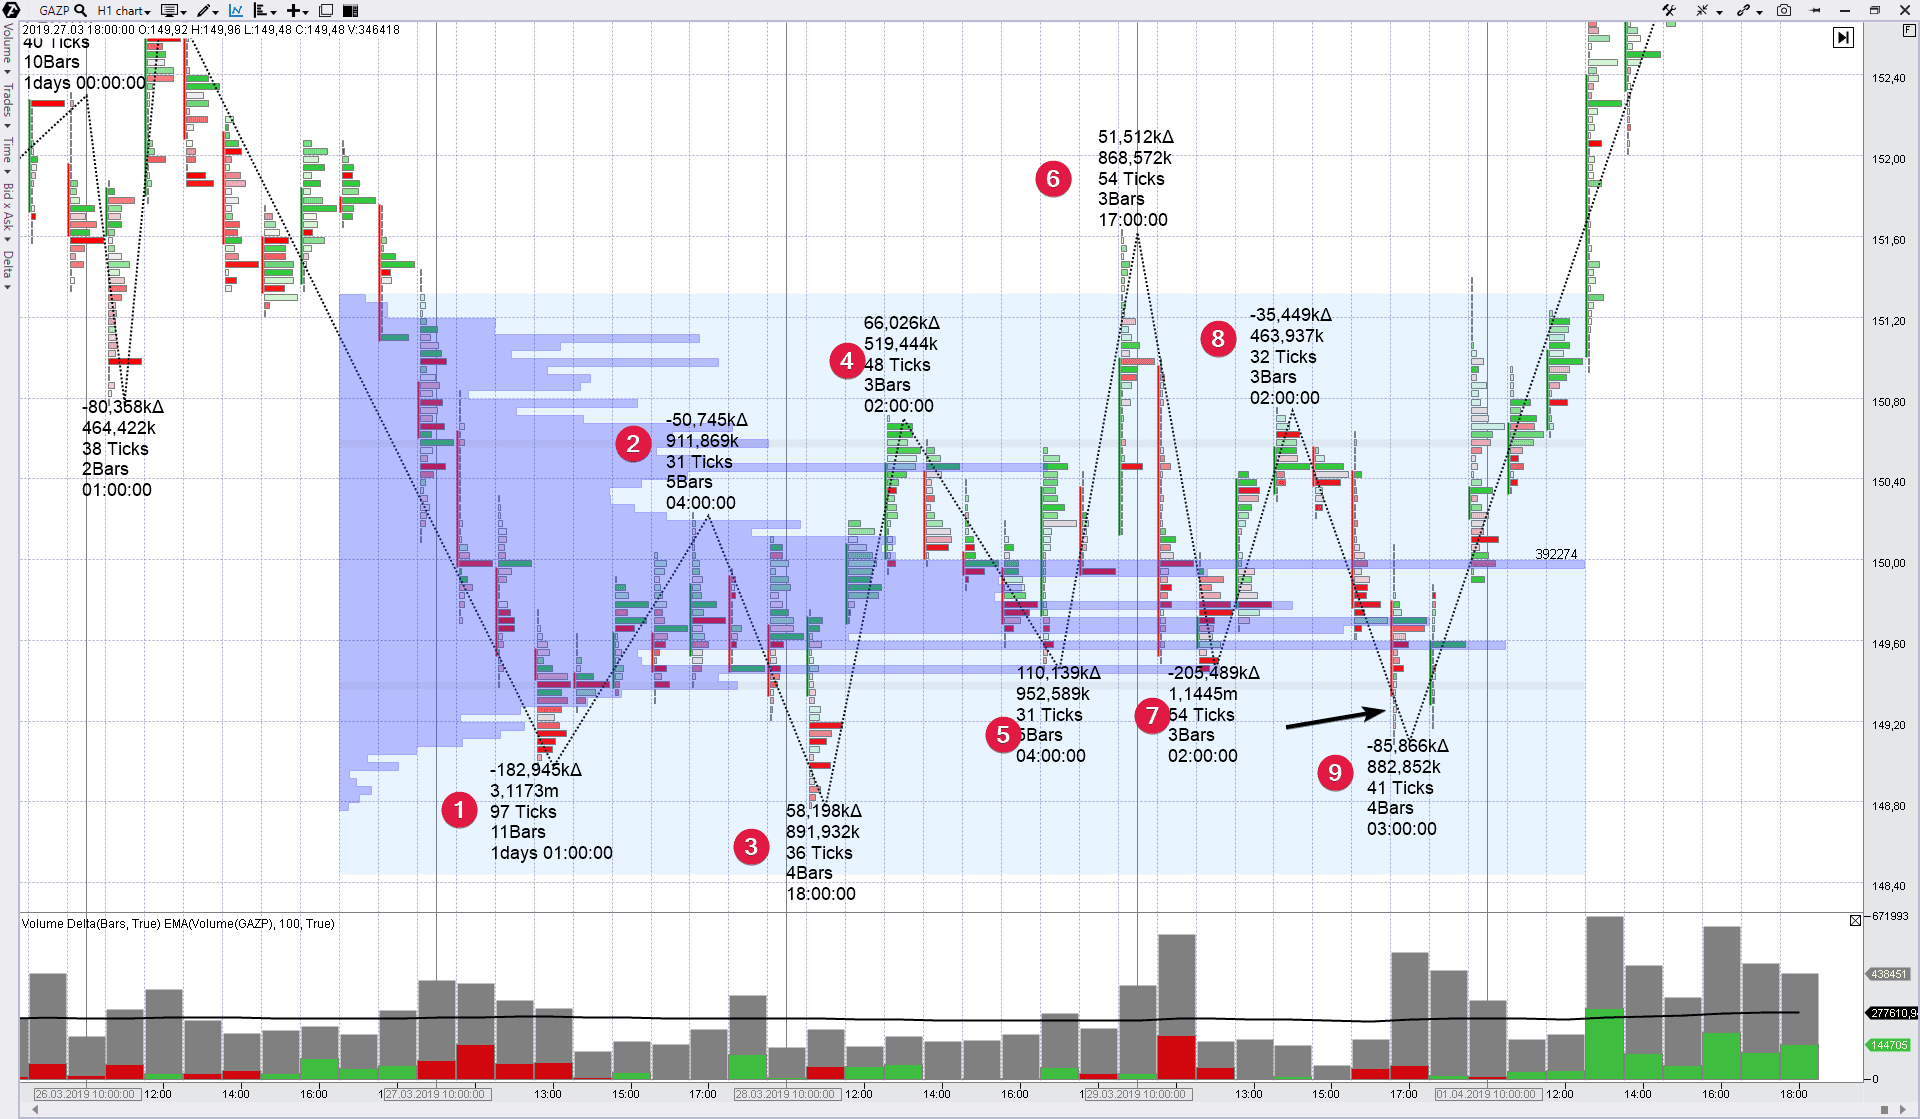
The chart has the following indicators: Zig Zag Pro, Delta (the difference between buys and sells) and Market Profile, which covers the reversal area.
How should a trader understand that a real reversal from the round support level of RUB 150 takes place with coming back to the range, which acts on long periods? To build his analysis on facts.
- First fact. Absence of the market’s wish to develop decrease of March 28 (bottom of wave 3) and fast restoration to the day’s highs above 150. This provides a ground to assume that massive red clusters at the wave 1 low is Panic Selling, which, as a rule, ends the downward movement and starts formation of the upward reversal. And bottom 3 is just a trap for bears who lost in this situation.
- Second fact. Wave 9 has the lowest volume (882 thousand) among the previous downward waves. This allows to assume that the selling pressure is exhausted and the market is short of a ‘fuel’ for downward movement. Most probably, the panic sells, caused by reduction of price quotes below the psychological level of 150, have been engulfed and the market is not interested in the further downward movement. The arrow shows how the downward tail becomes thinner on the clusters. There are no traders there who wish to sell low.
- Third fact. A strong opening with a small upward gap on Monday on April 1.
- Fourth fact. The profile looks like letter ‘b’.
Using the above facts a trader makes a conclusion that the market has less chances to break the POC (Point Of Control) level around 149.5-150 and, most probably, it would go higher. This is how the entry into a long position after the market opening on April 1 is justified.
The stop could be taken below the low of the reversal formation, say, to 140.40. The aim is the previous highs around RUB 165. An approximate relation of reward to risk is 4.5-1.
Example 2. Selling a EUR futures.
Events of the end of June 2019 provided us with a setup for trading of the reversal from the resistance level. We speak about the market of EUR futures contracts.
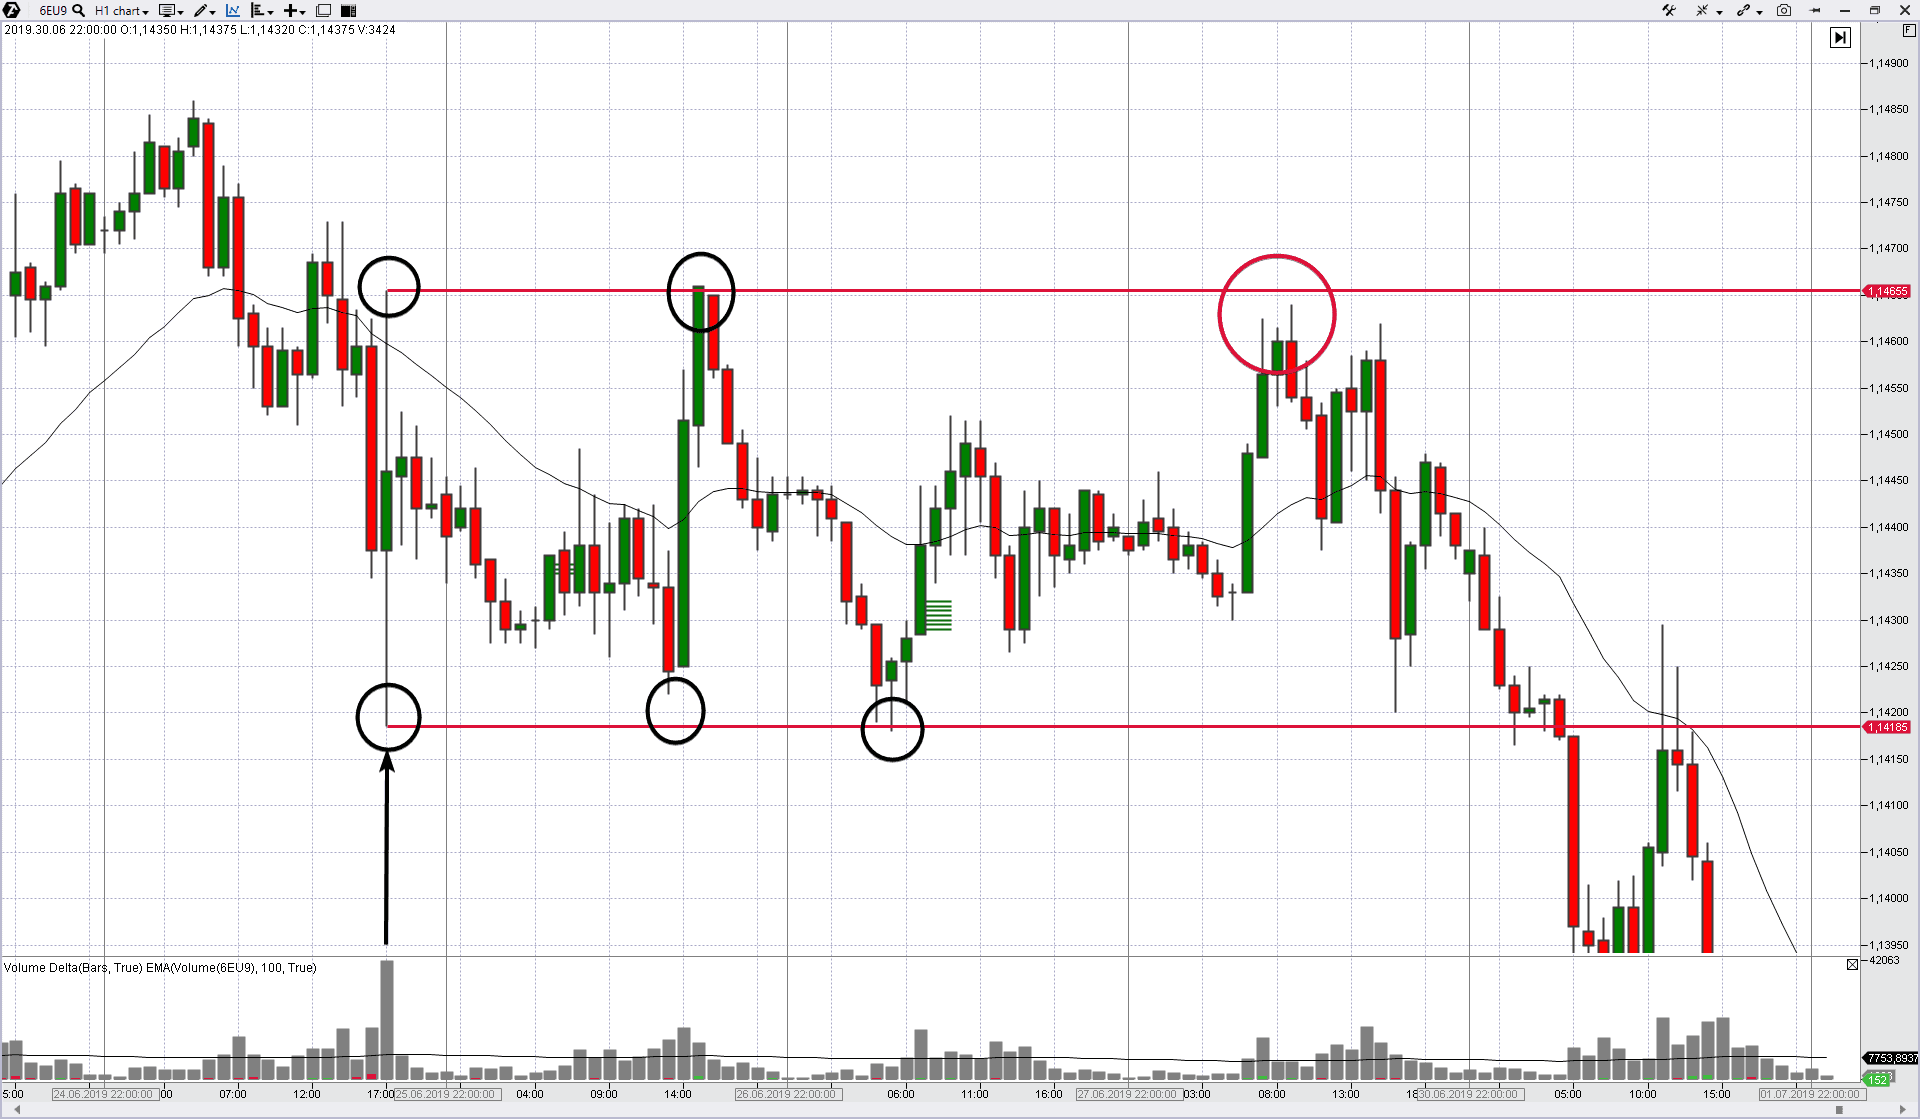
The Chairman of the Board of the Federal Reserve System Jerome Powell made a speech on Tuesday June 25. We will not discuss the topic of the speech, just note that the market perceived this event very vigorously. The arrow points at the candle with a high volume and marks the market reaction at the moment when the Chair of the Federal Reserve made a speech.
Figuratively speaking, ‘boiling’ started after a thundering splash. The price tested extreme points of the ‘news’ candle several times during the next two days and returned to the balance, having formed the clear range contours.
The red oval shows approach to the upper boundary of the range on the third day – on Friday on June 28. As we can see post factum, the price reversed down. But we are interested in the process mechanics. Let’s consider the reversal in detail during a fast period.
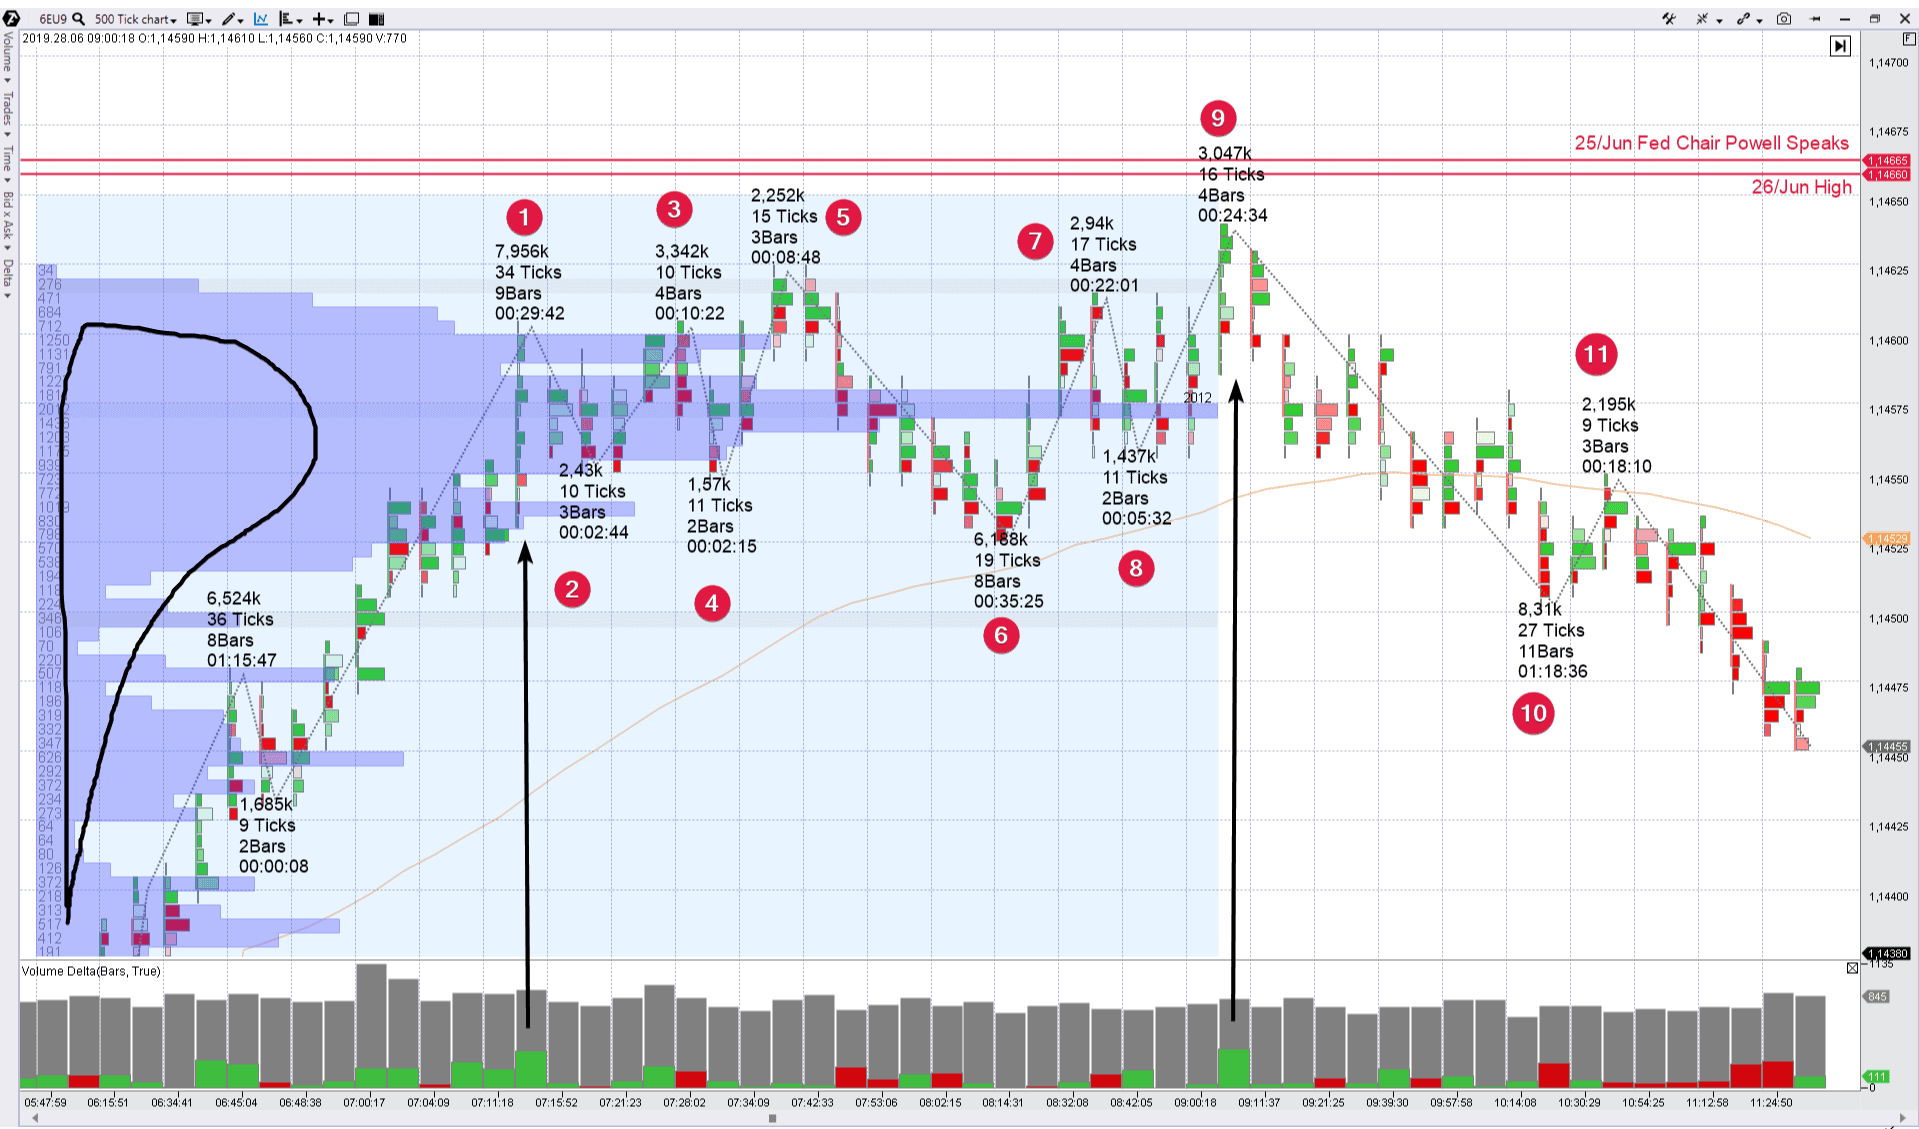
- The first arrow points at the Buying Panic of wave 1 with a splash on a positive delta. The price touched the level of 1.146.
- Flat movement developed after the panic and waves 2-3-4 were formed.
- Wave 5 is interesting because there is an evident effort of buyers to push the price up through the highs 1-3 on its top. But the effort failed. The buyers got stuck in a trap, instead of reaching a significant progress, and watched with disappointment how wave 6 evolved.
- By the way, wave 6 has extension in scale both by volume and length and progress (compared to the previous downward waves). It is a bearish sign.
- Zigzag 7-8 increased the convexity on horizontal volumes near 1.1475 even more. What does this mean?
- Wave 9 gives a clear hint for a correct answer. It is yet another, but more pronounced, failure of the buyers. The second arrow points at a significant effort of bulls. Many buy trades were executed there. But the real progress was minimal. The price increased the previous local highs 5-7 by several ticks only. And reversed down just on the next bar. This trap for the buyers clearly demonstrates absence of the market’s wish to exit upward from a short-term balance area (note the profile formation in the form of the letter ‘p’).
Consequently, if they do not want to move up, we wait for their movement down. Resistance has all chances to withstand. The time of the beginning of development of wave 10 is a chance to enter into shorts.
Let’s assume that we detected the reversal in due time and:
- opened the selling at 1.14575;
- posted a stop loss behind two red lines at the level of 1.14710 (the risk is 0.002);
- set our goal closer to the lower boundary of the range, marked in the previous chart. Say, around 1.1425 (the reward is 0.005).
In this event, the risk-reward ratio would be 2.5. The setup was formed in the morning and the price reached its goal in the afternoon.
Summary for the strategy of trading in a range
Let’s draw some conclusions on the strategy of trading by reversals inside a range:
- The previous price action marks the range boundaries. Usually, flats are specific for the markets with a small number of price-forming factors or the periods, when the main exchanges are closed.
- Pay attention to those moments when the upward waves start to lose their force, while growing to the resistance level, and the downward waves start to lose their force, while falling to the support level. Reduction of volume in a wave may tell us about weakness of traders that attack the level.
- In fact, downward reversals are small distribution areas and upward reversals are small accumulation areas. You can read about accumulation and distribution areas in the respective article from the VSA and cluster analysis cycle.
- Monitor the profile and bell-shape pattern formation. More often than on average, the p-shape profile is formed at a downward reversal, while the b-shape profile is formed at an upward reversal from the support level.
- To find an entry point, pay attention to the colour change at the delta or to the price reaction to major clusters (for example, a breakout of the maximum volume of the previous bar).
- Look for a reward-risk ratio in your favour, which should not be less than 2:1. Such a model would allow to be on the positive side even if the relation of profit-making trades to loss-making trades is 50 to 50.
The strategy of trading reversals from the corridor boundaries is closely connected with false breakouts. The reason, as a rule, is that a reversal is a bit more complex structure than a false breakout. That is why, the former quite often contains the latter (but not necessarily).
No. 2. Volume trading strategy. False breakouts
Logic. Beginner traders often notice that the market as if purposefully ‘picks up’ their stop losses before starting to move in the correct direction. It irritates when you make a correct forecast but make losses anyway. This happens because the majority of traders (as if they came to an agreement) post their stop losses in obvious places. As a rule, these are the previous extreme points.
Trading false breakouts envisages that the cunning market is interested in activation of stop losses of the crowd. Doing this way a major player can grab liquidity and improve his positions. That’s the way the market operates.
There is a back side in this tough game for the biggest money in the world. Make money there, where others lose. That is why the ability to trade false breakouts (massive activation of stop losses behind the obvious extreme points) allows entering the market with a profit there, where the majority of traders exit the market with a loss.
Example. Selling a gold futures
Let’s consider the gold futures market, tick chart, 1 candle = 500 ticks.
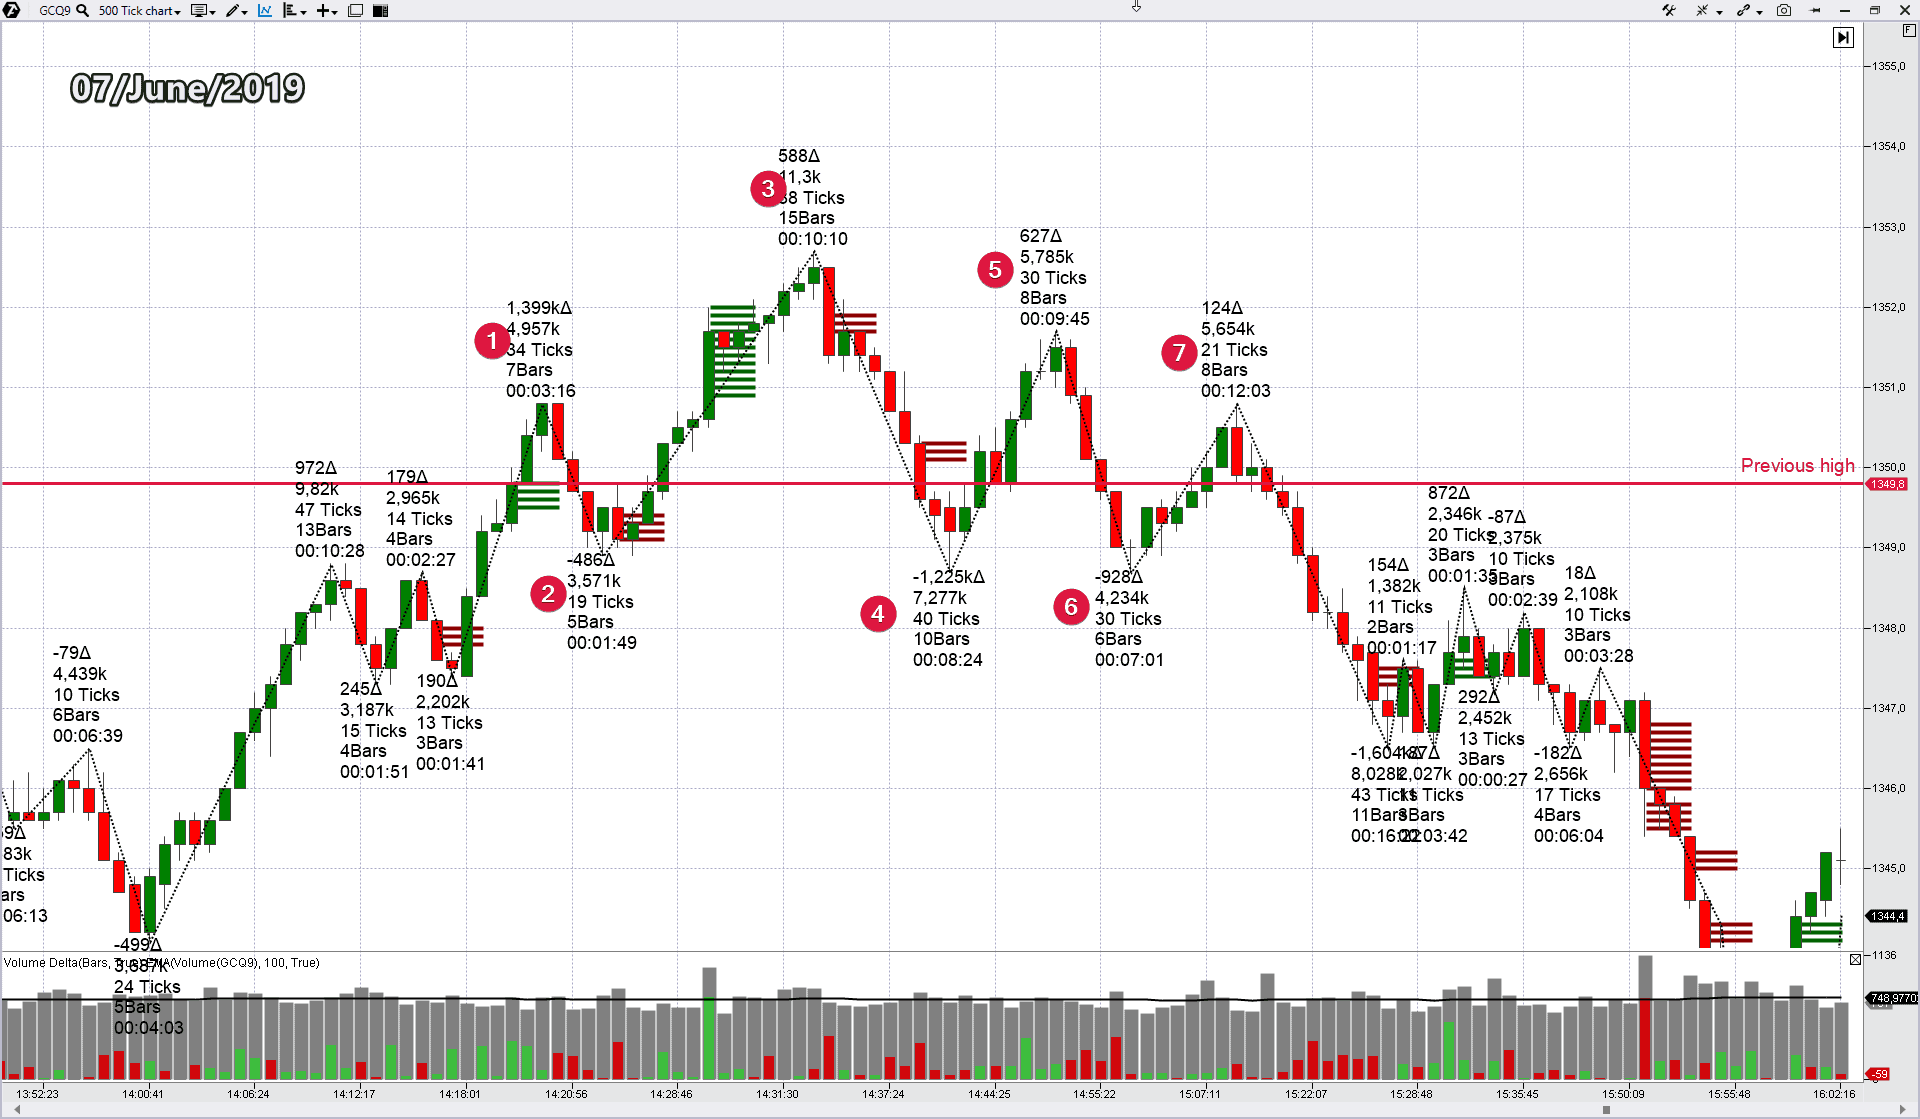
The gold market undertook an effort of a bullish breakout of the previous day’s high on June 7, 2019 (the level is marked with a red line). A splash of buys was registered on the wave from point 2 to point 3 (you can see it in the bottom bar chart at the green delta). The Imbalances indicator also sends ‘loud’ signals (green lines in the end of the wave). This wave 3 ‘accumulated’ the total volume of 11.3 thousand contracts. It seems like the market is strong and it plans to develop the success. However, it was too evident to be true…
Wave 4 completely ‘swallowed’ the wave 3 growth progress. The Imbalances indicator also sharply changed its behaviour, registering an unexpected overweight of sellers. Is anything wrong? The suspicion brings us to the idea that this breakout is false.
Wave 5 confirms this idea, since it has a ‘small’ cumulative volume, just 5.8 thousand contracts, which is 2 times less than the previous growing wave 3. Perhaps, the growth to point 5 reflects the ‘no demand’ situation.
So, everything is correct. The splash of buys (and activation of Imbalances) on the movement of (wave?) 3 reflects activation of stop losses of the sellers (and also entering of inexperienced buyers into a long; low quality demand). Such an activity doesn’t create a perspective for a sustainable growth, that is why the entry into a short becomes rational. You can open sells on wave 6 with the stop near the top of wave 3. The goal is to renew the day’s low near 1,334. An approximate reward to risk ratio is 2.5-1.
Download ATAS and check whether the profile forms the ‘p’ shape. If so, on what waves?
Example. Buying a USD/RUB futures
Let’s consider a recent false breakout of the low in the forward market of the USD/RUB currency pair.
The 2-minute chart below shows a cluster view of the course of trading in the morning of June 27, 2019. The red line marks the local low of the previous day (it was formed at the level of 63,708 on Wednesday on June 26 at 19:30).
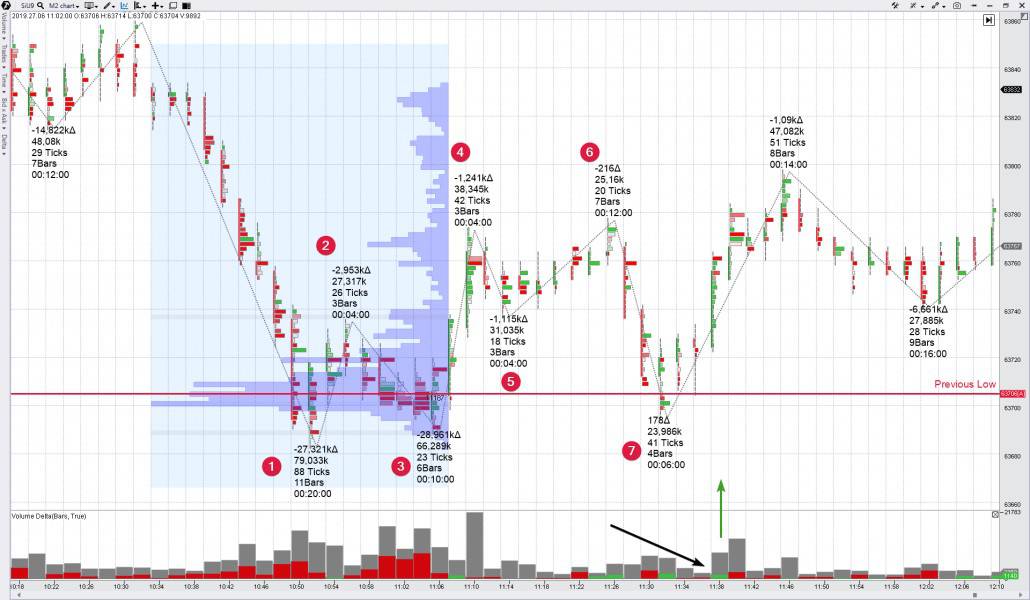
Activity in points 1-2-3 formed two thrusts of the previous local low (it is marked with the red horizontal line). It’s interesting that the volume on the descending wave 3 is very high – 66 thousand contracts were traded. And these were mostly sells, which can be seen from the delta. However, the progress for sellers is not big. Wave 3 has the high-low of 23 ticks only, which is several times less than the similar value on the previous downward wave – 88 ticks. Whereas, the volumes (79K and 66K) are quite comparable. A convexity in the form of the letter ‘b’ (it is expanded in our chart) was formed in the market profile as a result of inactivity.
If ‘fierce’ sells on wave 3 reflect true pressure of sellers, why did the next wave 4 closed above the high 2? It means that the activity in the area of the previous local lows 1 and 3 is an activation of stop losses of buyers, who had hidden their protective orders in a much too obvious place. Also, the sells were provided by traders “for a breakout of the support”.
Wave 7 shows the decreasing volume of 23.9K. The bears ‘tail off’. There was a test of the Point Of Control profile, plotted on the chart, from the point of view of an analyst of horizontal volumes. The black line in the bar chart is yet another confirmation of the ‘tiredness’ of bears. It reflects the fading dynamics of the traded volumes. This is, by far, not that activity, which was noticed at lows 1-3.
That is why opening a long near low 7 or at the beginning of wave 8 is not a bad place for buying. The green arrow points to a strong bar (a splash of volume on a positive delta), after which the entry becomes a bit too late.
Let’s assume:
- buy – 63,720;
- stop – 63,660 (60 ticks);
goal – 63,860 (140 ticks) – at the level of the local high, from which the wave (1) came down. The goal was reached at 12:40 in this case.
The reward to risk ratio is 2.3:1.
Summary for the false breakout strategy trading
The outcome for the false breakout trading strategy is, in general, similar to the outcome for the reversal strategy. Why? Because both strategies describe the ‘non-breakout’ market activity in the area of significant support/resistance levels.
- Look at the previous price action when you trade false breakouts. It marks local extreme points. Stop orders of a multitude of minor traders accumulate there in course of time.
- A splash of volume takes place on the thrust bar, however, the price rolls back deeply after the thrust.
- Green deltas at the resistance thrust mean activation of stop losses of the sellers and entry into a trap of light-minded buyers. The opposite is true – red deltas at the support thrust mean activation of stop losses of the buyers and entry into a trap of light-minded sellers.
- A false breakout could take place not only at the level of the previous extreme point. A ‘subversion’ may take place when crossing a round number. Say, USD 200 for a AAPL share. Or USD 200 for a TSLA share. Round levels serve, in themselves, as significant support and resistance levels.
- Monitor the profile. Formation of a ‘convexity’ reflects activity, when traders, who believe that the breakout is true, enter into the positions, which would turn out to be traps. A p-shape profile is formed at the downward reversal more often than on average. A b-shape profile is formed at the upward reversal from the support.
- An entry signal could be sent by indicator data (for example, if the delta changes its colour) or by the price/clusters action. Make judgements on the basis of facts in order to catch the beginning of a fluctuation, which has a perspective to develop into a significant wave. Make money there, where others lose. Keep the reward to risk ratio in your favour – not less than 2:1.
- False breakouts take place more often at the moments of higher volatility – when sessions are opened or news is broadcast.
In order to get more information about false breakouts, read about VSA upthrusts and cluster analysis.
Summary on flat strategies
The described 2 strategies – for trading at reversals and false breakouts – are the most appropriate for working in the markets, which trade in a range. For example, if a consolidation emerges at longer timeframes, monitor the price action when it reaches local extreme points at shorter timeframes.
The main difference between the reversal trading and false breakout trading is that a reversal is a more complex process, while a false breakout could be just a ‘passing’ splash.
We will still discuss this difference but a bit later. Don’t miss the second part of the article on volume trading, where we will discuss the following strategies:
- Trading on a breakout.
- Trading on a rollback.
- Trading against a trend.
In the meantime:
- download ATAS free of charge;
- set the Delta and Zig Zag indicators in the cluster chart;
- mark the closest support and resistance levels at the 1-hour period;
- set alerts at these levels;
- watch attentively the waves and deltas when the alerts activate.
We hope this information was useful for you. Follow our publications and click the like button.