We devote this article for beginners to the Cumulative Delta. Why is it important? Why is it useful? What are specific features of the Cumulative Delta application for trading on the exchange?
Read in this article:
- what the standard Delta, Bids and Asks are;
- what the Cumulative Delta is;
- what the Cumulative Delta shows;
- how to set the indicator;
- advantages and disadvantages;
- how to use the Cumulative Delta indicator data for making trading decisions.
What the Delta is?
Let’s define what a standard Delta is before we start speaking about the Cumulative Delta.
Delta is the difference between buys and sells. The Delta is positive if there are more buys than sells and the Delta is negative if there are more sells than buys.
Someone may say: ”Wait a second. Every trade has both a buyer and seller. How could there be more buys or sells?”
It’s true. Every trade has both a buyer and seller. However, in accordance with the principle of bringing the exchange orders together (read the story about John and Peter in this article), a trade is executed when an initiative market order ‘meets’ an expecting limit order.
And then, when the Deltas are calculated, it is considered that:
- a sell is when a sell market order is brought together with a buy limit order (a buy limit order is also called a bid);
- a buy is when a buy market order is brought together with a sell limit order (a sell limit order is also called an ask).
You can find more information about Bids and Asks in this article.
Example.
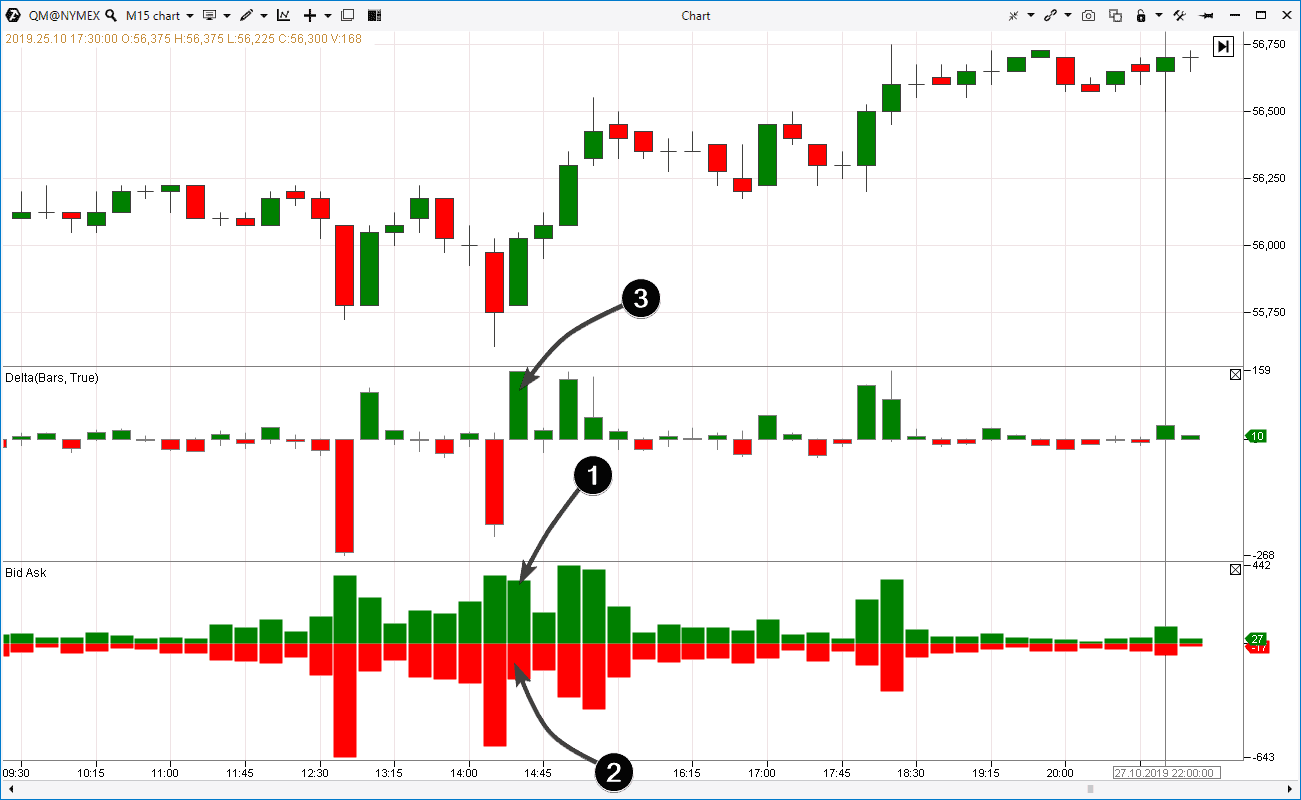
The picture above shows a chart from the oil futures market; the data is from the NYMEX; the period is 15 minutes. The chart shows the Bid Ask and Delta indicators.
- Arrow 1 points to the number of initiative buys.
- Arrow 2 points to the number of initiative sells.
- Arrow 3 points to the difference (delta) between the first and second numbers.
By the way, pay attention to the context. There were significant excesses of sells (red bars on the Delta) at 12:45 and 14:15, however, the price doesn’t have a wide bearish development. That is why, appearance of buys on the 14:30 candle under consideration provides the ground for playing in the team of bulls.
What the Cumulative Delta is?
Well, we’ve defined the Delta and now we will speak about the Cumulative Delta.
The word ‘cumulative’ means accumulated, integrated, common, aggregate and consolidated. Consequently, the Cumulative Delta is the indicator which summarizes the Delta values for a certain period of time.
Example. Let’s add the Cumulative Delta indicator to the oil futures chart which we used above.
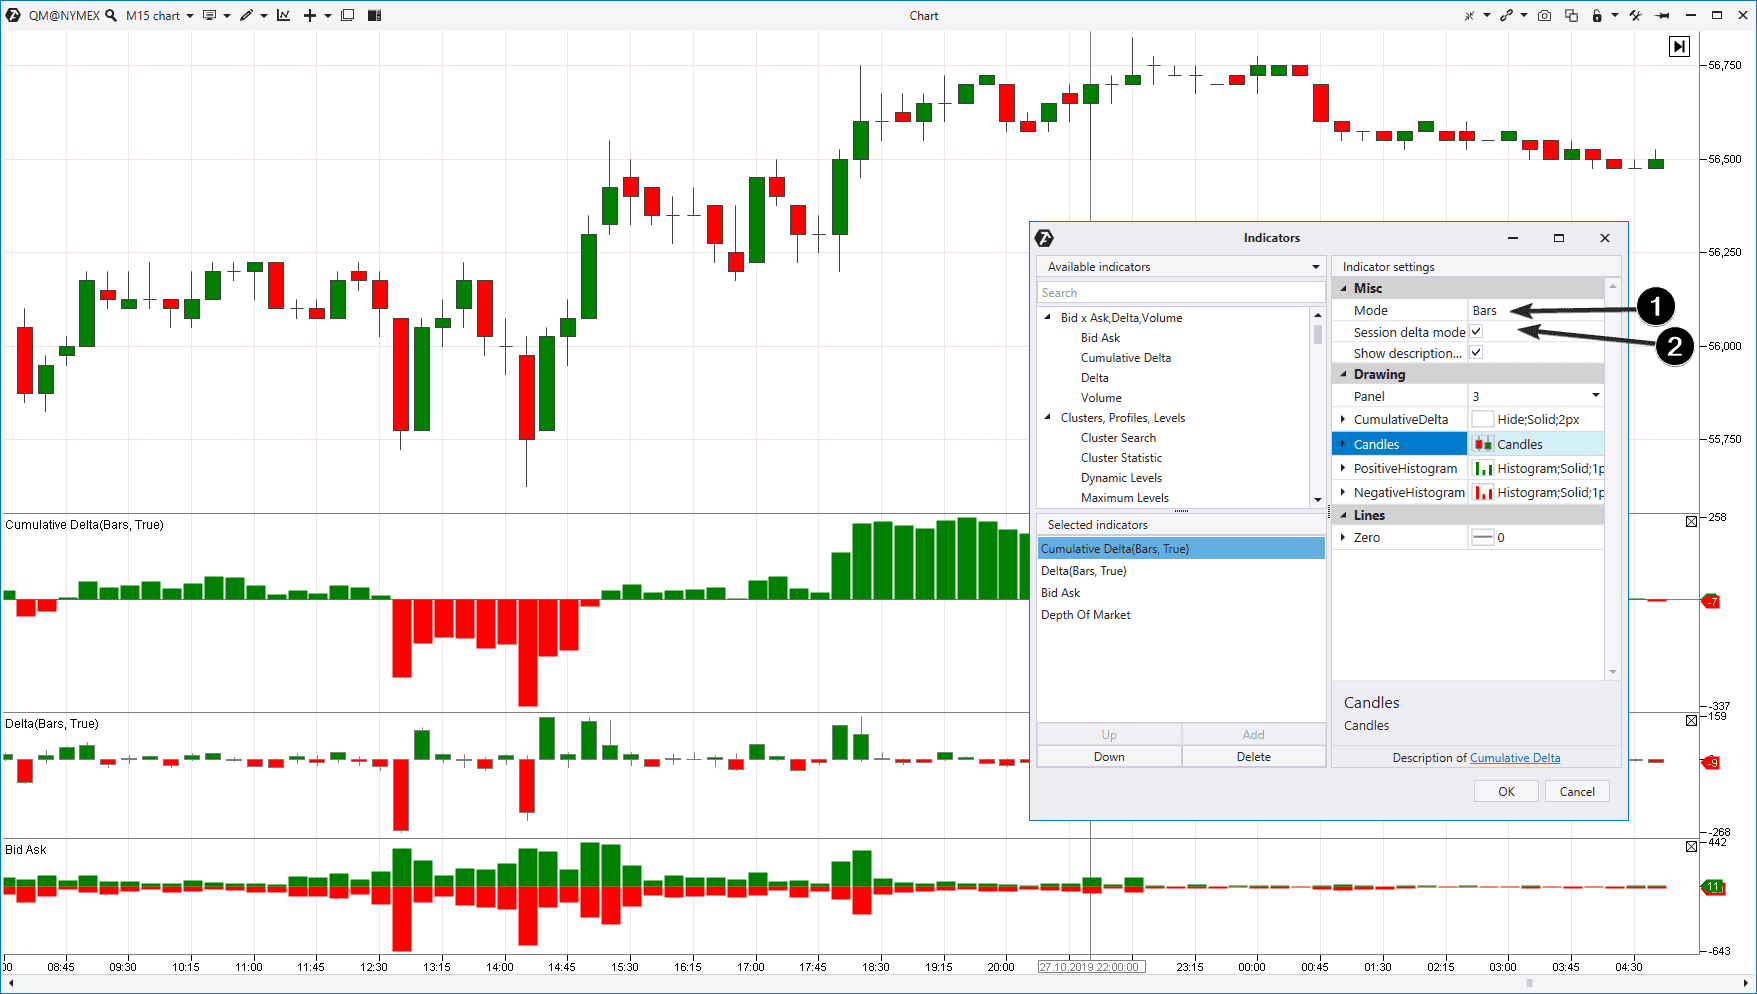
As you can see, if the Delta indicator is reset at the beginning of each period, the Cumulative Delta indicator summarizes values of the Delta for the previous periods.
The Cumulative Delta settings are simple:
- The indicator type – bars (in the example above), candles or a line.
- Session Delta Mode. If there is a check mark here, the Delta is reset at the beginning of each trading session. If there is no check mark, the indicator uses all the data loaded in the chart.
Does the MetaTrader 5 have the Cumulative Delta indicator? Perhaps. But we, at OrderFlowTrading, are not sure that it would work correctly. Also, we are not responsible for developments of other developers. The Cumulative Delta indicator in ATAS is calculated on the basis of the tick data received through direct connection to the exchange.
How to use the Cumulative Delta?
As a rule, the positive dynamics on the Cumulative Delta indicator means predominance of buyers and, consequently, a stable price growth. The chart below (data from the Moscow Exchange – USD/RUB futures) shows this correlation.
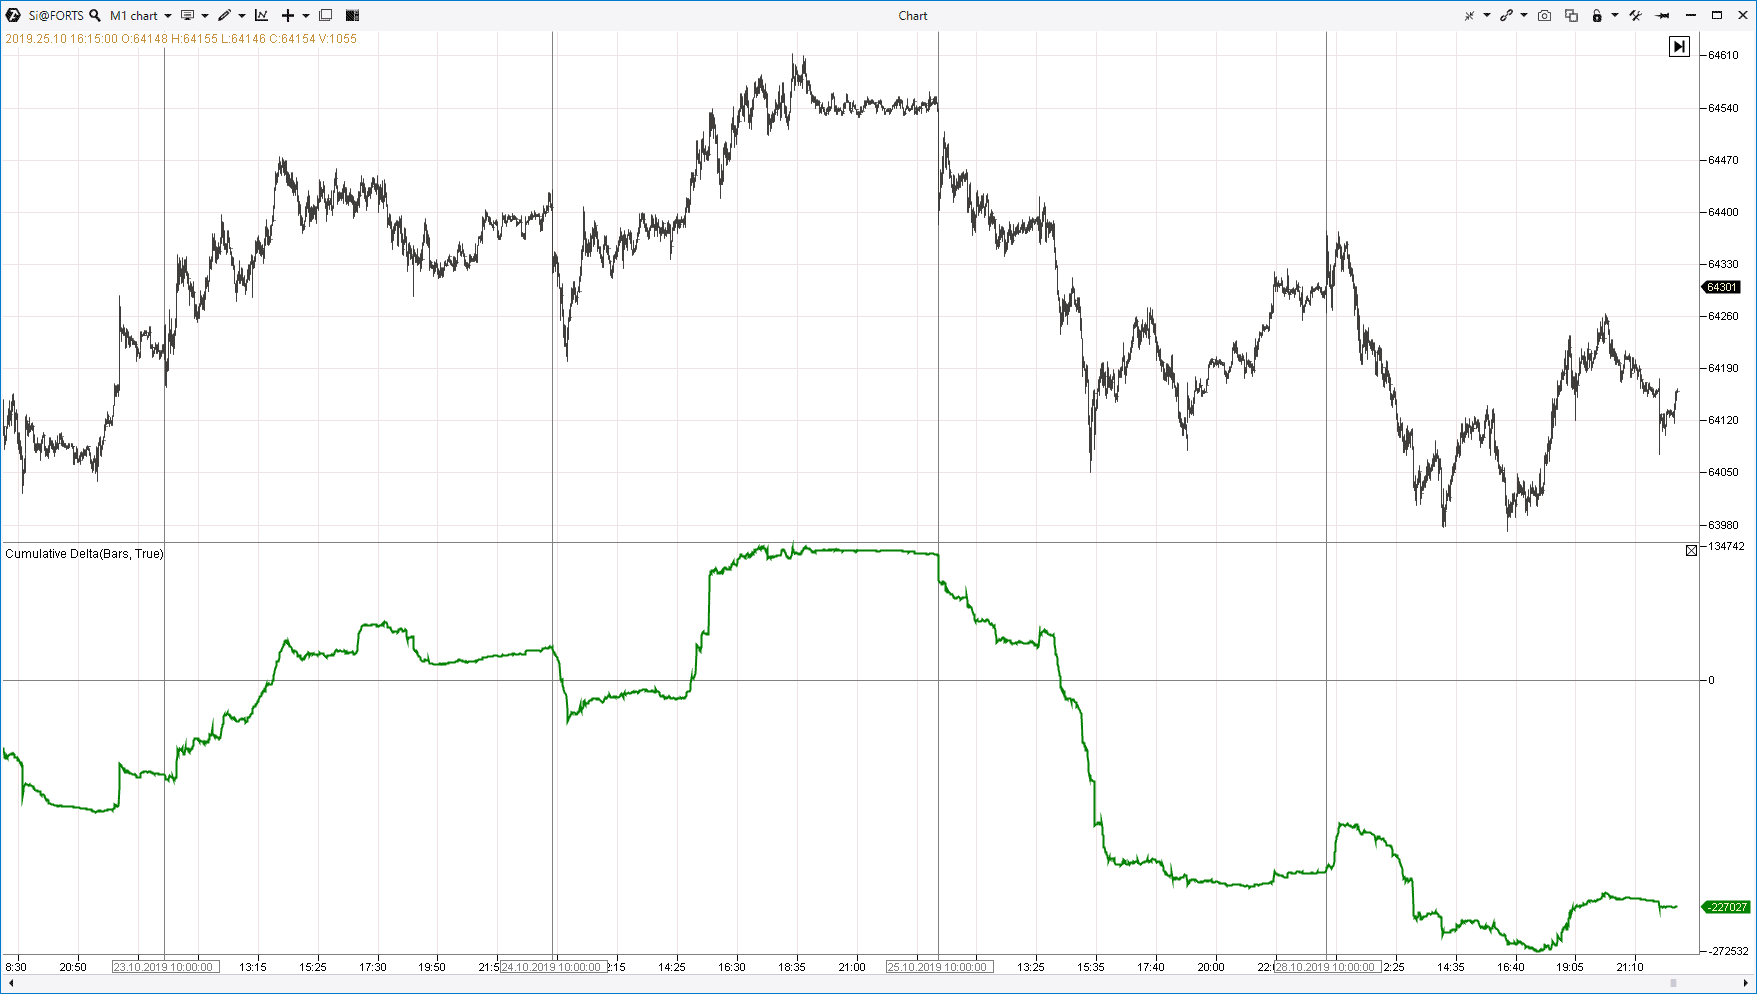
It means that the Cumulative Delta indicator data could be used as a simple but efficient confirmation of the uptrend/downtrend.
However, there is another way to use the Cumulative Delta. It is the divergence principle. The picture below shows the same chart but with a different scale to have a better view of the events of August 28.
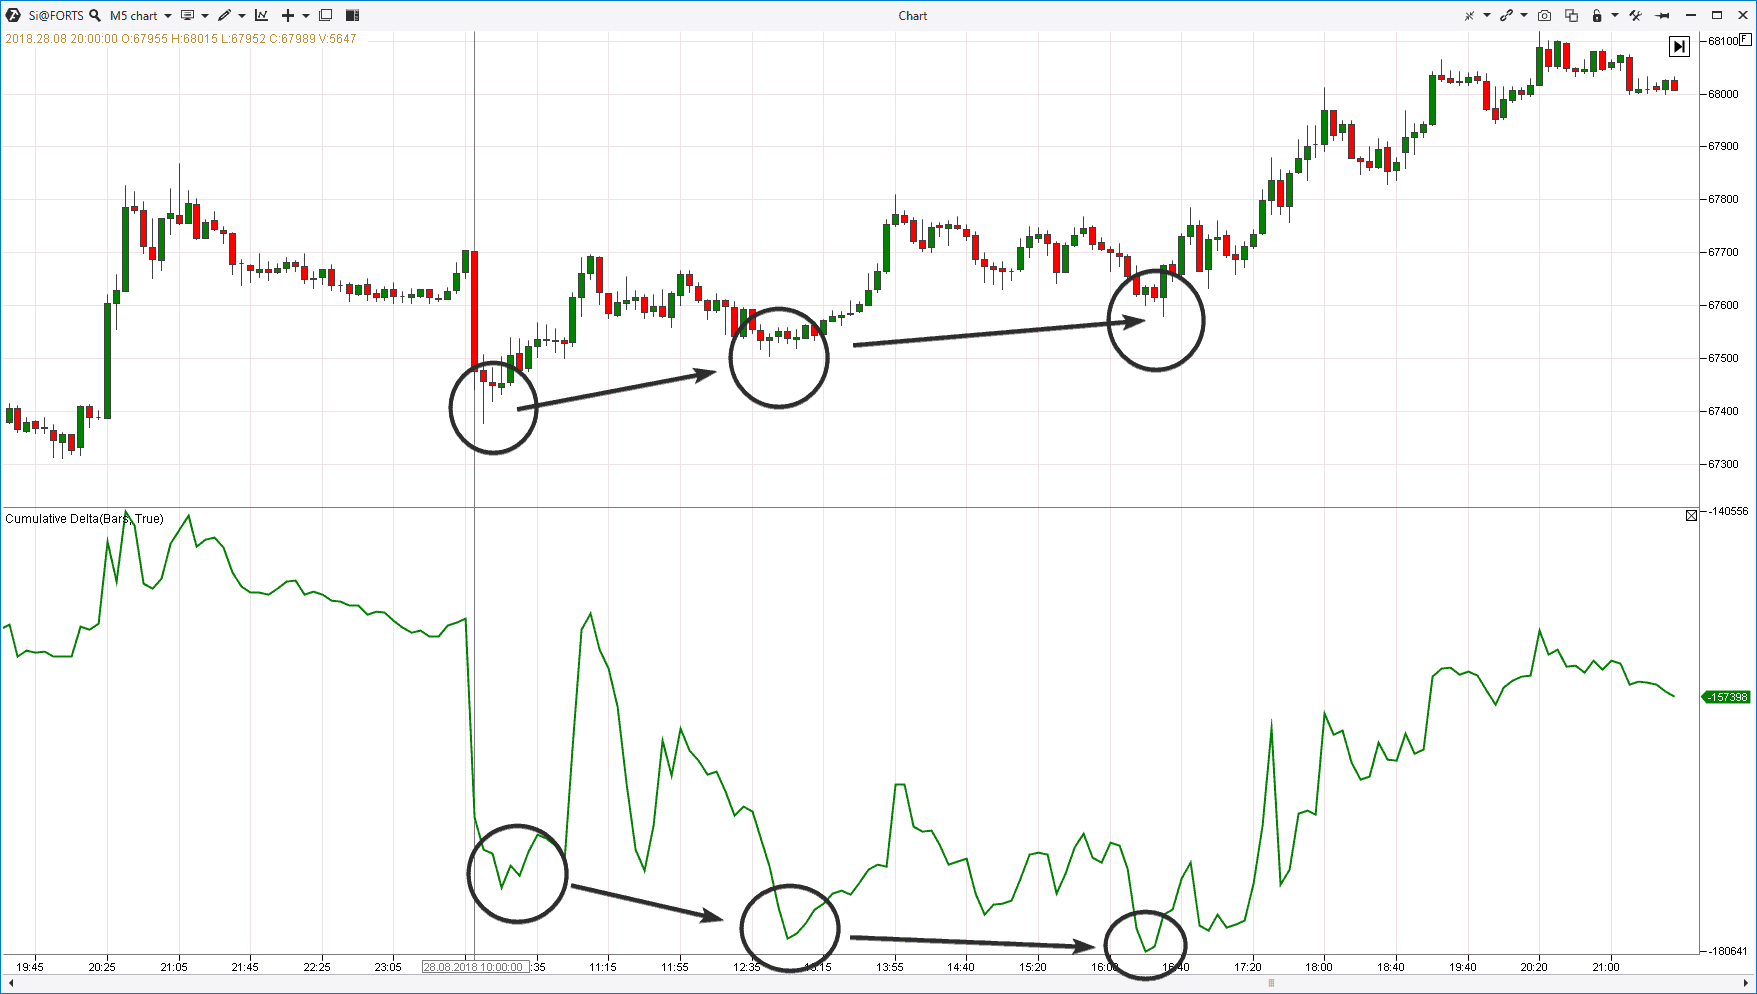
Despite the growing pressure of sells, the price ‘stubbornly’ refuses to fall. It is a bullish situation. Consequently, you should refrain from shorts and consider longs.
The picture below shows an example of making a trading decision in a similar situation in the bitcoin market (the data are from Bitfinex with a period of 30 minutes).
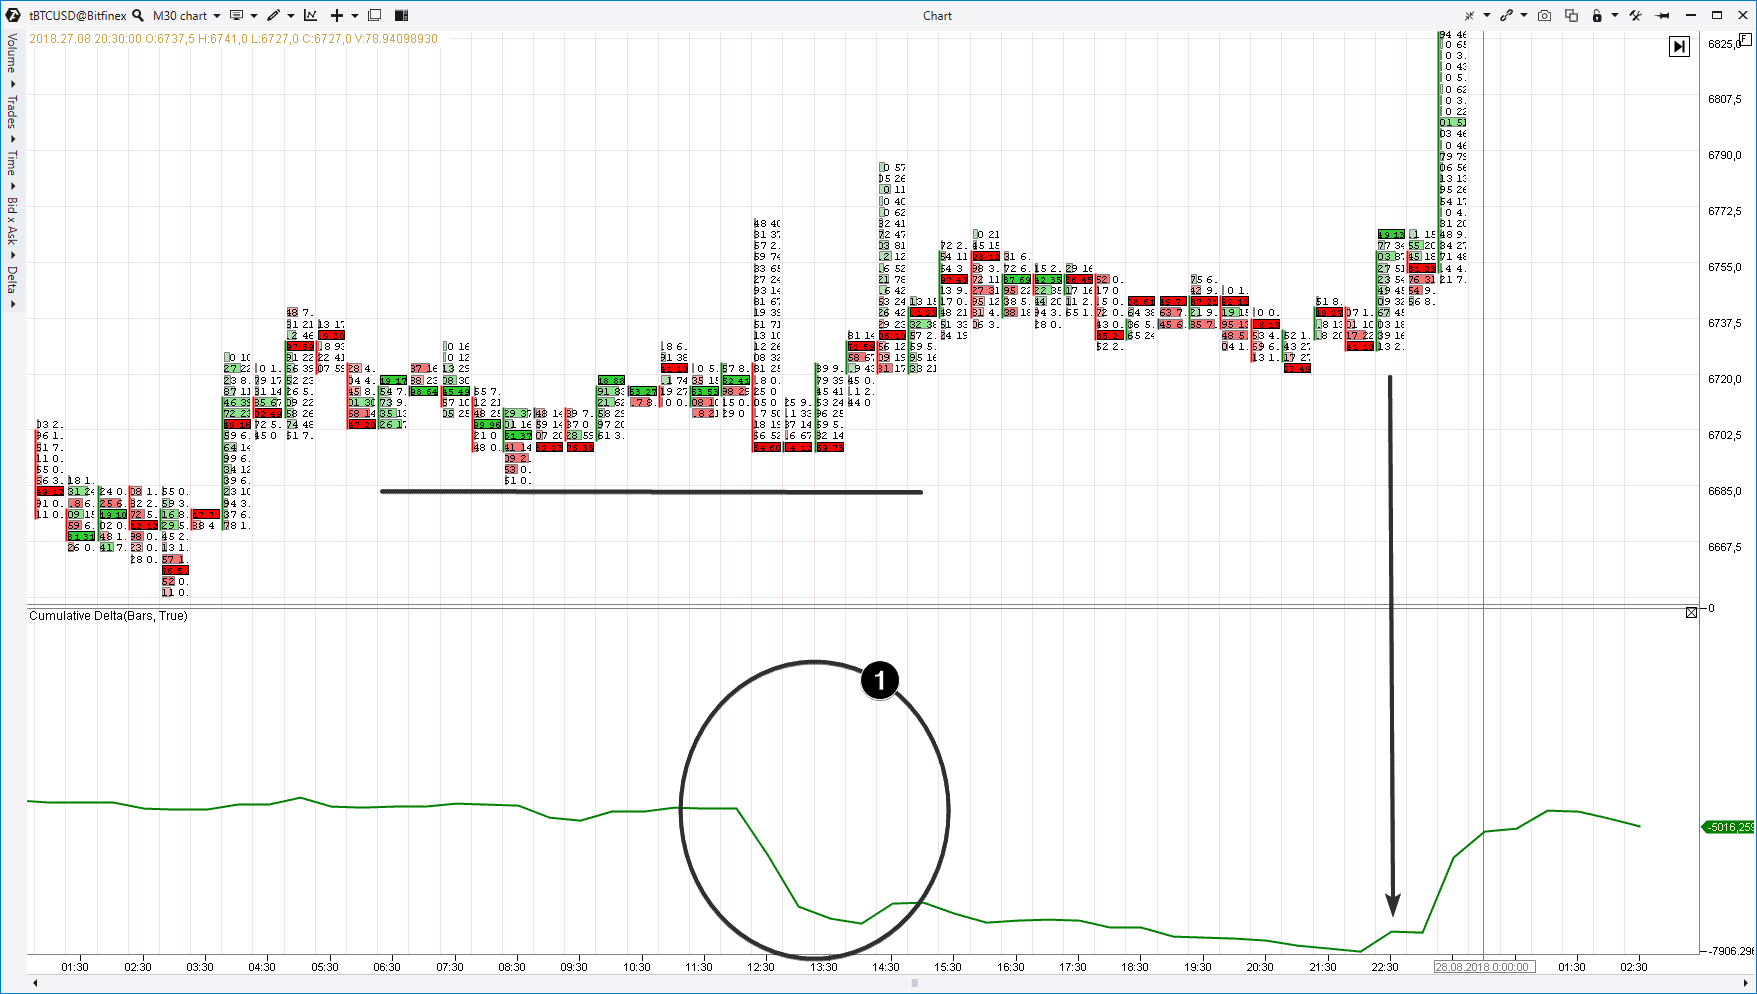
We use a cluster chart with the only Cumulative Delta indicator (in the form of a line).
- We had scaling market sells in point 1. The indicator testifies to it. However, … what is the price reaction? It doesn’t fall. The bitcoin price quote didn’t even break the previous local low (black horizontal line). Ability of the price to ‘keep afloat’ despite massive sells is a sign of strength. Search for entry into longs looks justified.
- When the Cumulative Delta indicator ‘holds up its head’ (marked with an arrow), it could be used as a trigger for entering buys.
Here’s one more example from the Brent oil futures market.
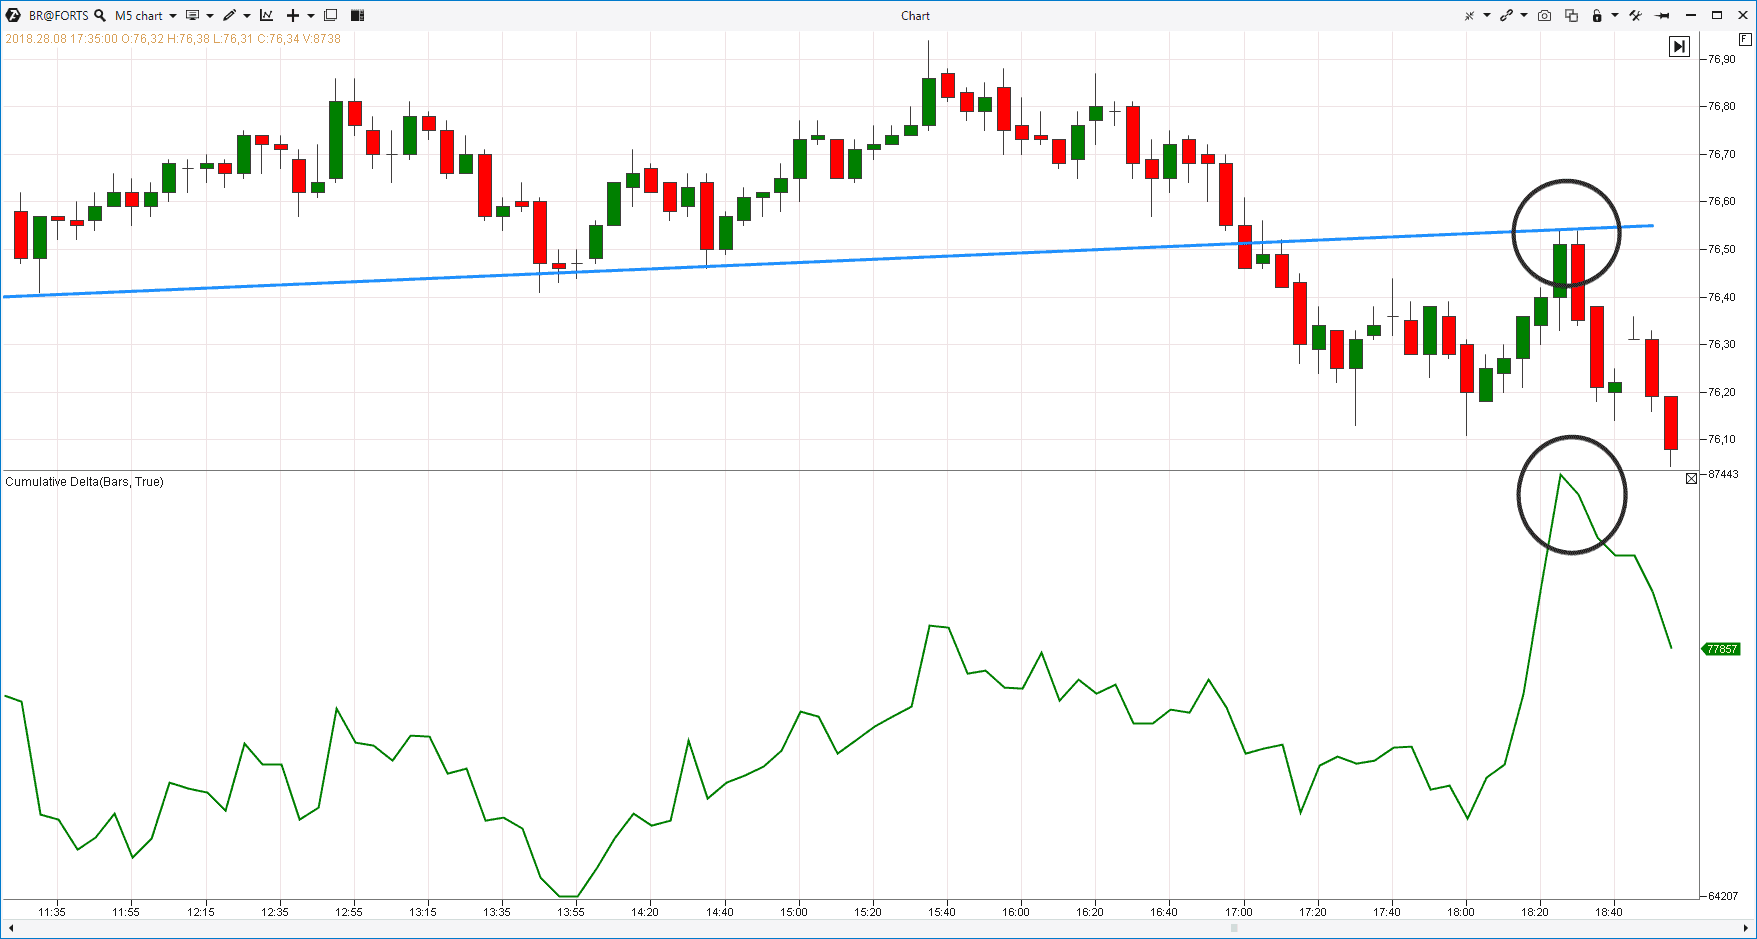
If you are an intraday trader and your strategy is the ‘breakout test’, the chart above will suggest you an idea how the Cumulative Delta could be used for entering shorts during testing of the has-been support.
Advantages and disadvantages of the Cumulative Delta
The main advantage of the Cumulative Delta indicator is that this indicator works with the flow of actual trades on the exchange. In other words, it deals directly with the trading process. Working with the Cumulative Delta indicator you will analyze:
- market trends;
- activity of buyers and sellers;
- price behaviour in combination with the Delta.
And there is a disadvantage here – a certain complexity of the analysis. You will not receive simple signals from the Cumulative Delta. It is not a magic wand. You will need to learn how to apply the Cumulative Delta in your analysis.
The training process will help you to do it:
- Download the free test version of ATAS (you can continue to use it after the 14-day test period).
- Activate the Cumulative Delta indicator as described above.
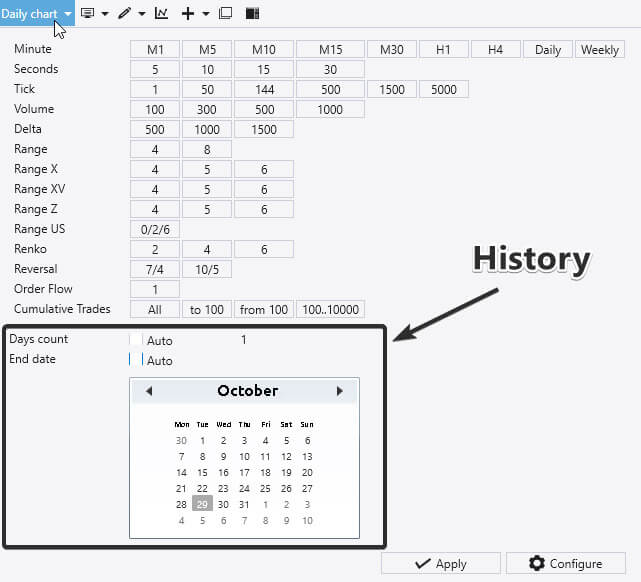
- Test your market/timeframe on the historical data. Remember that you can download the tick data for an arbitrary period from our server (the screenshot below shows how to do it in ATAS).
- Analyze the Cumulative Delta behaviour on reversals and look for repeated patterns.
- Train yourself to distinguish indicator patterns using the historical data and then in the actual market in real time.
- You can start using your real trading account after you have learnt to make a profit on a demo account (how to open a brokerage trading account).
Summary
As the practice shows, not all markets/exchanges transmit correct data on deltas, which could be used for making rational decisions. However, if your market provides high-quality data about buys and sells, then the Cumulative Delta could become that instrument which you would use for increasing efficiency of your trading.