Are you interested in the volume trading strategies? ATAS will help you. In this article, we will talk about one of the very useful indicators of the ATAS platform. Namely, we will speak about Dynamic Levels.
Read in this article:
- What the Dynamic Levels indicator shows?
- The Dynamic Levels indicator review.
- Variants of application of the Dynamic Levels indicator.
What the Dynamic Levels indicator shows?
The Dynamic Levels indicator shows migration of the volume, delta or specific trades in the process of trading.
When the price ‘fumbles for’ the area which is interesting for the market participants, the increased volume of trades starts to be formed at this place. Demand and supply are balanced.
Then one of the sides takes initiative and moves the price in the next balance area, which is below or above the current one. Then the process of volume accumulation is repeated and this is how the volume dynamic levels are formed.
If you apply the Market Profiles (or TPO and Profile) indicator, then you observe volume levels as if ‘in statics’. Such an approach doesn’t allow analyzing dynamics of the volume levels. In other words, it is expedient to use Dynamic Levels in order to understand in what direction the volume shifts during a minute, hour or day.
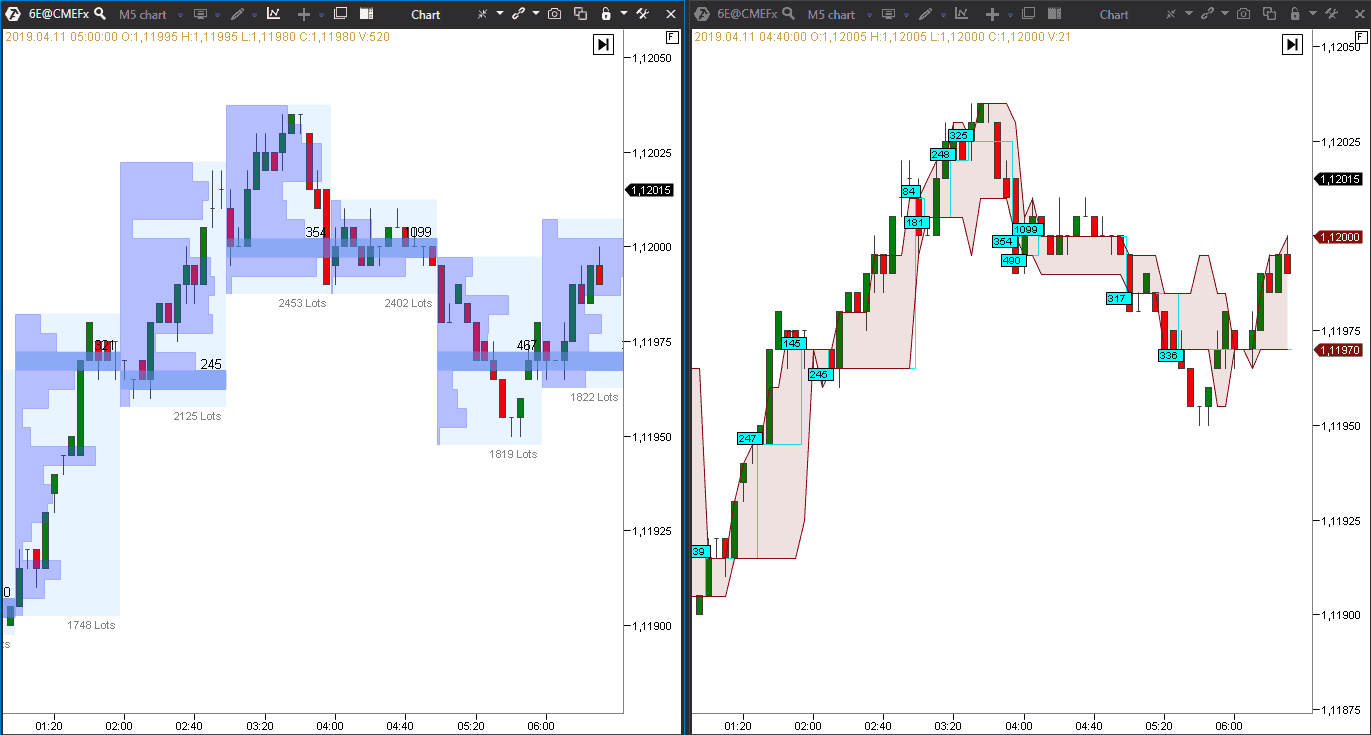
The left picture shows the Market Profiles (TPO and Profile) indicator while the right one shows the Dynamic Levels indicator.
The Dynamic Levels indicator review
In order to add the indicator to the chart:- launch ATAS;
- go to the Indicators section (or press ‘Ctrl+I’ in the Chart module);
- find Dynamic Levels in the list;
- press Add.
The indicator should appear in the Selected Indicators section.
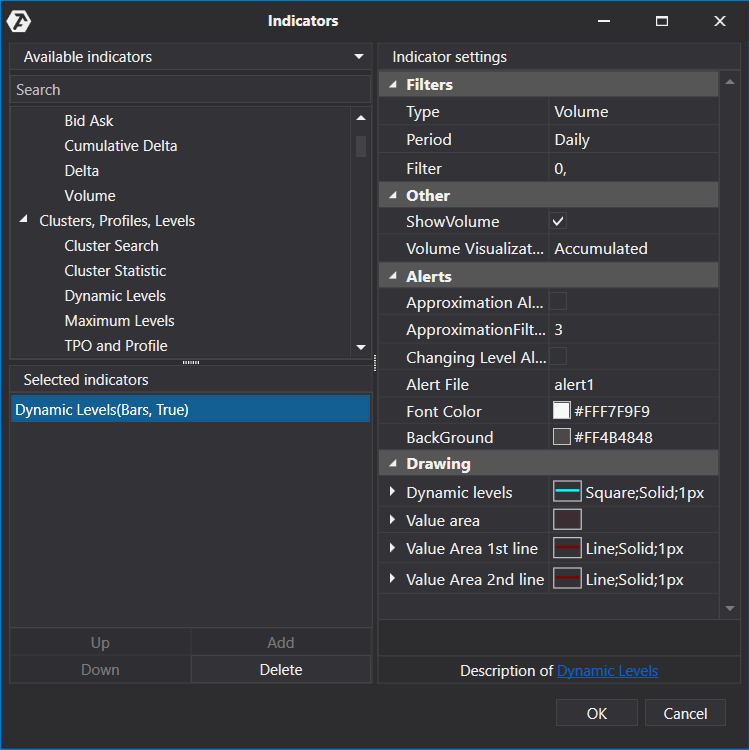
Then you need to set the required parameters for the instrument (a selected market). Such parameters as:
- type (sets the type of initial values for the calculation of: Bid, Ask, Delta, Volume, Tick and Time);
- period (sets the period, during which the calculation is carried out; when the period expires, the values are reset and the calculation is carried out again: hour, day, week, month and the whole period);
- filter (the minimum value, obtained during the calculation, which will be reflected in the chart).
Indicator settings will be individual for each specific task. Let’s assume that we need to track price levels, at which the volume of more than 100 6E futures contracts (what futures are) accumulates during each hour.
For this, we will set the following values:
- type = volume;
- period = hour;
- filter = 100.
The indicator will look in the chart as follows:
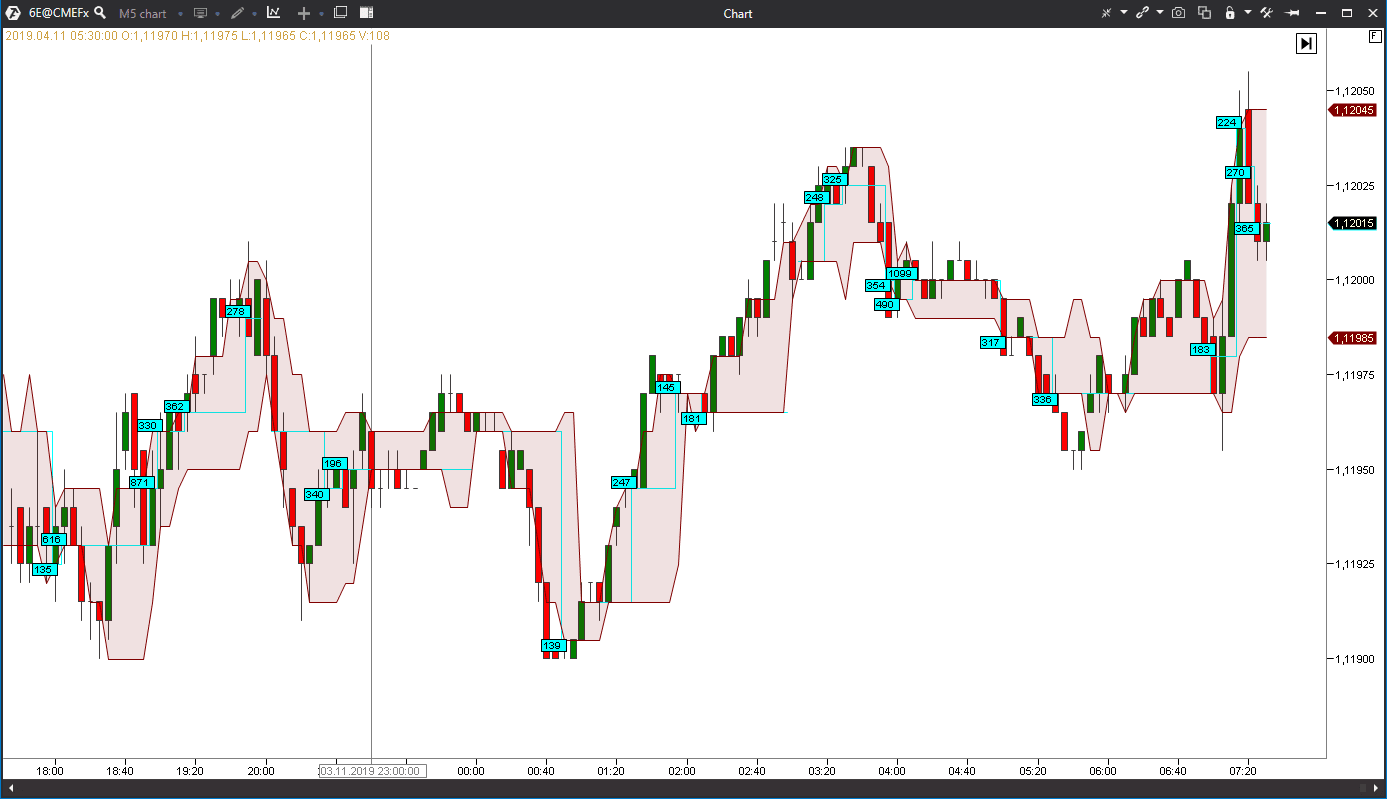
The Dynamic Levels indicator builds a dark-red channel in the chart. It forms an area with 70% of the whole traded volume.
The turquoise polygonal line reflects the traded volume in numbers.
These lines pass through prices where the traded volume meets the parameters, set in the filter (in our case – from100 contracts).
As soon as a new cluster with the volume of more than 99 contracts is formed, the balance line moves towards a new volume. Besides, the average price value is taken into account with consideration of the accumulated volume. It turns out that you track not so much specific clusters as take into account namely the price average value with the increased volume during each hour.
Does it seem complex? Let’s analyze some practical things.
Variants of application of the Dynamic Levels indicator
Variants of the Dynamic Levels indicator allow to use it for various practical tasks. Let’s consider some of them:
- tracking migration of the increased volume;
- search for the levels of domination of sellers or buyers.
In the event the price is in the ‘fair area’ (where demand and supply balance each other), we observe an increased trading volume. It happens because such a price is acceptable both for buyers and sellers. However, sooner or later the price moves away from the fair balance area looking for another one under the influence of the news or other factors that come to the market.
Let’s see how the intraday volume migrated through the example of the Gazprom PJSC stock.
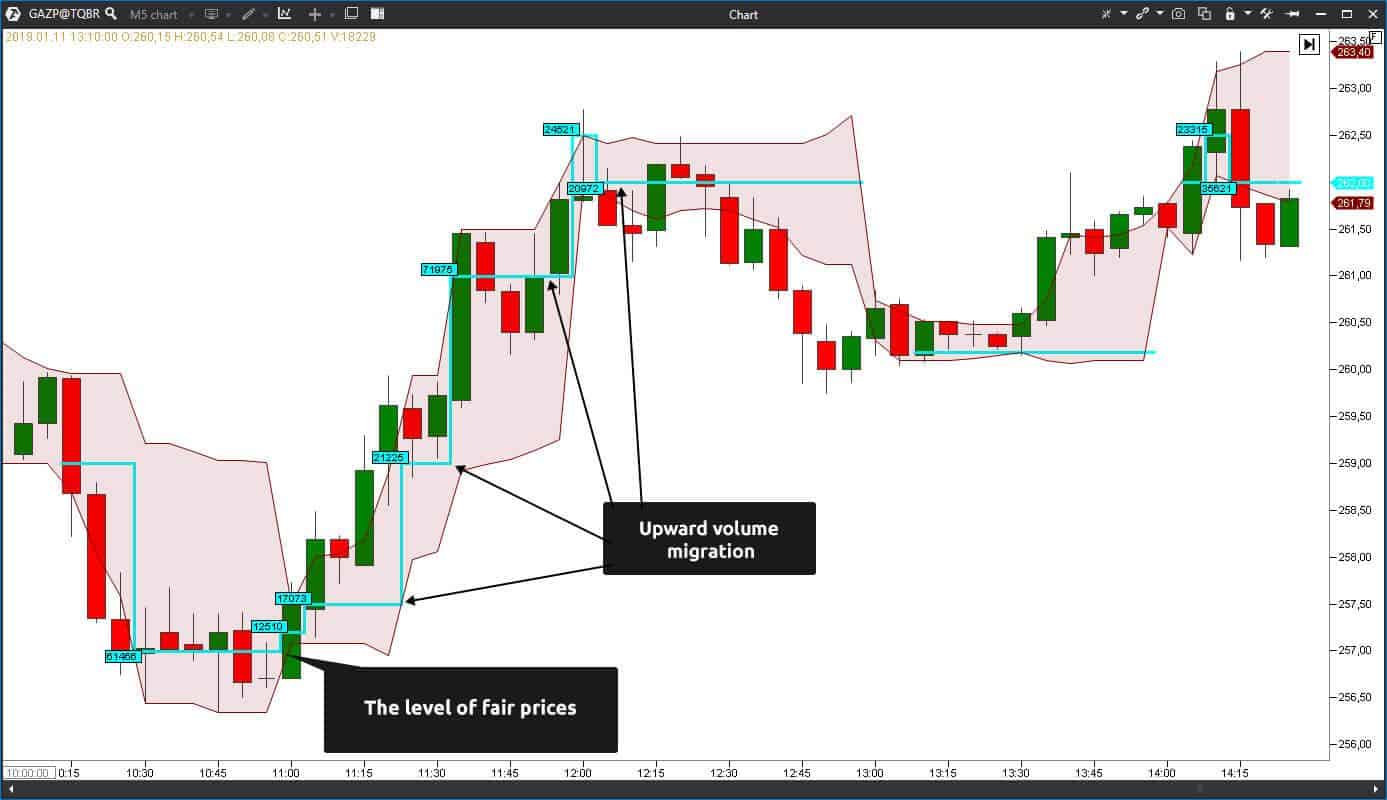
Trades were executed in a narrow range where a cluster with an increased volume of more than 60,000 lots was formed. It tells us that the price ‘fumbled for’ a fair range, where there was a parity of buyers and sellers and they executed trades more often.
Then we see how clusters with an increased volume start to gradually move upward – in other words, we observe the upward volume migration. The rate of growth and the distance between the clusters increase after the price breaks the upper boundary of the area of 70% of volume. In this case, we observe the upward movement of the fair price area, which tells us that the buyer is still satisfied with the stock price despite its growth.
- If the price is above the Dynamic Levels most of the time, we may assume that the growth potential is not yet exhausted.
- If the current price quote is below the Dynamic Levels, then, most probably, the downward movement potential is still preserved.
Use the possibility of the Dynamic Levels indicator, increasing the time coverage, for integral perception of the market situation.
Let’s see it through the example of the same stock but with the use of the daily indicator period.
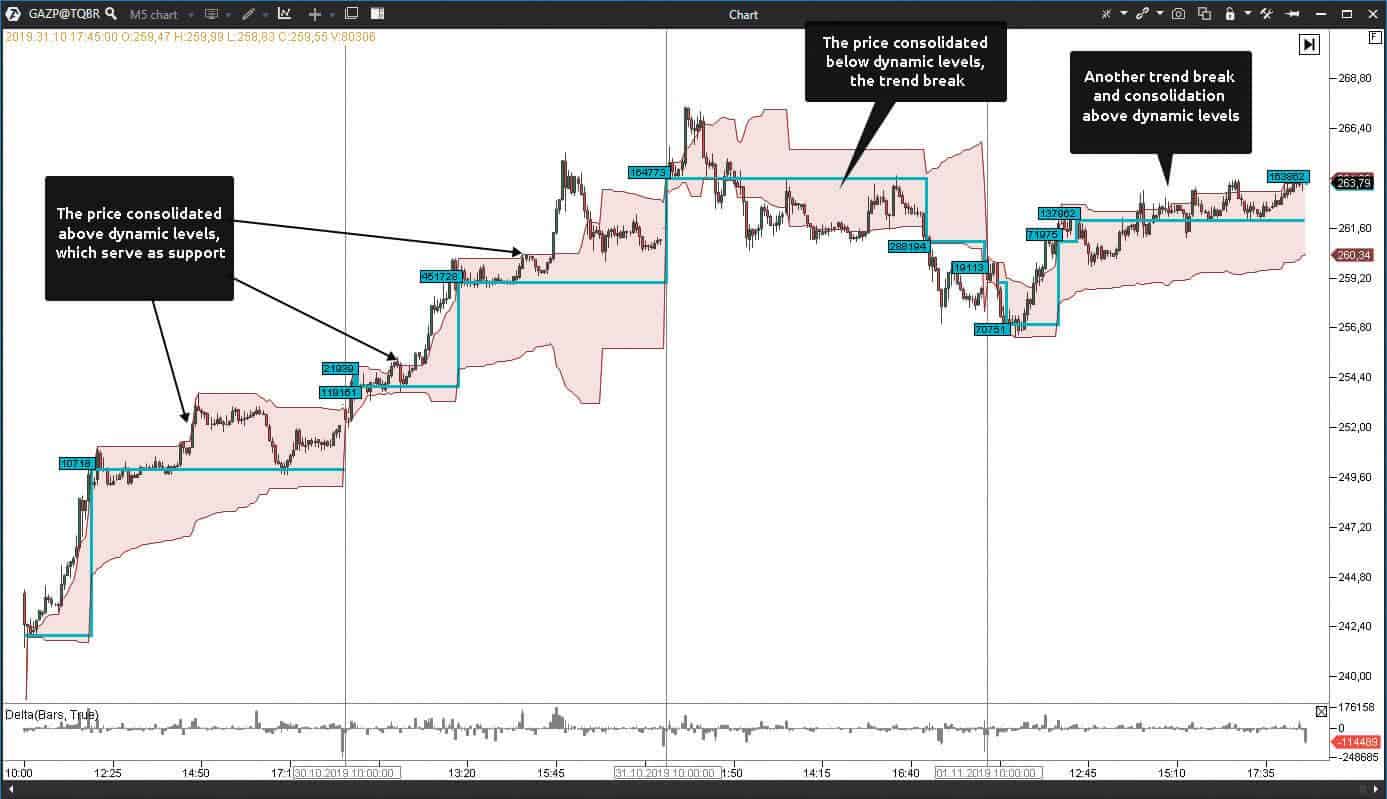
We want to show you in this example how informative the Dynamic Levels indicator could be on stocks. We can see the strongest volume levels, which continue to hold the price, at the daily interval. The price stays above the Dynamic Levels for several days, which tells us that the buys are still topical and strong in the instrument.

Then, one day, there comes a turning point. The price consolidates below the dynamic level at the uppermost point, which sends us a signal of a probable break of the uptrend.
The further observation of the price movement will help to identify more accurately whether the uptrend is finished or we witness a short-term correction. As we can see further, the growth tendency is preserved since the price consolidates above the dynamic level.
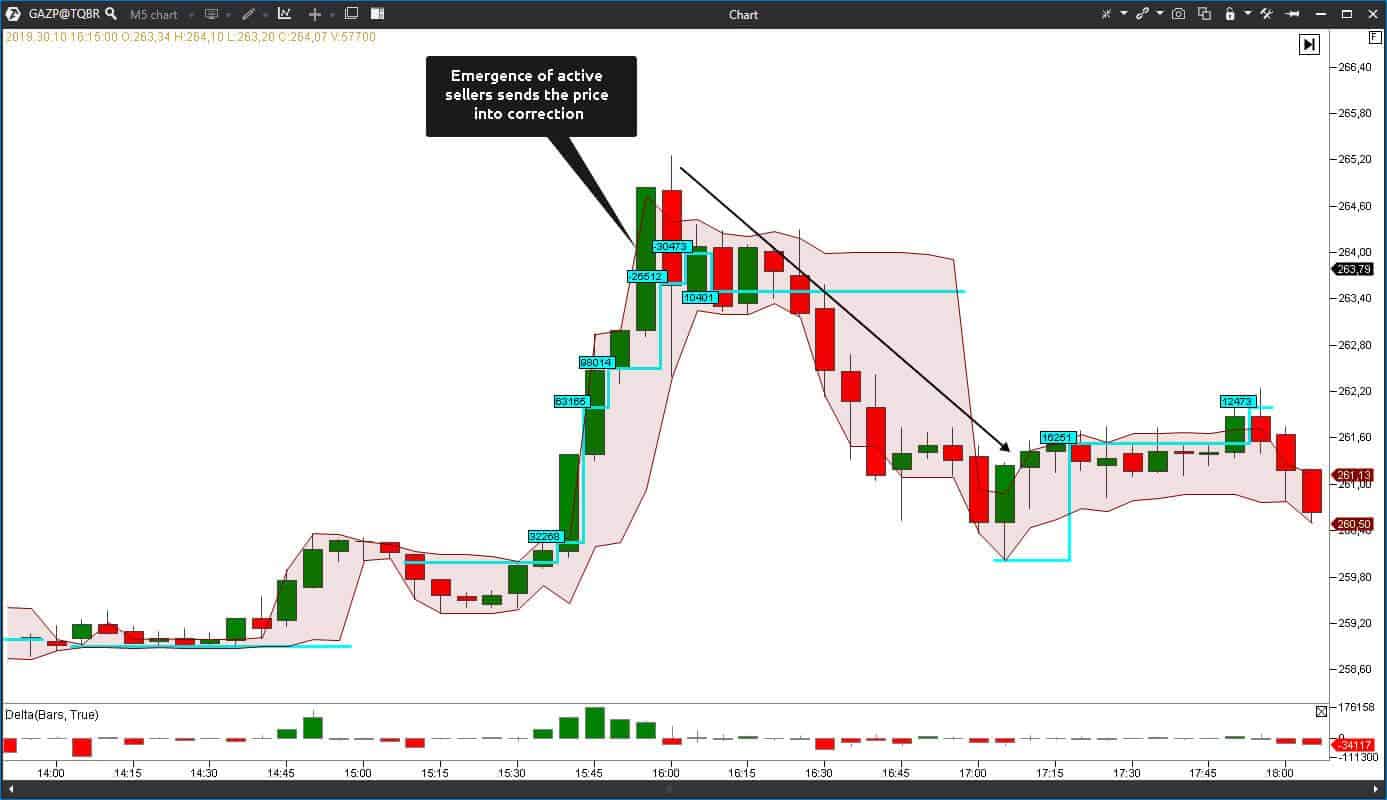
Set the Delta type in the indicator settings in order to analyze the predominance between the buyers and sellers.
This setting will be useful for intraday analysis and it shows the areas where the priority is changed.
Let’s assume that there was a fast price growth in the market during a certain period of time, but then the indicator registered negative clusters. It might mean that, perhaps, the price met resistance and the active buyer may ‘send it to correction’. And if you hold a long position, you have a reason to register your position completely or partially.
Additional settings of the Dynamic Levels indicator allow not only tracking the movement of the maximum volume or delta, but also tracking the levels with the set number of trades by bids and asks and by time and ticks.
Summary
Use the Dynamic Levels indicator to:
- confirm the trend or its breakout in the long-term stock trading;
- identify the reversal point during the intraday futures trading;
- identify the buyer’s or seller’s strength in scalping.