What false breakouts are
To put it simply, a false breakout is a pattern when: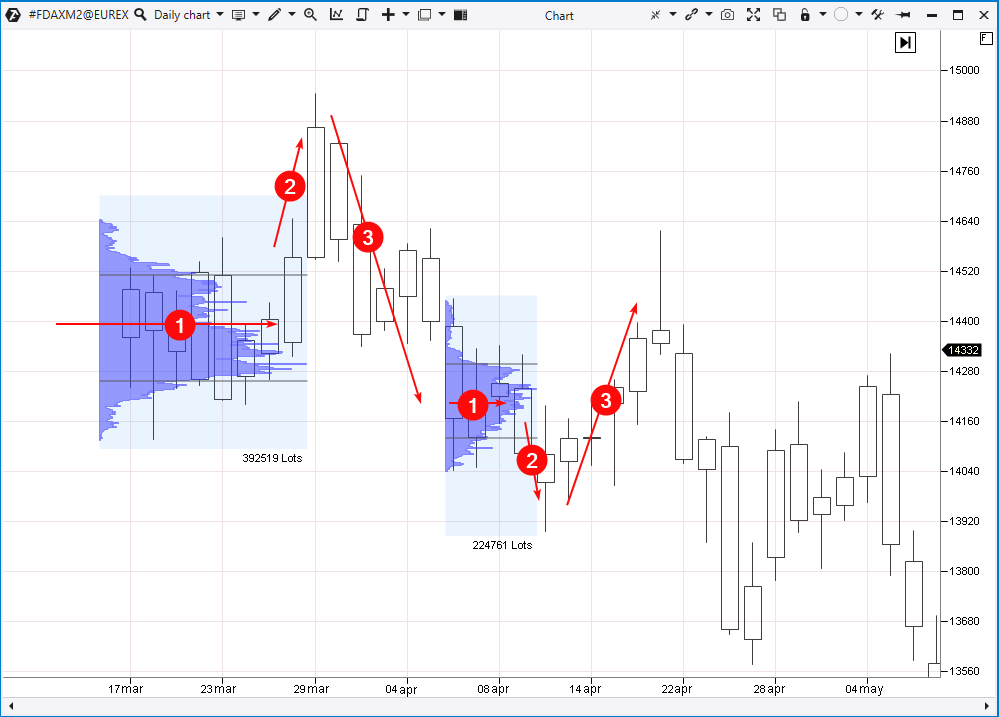
- some people lose money when they open positions in the direction of a breakout and consider that the trend will continue;
- others lose money because their stops (which are set out of the range) get knocked out.
Idea of the strategy
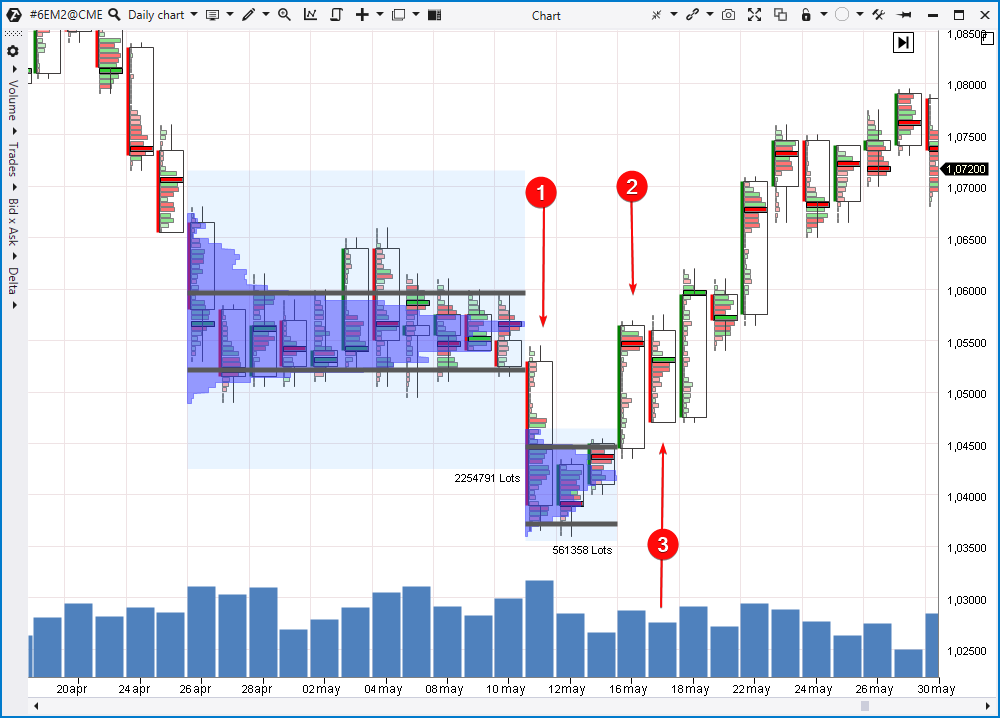
If the price moves below the range but then returns to it, this is a sign of sellers’ uncertainty and a lack of selling pressure to establish a downtrend. If the seller is weak, there is a reason to look for entries into long positions. The opposite is true for a false bullish breakout which indicates buyers’ weakness. Therefore, there are arguments for opening a short position. Let’s have a closer look at the same chart (the first candle is on March 17, 2022).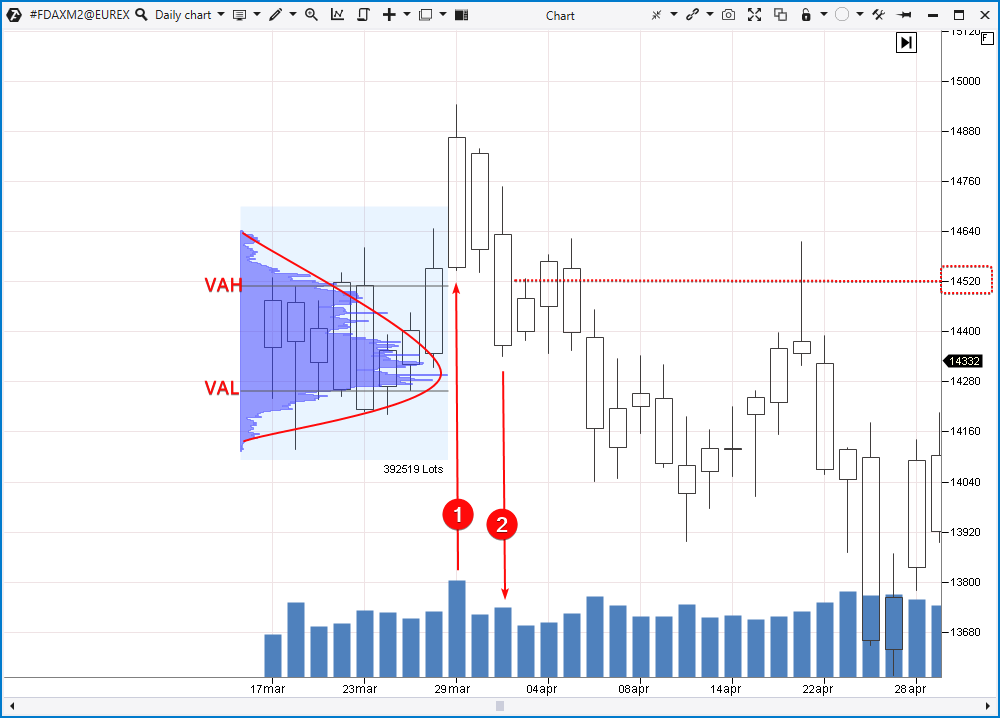
- there were not enough buyers in the market to support the bullish momentum;
- perhaps the impact of the news was overestimated, and purchases were made in the heat of the moment. Traders probably thought “faster, until it flew even higher”;
- the large volume on the 29th (1) represents buyers who tried “not to miss the boat”. This volume also shows short positions closed by stop-losses that were set above the range limits;
- a professional trader, who knows and sees more than anyone else, could use this spike of trading activity on a bullish breakout attempt to accumulate a short position. It is believed that a professional trader sells on a breakout and buys short positions from those who are forced to close them.
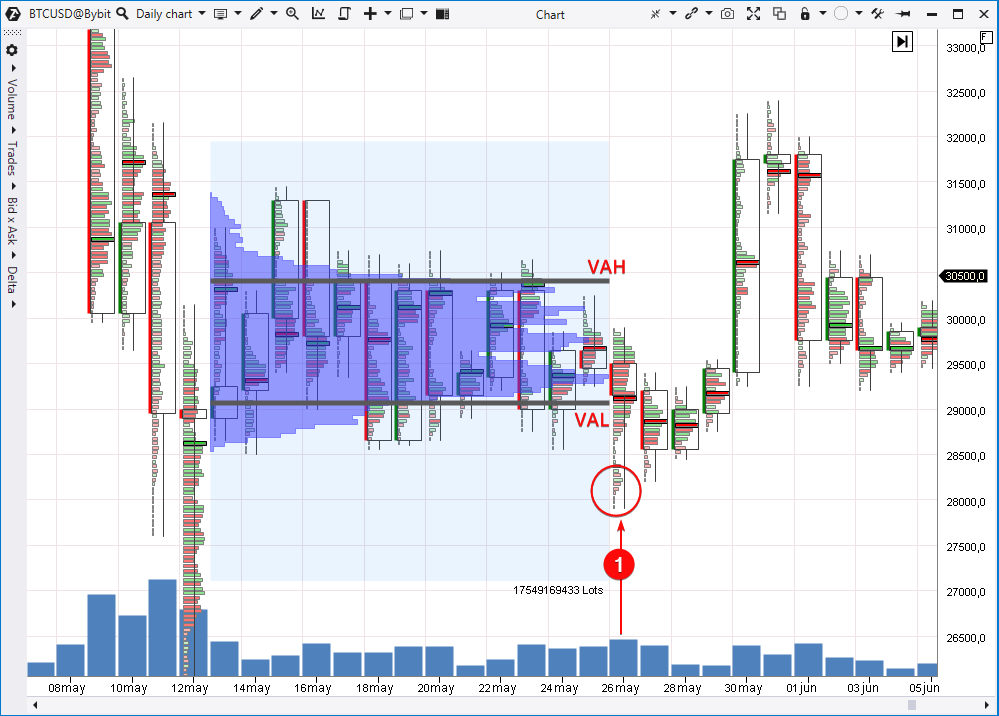
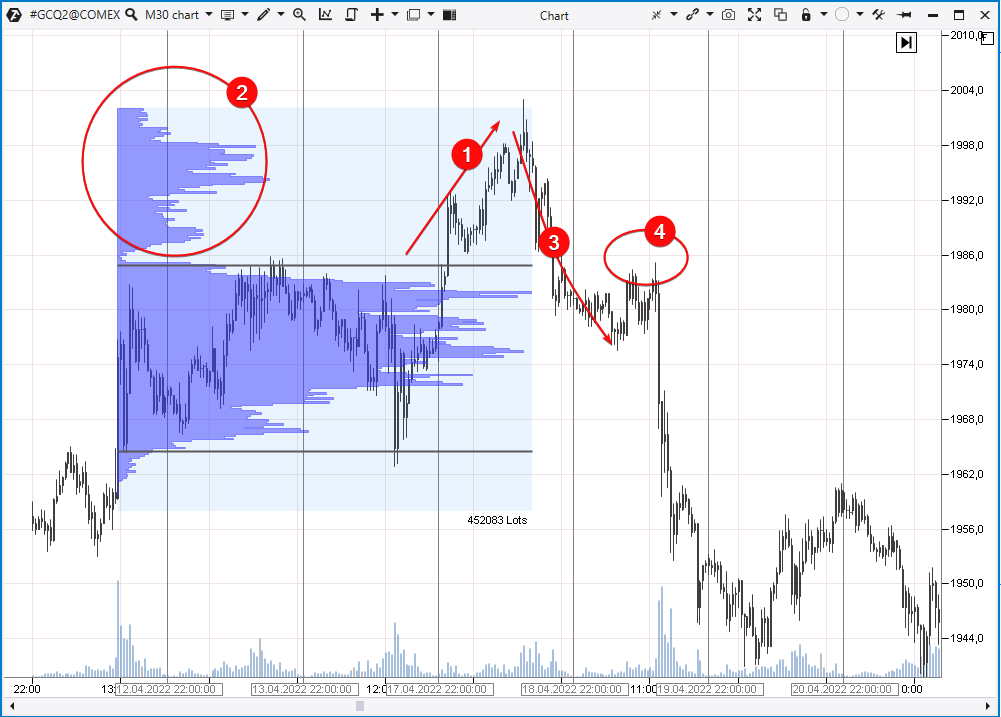
- An attempt at a bullish breakout of the range.
- Activity that can be described as follows: some traders affected by FOMO (fear of missing out on profits) enter long positions, while others are forced to exit short positions. Al professional uses this activity to create a large short position.
- The price returns to the range. The bullish breakout turns out to be a false one, so traders get an idea that a bearish breakout will be successful.
- An area to open short positions according to the described strategy.
How to start trading
We hope that information presented in the article was useful for you. It is worth noting that false breakouts appear quite often in any market. They make traders’ work more complicated. After all, if every breakout was a real one, it would be too easy to make money. The strategy described above is mostly aimed at entering a position on the first rollback after the very first impulse of a beginning trend. Profiles show balances and imbalances. When you notice a false breakout, analyze the idea of opening a position in the opposite direction of the false breakout. Use the ATAS tools to find an entry point more accurately, thereby reducing the risk. For example, if you use the speed of tape indicator, you can see a reversal on a fast time frame and enter a position so that the stop-loss is short and does not go beyond the false breakout extremum.Conclusions
False breakout trading allows you to make money where others lose it. Use the market profile to identify trading ranges, false breakouts and entry points according to the described strategy. To minimize the risk, look for more accurate entry points on lower time frames with the help of useful ATAS indicators. You can download ATAS for free right now and try a powerful tool for cluster chart analysis in stock, futures and crypto markets. It is easy to practice new trading strategies on the platform. Four good reasons to download ATAS:- It is free and you can continue using the program even after the 14-day trial period.
- You will be able to analyze divergences in the stock, futures and crypto markets.
- A demo account built into the platform allows you to practice trading without risking your real capital.
- The platform offers many benefits for traders who want to trade with easy-to-use cluster charts.
Information in this article cannot be perceived as a call for investing or buying/selling of any asset on the exchange. All situations, discussed in the article, are provided with the purpose of getting acquainted with the functionality and advantages of the ATAS platform.


