False breakout. How to identify and trade false breakouts
This article is dedicated to false breakouts. It speaks about what a false level or channel breakout is, how to build a trading strategy by false breakouts, how to tell a false breakout from a true one and many other things. This topic is vital, because failed breakouts take place every day in practically all markets.
Read in this article:
- False breakout. Basics.
- How to trade a false breakout – efforts of beginners and why they fail.
- How to improve false breakout trading using professional instruments of the ATAS platform.
- 5 advice for a false breakout trading strategy.
- Setup examples in cluster charts.
Principles, discussed in the article, are true for all financial markets.
False breakout in trading. Basics
What are false (failed) breakouts (breakthroughs)?
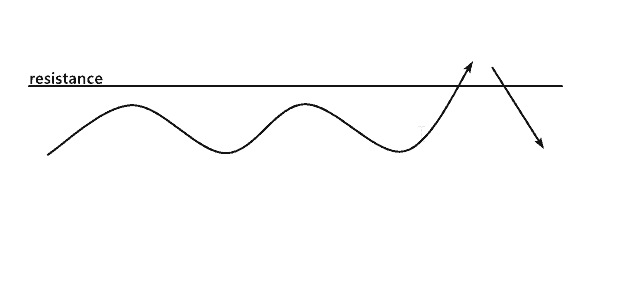
In simple words, a false breakout takes place when the price moves forward through some level but doesn’t have a sufficient impulse and moves back through the level.
These levels could be the following:
- horizontal support or resistance level;
- boundary of the chart pattern formation;
- round psychological levels;
- trend / Fibonacci retracement / channel lines and other elements.
The scheme of the resistance level false breakout is shown in the picture below (the opposite is true for the support level false breakout).
Although the above definition is rather loose, nevertheless false breakouts are well understood even by inexperienced traders.
The matter is that when a beginner starts to study trading, quite often one of the first strategies, which he tries to master, is the breakout trading strategy. It could be a breakout from a range or chart pattern – the breakout strategy idea lies in the desire to make profit from a big trend impulse by entering a trade at the beginning of a trend.
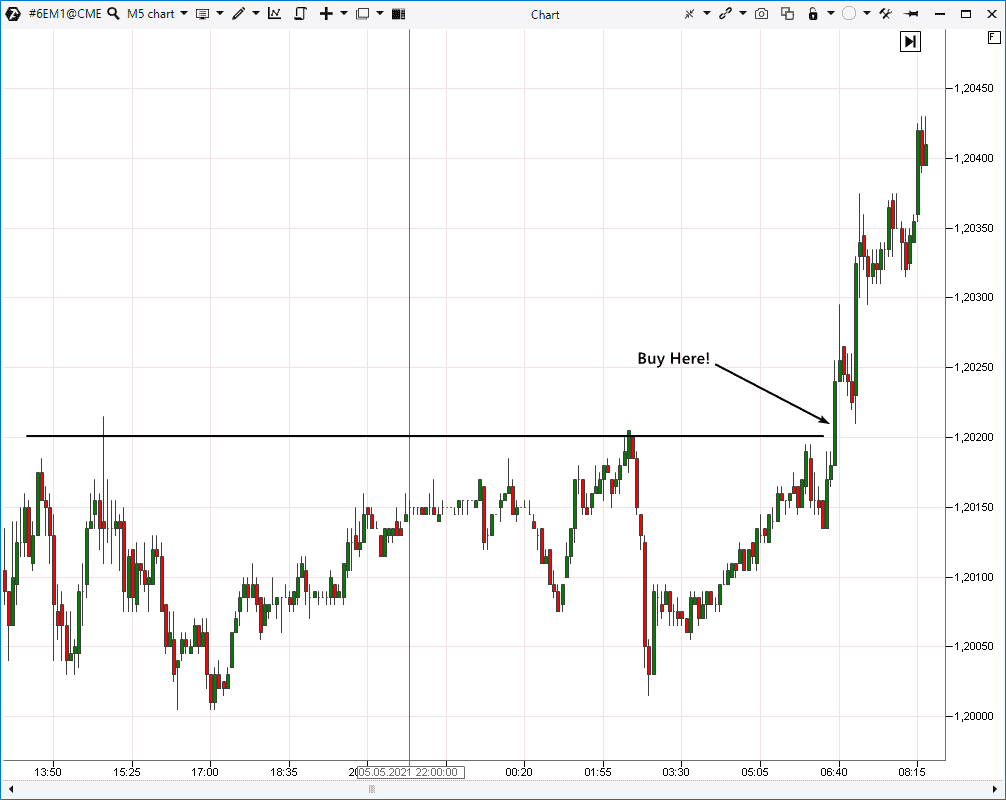
‘Buy a bit higher than the previous highs!’ – says the basic level breakout trading strategy (the Euro futures chart below shows an example of a signal for buying).
The breakout trading strategy makes sense. Sooner or later, a trade based on this strategy would be able to bring a big profit.
However, there are some difficulties:
- it is not a simple task to exit from a trade closer to a trend completion in order to catch a bigger part of the movement;
- as a rule, before such a trade takes place, there will be a series of false breakouts, when the price moves out of a pattern just to come back immediately.
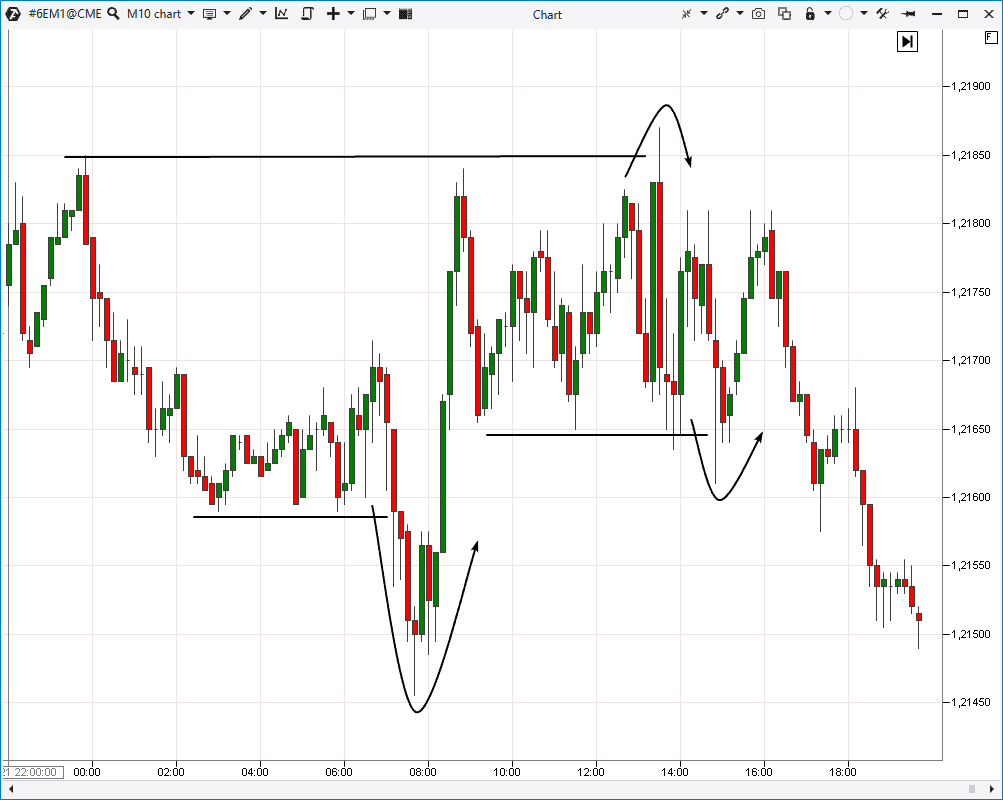
The chart below shows examples, which you can consider false breakouts.
These false breakouts would make a trader very nervous, permanently reducing his account.
In order to ‘filter out’ a false breakout, a trader might wait for a confirmation. Namely, to identify a false breakout of a level by candles, following a simple rule: ‘If the next candle after a breakout closes after the level, the breakout is true’.
However, it is not that straightforward.
Take heed of the events around 7:00-8:00 (down movement) in the chart above. Several candles really closed below the 1,2160 level. However, there was an up impulse at 9:00-10:00 and the price returned up, creating losses for those who believed that the down breakout of the 1,2160 level was true.
Level breakouts on news
You should admit that there has to be an impulse in order to overcome some resistance / support level. That is why ‘breakout hunters’ might focus on those breakout setups, which are formed during news publication.
However, there is no guarantee that an impulse, caused by some news, will be long enough to form a new trend. Moreover, a ‘bad’ news may be published after a ‘good’ one.
One example is the situation in the bitcoin market.
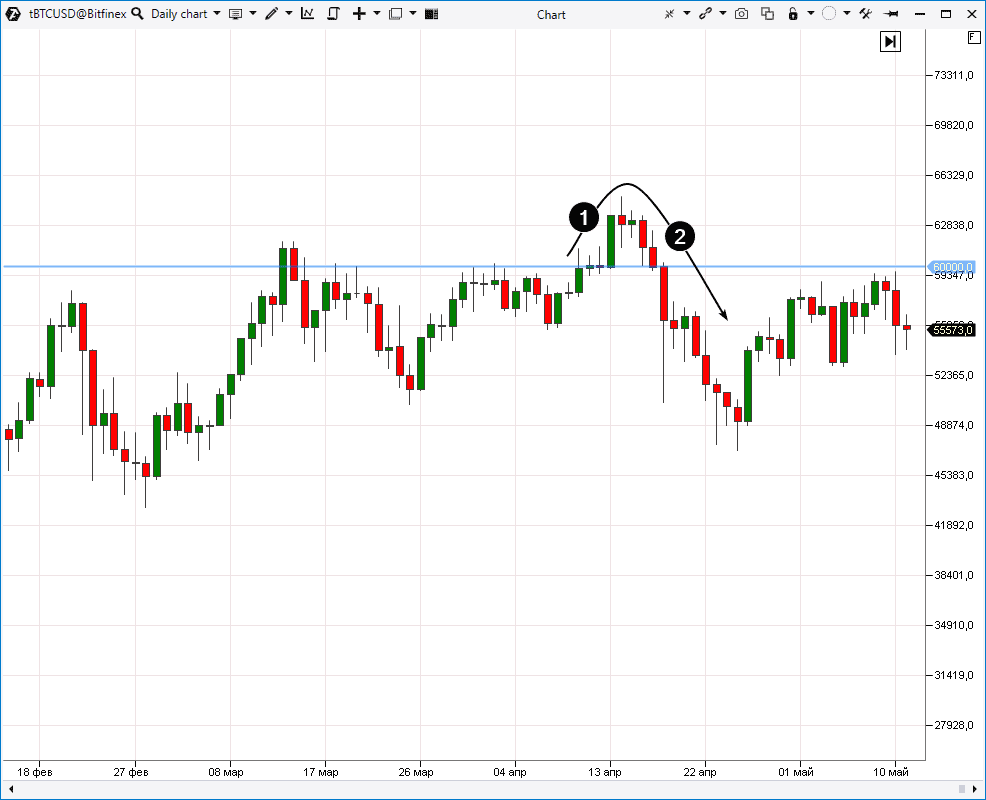
The price reached USD 64 thousand per coin on April 14 (1) on the background of good news about successful listing of the Coinbase stock on the Nasdaq exchange, having broken a multi-day round level of support at USD 60 thousand.
After ‘hanging about’ for a couple of days there, the price sharply fell (2) below USD 50 thousand on the background of rumors that the US Department of the Treasury plans to apply sanctions to a number of unmentioned firms, since they, perhaps, used bitcoin in money laundering schemes.
Traders, who entered into a long above 60k on good news, turned out to be victims of a false breakout.
If the breakout trading brings losses, does it make sense to act the other way round?
Why not trade a false breakout instead of entering in the direction of a supposed trend? If a trader constantly loses money due to false breakouts, maybe he will be able to earn money making them his allies?
It is an excellent idea, although such trading requires practice, concentration and high speed of decision making.
How to trade false breakouts?
First of all, take trading seriously – as a business rather than gambling. Your goal is a systematic and consistent growth of your capital. In order to achieve success in the long run, it is vital to study false breakouts as best as possible. Develop your strategy by creating your trading plan. It is really necessary – we do not write about it here just for the sake of SEO.
We prepared 5 advice to help you to gain insight into false breakouts:
- understand reasons of the false breakout occurrence;
- pay attention to round levels and extreme points of the periods;
- pay attention to the news;
- assess false breakouts in the trend context;
- pay attention to the Speed of Tape and/or OI Analyzer indicator behaviour.
Let’s discuss in more detail what we mean.
Advice 1. Understand reasons of the false breakout occurrence
We described true breakouts at the beginning of the article in detail for good reason. One of the false breakout goals – prevent traders from making an easy profit – is explained by the traders’ wish to make money on a big trend.
If a simple buy 1 tick higher than the previous high would have brought a profit, everybody would have been millionaires. However, it is not quite so.
Only exchanges and brokers make a guaranteed income in the financial markets when they take commission fees. Market makers have a high probability of receiving a profit, since they use preferences of trade organisers. You can also add professional participants to this list, who have advantages in technical and information provision.
What about the others? They should apportion the loss-making part of the game. And a false breakout provides efficient execution of this process and cluster charts reveal details.
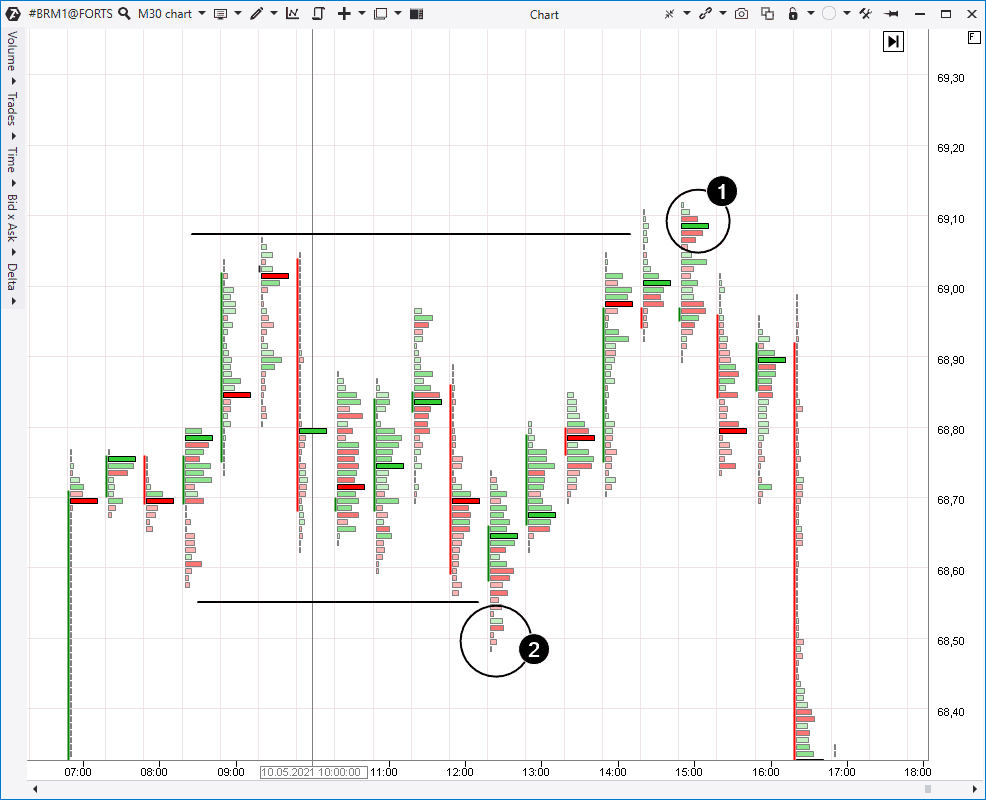
Example. The Brent oil futures cluster chart below reflects a 30-minute period, although the described processes are similar on other frames.
Note the bright green cluster (1), which shows predominance of market buyers over sellers when the price exceeds the previous local high. However, the price goes down after that, besides, the farther it goes, the worse it gets. Why did the price start to move down when there was buyer predominance in the market? It is not logical.
In fact, this happens in a majority of cases. Download the ATAS platform and look at local highs and lows. The green cluster in point 1 reflects:
- splash of activity of the beginners, who buy the breakout hoping for the growth continuation;
- activation of the seller stop losses (buy stop orders), which were posted above the local high.
Neither of the sides could be the force capable of developing a consistent uptrend, that is why we see down movement after a splash of buys.
The same takes place on the false bearish breakout (2). A splash of sells on the lower candlestick tail is not a true pressure of orders on the sells, but:
- activation of buyer stops below the previous low;
- entries of beginner ‘downtrend hunters’ into shorts.
Useful articles:
Advice 2. Track round levels and local extreme points
The chart above shows how the previous high false breakout was formed. This is a typical place where traders post the protective stops (it is written so in many books). Local extreme points are very convenient for this purpose, since they serve as a certain reference / standing point, on the basis of which you can easily make a decision to post a stop.
Namely that is why the price often ‘drifts in’ there. There is an example in the chart below. This is the GAZP stock (daily time-frame).
Before the price executed a true bullish breakout (8), several false ones were formed (1, 3, 5 and 6). Patterns number 2, 4 and 7 show examples of bearish false breakouts.
Another place where you can expect false breakouts are the round psychological levels (as an example, we can consider pattern 2 in the chart above, when the price moved under the ‘rather round level’ of 220).
Psychological levels have a property to attract the attention of traders for making decisions. For example:
- ‘I will hide the stop after the strong level of 100’;
- ‘if the price broke 200, it will reach 300’.
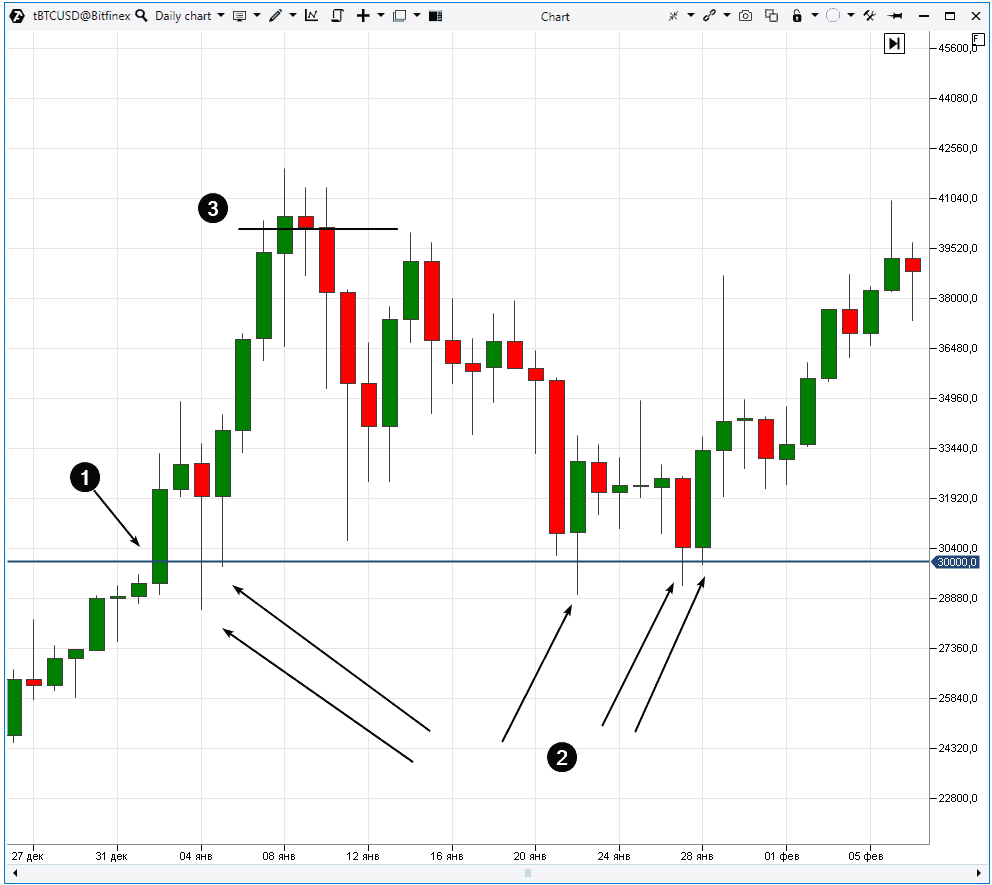
That is why we come across such situations as, say, in the bitcoin market (look at the chart below). After breaking the level of USD 30 thousand once (1), the price formed five false breakouts (2) of this level to:
- activate buyers’ protective sell stop orders, hidden behind the strong level;
- involve emotionally unstable participants, who thought: ‘it fell to 30, so it will move to 20!’, into sells.
Events with 4 false breakouts of the round level of USD 40 thousand per coin in a row (3) are similar processes but in the mirror reflection:
- ‘I will hide the stop behind 40k’;
- ‘it broke 40k, so it will reach 50k!’.
Advice 3. Pay attention to the news and session opening time
Moments of high volatility represent the time when the market displays its pure cunning predator nature. At these moments, the probability of the appearance of false breakouts (to be fair, true ones also) increases.
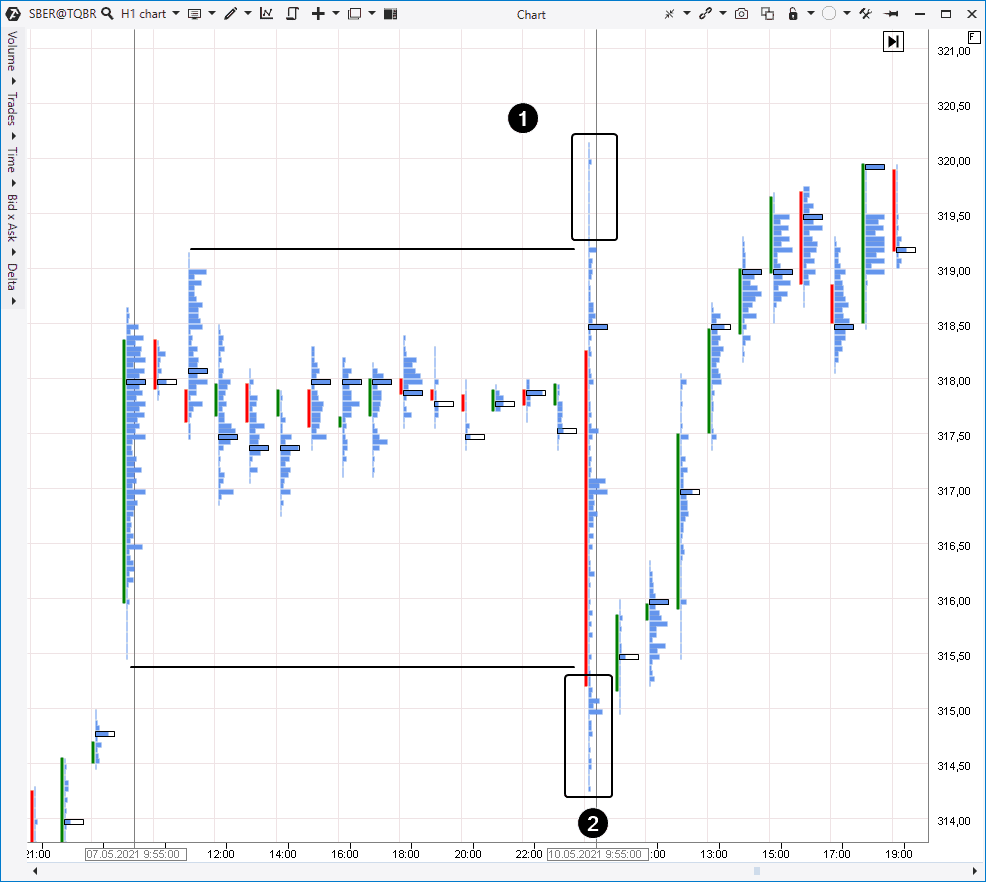
We can use as an example the false breakout situation in the bitcoin market when Coinbase got listed on the Nasdaq exchange. This chart is shown above, that is why we will show for one more illustration how the first 30-minute candle made 2 false breakouts above extreme points of the previous session at the opening of the Sberbank stock trading.
Advice 4. Track false breakouts in the trend context
Trend is a price direction. Many experts and experienced traders recommend to trade along the trend in order to increase your chances for making a profit.
The same point, which rationality cannot be disputed, is very true for trading false breakouts:
- if it is an uptrend, pay more attention to false bearish breakouts;
- if it is a downtrend, focus on false bullish breakouts.
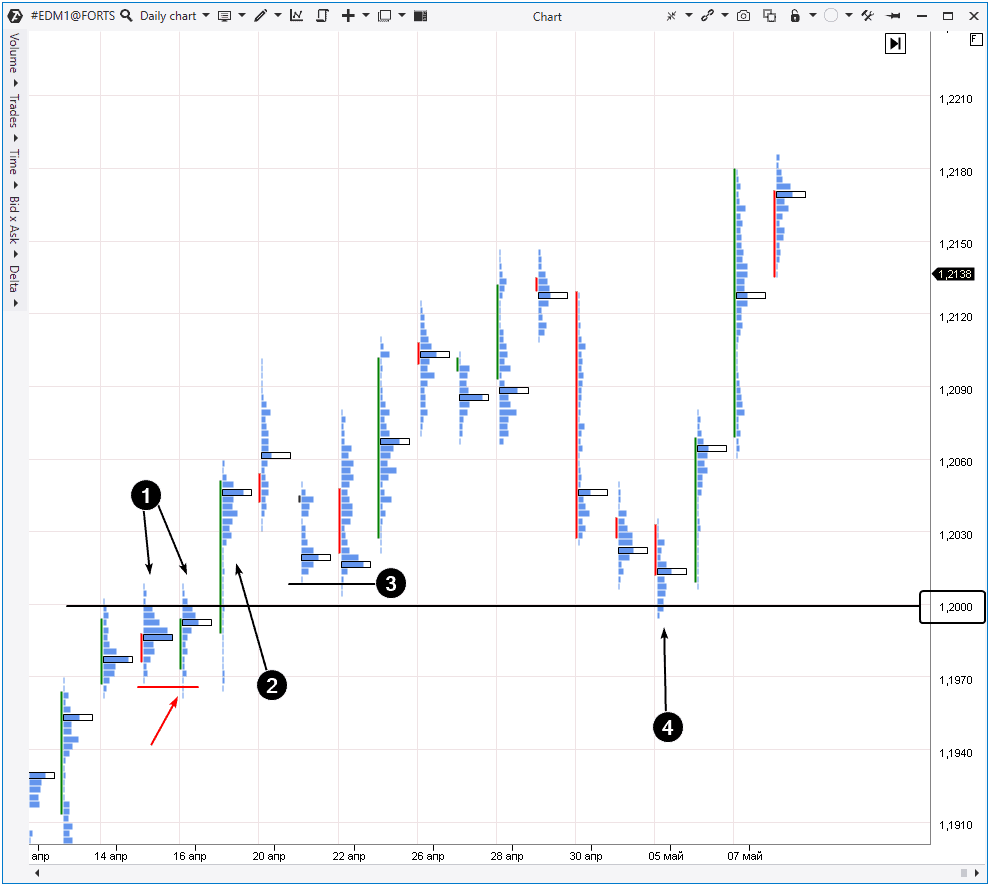
Example. The Moscow Exchange EUR/USD futures (daily period).
The price formed false breakouts (1) of the 1,200 round level on April 14-16, 2021.
Then, a true breakout took place. By the way, note the false bearish breakout, marked with a red arrow. Such local breakouts often confirm the true nature of a more global breakout in the opposite direction.
The price consolidated above the 1,200 level during the following days. Traders received the facts, which confirmed that bullish moods dominate in the market, because the price increases, and whatever trend indicators you take, they will show buying signals.
If you take the confirmation that there is an uptrend in the market as a basis, give preference to false bearish breakouts. A good entry point was not long in coming. The false bearish breakout of the April 21 low took place in the market already on April 22 (3).
Another case was on May 5 (4). The price ‘looked’ under the 1,200 low in order to hook the stop losses, ‘hidden’ there. When there is an uptrend in the market, the buyers tend to increase their stops (the trailing tactics). Use it for your benefit: false bearish breakouts in the growing market context is a way to enter a trend when others are forced to exit from it.
If you assess false breakouts in the acting trend context, instruments for building the market profile can help you. As you know from the auction theory, Steidlmayer and Dalton studies and articles of the market profile researchers, the price development could be split into 2 stages, which interchange in the endless cycle:
trend → balance → trend → balance → …
The following will be formed on the profile:
- Bell-shaped bulges when the price is in the balance.
- Thin (narrow) profiles when the price, during a trend, advances to new balance levels.
You can study this topic further in the following articles:
- how to use the horizontal volume;
- the market auction theory;
- 5 important elements of the TPO indicator according to Jim Dalton.
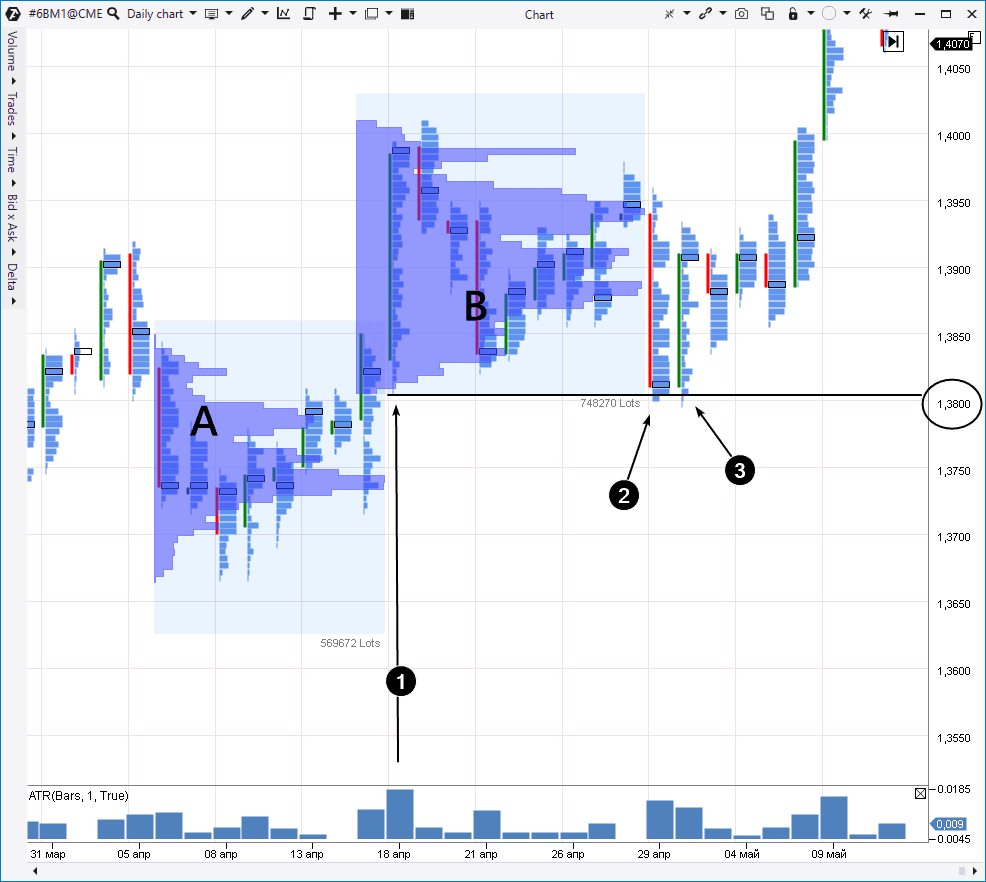
We will illustrate our advice using a practical example. Below you can see a daily GBP futures chart.
The price quickly moved up on April 18 (1). Besides, the ATR indicator (with the period = 1) shows that the day was especially volatile (in fact, that was Monday, April 19, but the chart shows May 18 because of different time settings).
Besides, the price left the balance area, which is shown as profile A, and moved up in order to form a new profile B. What does it mean? It means that actions of the market participants testify to the fact that balance A is not topical any more and the demand-supply consensus is somewhere higher. That is why we can see that the maximum volumes of trades are executed at 1,385-1,395 levels, forming bulges on the profile.
Based on these facts, we have the grounds to state that if there are trend moods in the market, most probably, they are bullish ones. Then you have to look for bearish failed efforts to push the price down if you want to trade false breakouts.
The expected setups emerged on the last April day (2) and first May trading day (3). Moreover, there is something interesting in these false breakouts:
- they go down below the bar low (1) on April 18 because, most probably, traders posted stops below the low of this significant day;
- the low 3 goes below the low 2, so, there is a double false breakout. The second one ‘cleans up stops’ under the first one;
- perhaps, there was an effort to ‘look’ under the round level of 1,380, but it withstood.
And when the maximum number of buyers were forced to exit from the market, it manifested its real bullish nature reaching the 1,415 level by May 9.
Useful articles:
- How to improve trading by the market profile.
- ’Narrow profile’ trading strategy.
Advice 5. Pay attention to the indicator behaviour
You can use all kinds of indicators for the false breakout trading strategy – for example, for receiving a signal from smaller time-frames about an entry into a position when a potential false breakout has been formed on longer time-frames.
We will show you in this article how to get confirmations with the help of the Speed of Tape. Although you can also use other instruments – Cumulative Delta, Cluster Search and others.
Example. Speed of Tape is the indicator of the speed, with which new prints appear on the tape. In other words, it shows how often trades are executed. Besides, it has a useful possibility of selecting the income data. You can set up the indicator for the speed of buys / sells / ticks / volume / delta. We will use the Speed of Tape in the Delta mode.
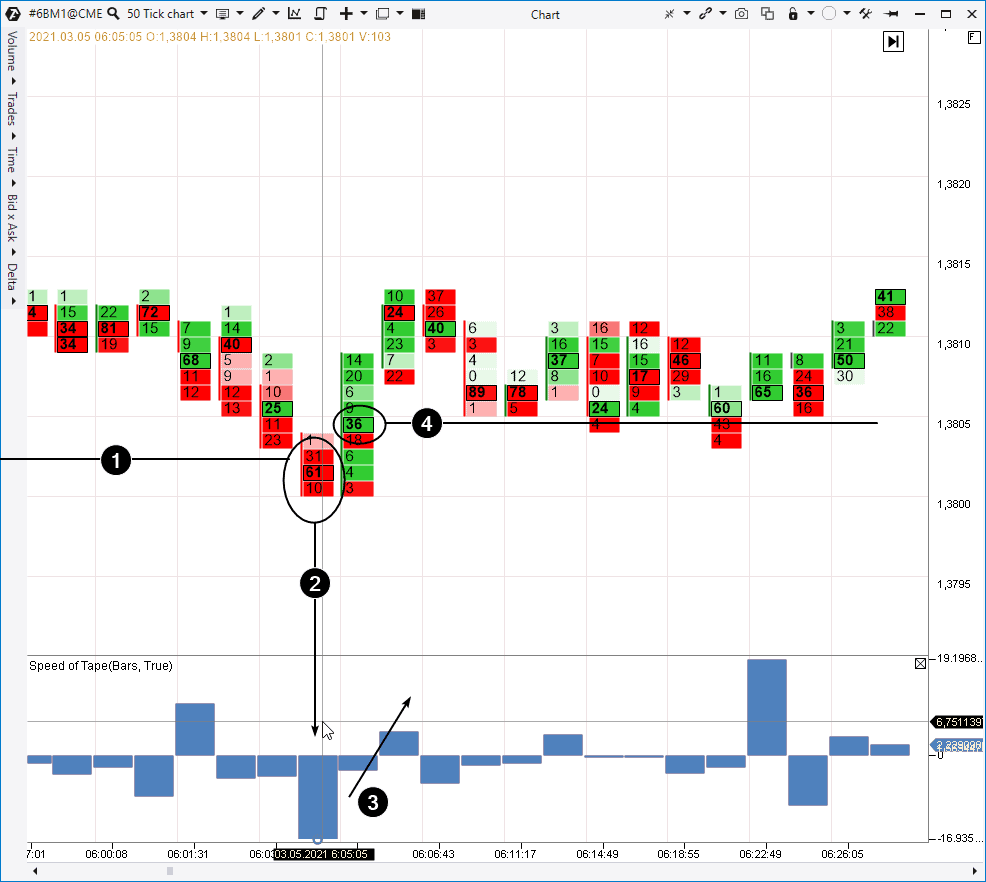
The cluster chart below shows the GBP futures price dynamics. We will use the tick frame in order to see every detail of the fast moving false breakout, which is marked with number 3 in the chart (the May 3 low).
We marked the previous session’s low level with number 1.
When the price moves below it (2), a big red cluster appears in the chart (61) and the Speed of Tape indicator shows that the speed of the sell trades execution sharply increased. This is typical for cases when the price reaches the pending order accumulation level (in our case – the buyer stops and the seller breakout orders).
However, the situation changes dramatically on the next bar. The price quickly moves back behind the breakout level and the indicator (3) shows a shift towards a positive buy. This is the sign of the fact that the false breakout took place.
You can act:
- aggressively, looking for points of entry into a long immediately after the bar (2);
- conservatively, for example, by opening a long from the level (4) of a big cluster with the green delta, which appeared in the false breakout formation completion.
Useful links:
Conclusions:
Is there a way to tell a false breakout from a true one?
We tend to believe that there is no magic instrument which can do it with 100% guarantee, since trading in the sensitive financial markets is a play of probabilities. We hope that materials of the present article will help you to increase your chances for success in the false breakout trading.
This subject has potential. As David Weis (the author of the Weis Waves indicator) said:
‘You can make a living, trading nothing but Springs and Upthrusts’.
Strings and Upthrusts are false breakouts in the VSA terminology. We have a separate article on this subject.
By the way, Tom Williams, the VSA founder, often spoke about Upthrusts: ‘You should become alert if you meet a white bear in Africa and not in the Arctic’. Perhaps, it would be a good thought for ending the article.
If you want to find a false breakout, look for it where it would look natural. This will increase your chances to tell a false breakout from a true one. Useful instruments of the powerful ATAS platform will help you to get a confirmation and make a correct decision with a reasonable risk.
Download ATAS to see how false breakouts are formed in the markets, which you monitor.
Information in this article cannot be perceived as a call for investing or buying/selling of any asset on the exchange. All situations, discussed in the article, are provided with the purpose of getting acquainted with the functionality and advantages of the ATAS platform.

